Molecule Information
General Information of the Molecule (ID: Mol00590)
| Name |
Ras association domain-containing protein 1 (RASSF1)
,Homo sapiens
|
||||
|---|---|---|---|---|---|
| Synonyms |
RDA32
Click to Show/Hide
|
||||
| Molecule Type |
Protein
|
||||
| Gene Name |
RASSF1
|
||||
| Gene ID | |||||
| Location |
chr3:50329782-50340980[-]
|
||||
| Sequence |
MSGEPELIELRELAPAGRAGKGRTRLERANALRIARGTACNPTRQLVPGRGHRFQPAGPA
THTWCDLCGDFIWGVVRKGLQCARLSADCKFTCHYRCRALVCLDCCGPRDLGWEPAVERD TNVDEPVEWETPDLSQAEIEQKIKEYNAQINSNLFMSLNKDGSYTGFIKVQLKLVRPVSV PSSKKPPSLQDARRGPGRGTSVRRRTSFYLPKDAVKHLHVLSRTRAREVIEALLRKFLVV DDPRKFALFERAERHGQVYLRKLLDDEQPLRLRLLAGPSDKALSFVLKENDSGEVNWDAF SMPELHNFLRILQREEEEHLRQILQKYSYCRQKIQEALHACPLG Click to Show/Hide
|
||||
| 3D-structure |
|
||||
| Function |
Potential tumor suppressor. Required for death receptor-dependent apoptosis. Mediates activation of STK3/MST2 and STK4/MST1 during Fas-induced apoptosis by preventing their dephosphorylation. When associated with MOAP1, promotes BAX conformational change and translocation to mitochondrial membranes in response to TNF and TNFSF10 stimulation. Isoform A interacts with CDC20, an activator of the anaphase-promoting complex, APC, resulting in the inhibition of APC activity and mitotic progression. Inhibits proliferation by negatively regulating cell cycle progression at the level of G1/S-phase transition by regulating accumulation of cyclin D1 protein. Isoform C has been shown not to perform these roles, no function has been identified for this isoform. Isoform A disrupts interactions among MDM2, DAXX and USP7, thus contributing to the efficient activation of TP53 by promoting MDM2 self-ubiquitination in cell-cycle checkpoint control in response to DNA damage.
Click to Show/Hide
|
||||
| Uniprot ID | |||||
| Ensembl ID | |||||
| HGNC ID | |||||
| Click to Show/Hide the Complete Species Lineage | |||||
Type(s) of Resistant Mechanism of This Molecule
Drug Resistance Data Categorized by Drug
Approved Drug(s)
2 drug(s) in total
| Drug Sensitivity Data Categorized by Their Corresponding Mechanisms | ||||
|
|
||||
| Disease Class: Hepatocellular carcinoma [ICD-11: 2C12.2] | [1] | |||
| Sensitive Disease | Hepatocellular carcinoma [ICD-11: 2C12.2] | |||
| Sensitive Drug | Sorafenib | |||
| Molecule Alteration | Expression | Up-regulation |
||
| Differential expression of the molecule in resistant disease | ||||
| Classification of Disease | Liver cancer [ICD-11: 2C12] | |||
| The Specified Disease | Liver cancer | |||
| The Studied Tissue | Liver tissue | |||
| The Expression Level of Disease Section Compare with the Healthy Individual Tissue | p-value: 1.26E-03 Fold-change: 3.99E-02 Z-score: 3.40E+00 |
|||
| Experimental Note | Revealed Based on the Cell Line Data | |||
| Cell Pathway Regulation | Cell apoptosis | Activation | hsa04210 | |
| Cell proliferation | Inhibition | hsa05200 | ||
| MAPK signaling pathway | Inhibition | hsa04010 | ||
| In Vitro Model | HepG2 cells | Liver | Homo sapiens (Human) | CVCL_0027 |
| Hep3B cells | Liver | Homo sapiens (Human) | CVCL_0326 | |
| Experiment for Molecule Alteration |
Western blot analysis | |||
| Experiment for Drug Resistance |
Caspase 3/7 activity analysis; CCK8 assay | |||
| Mechanism Description | miR-181a induces sorafenib resistance of hepatocellular carcinoma cells through downregulation of RASSF1 expression. | |||
| Drug Resistance Data Categorized by Their Corresponding Mechanisms | ||||
|
|
||||
| Disease Class: Germ cell tumor [ICD-11: 2D12.Y] | [2] | |||
| Resistant Disease | Germ cell tumor [ICD-11: 2D12.Y] | |||
| Resistant Drug | Cisplatin | |||
| Molecule Alteration | Methylation | Up-regulation |
||
| Experimental Note | Identified from the Human Clinical Data | |||
| In Vitro Model | 833K-E cells | Ascites | Homo sapiens (Human) | CVCL_2292 |
| Experiment for Molecule Alteration |
Western blotting assay | |||
| Mechanism Description | Promoter hypermethylation of RASSF1A and HIC1 genes play a role in resistance of GCT, while the transcriptional inactivation of MGMT by epigenetic alterations confer exquisite sensitivity to cisplatin. | |||
Disease- and Tissue-specific Abundances of This Molecule
ICD Disease Classification 02

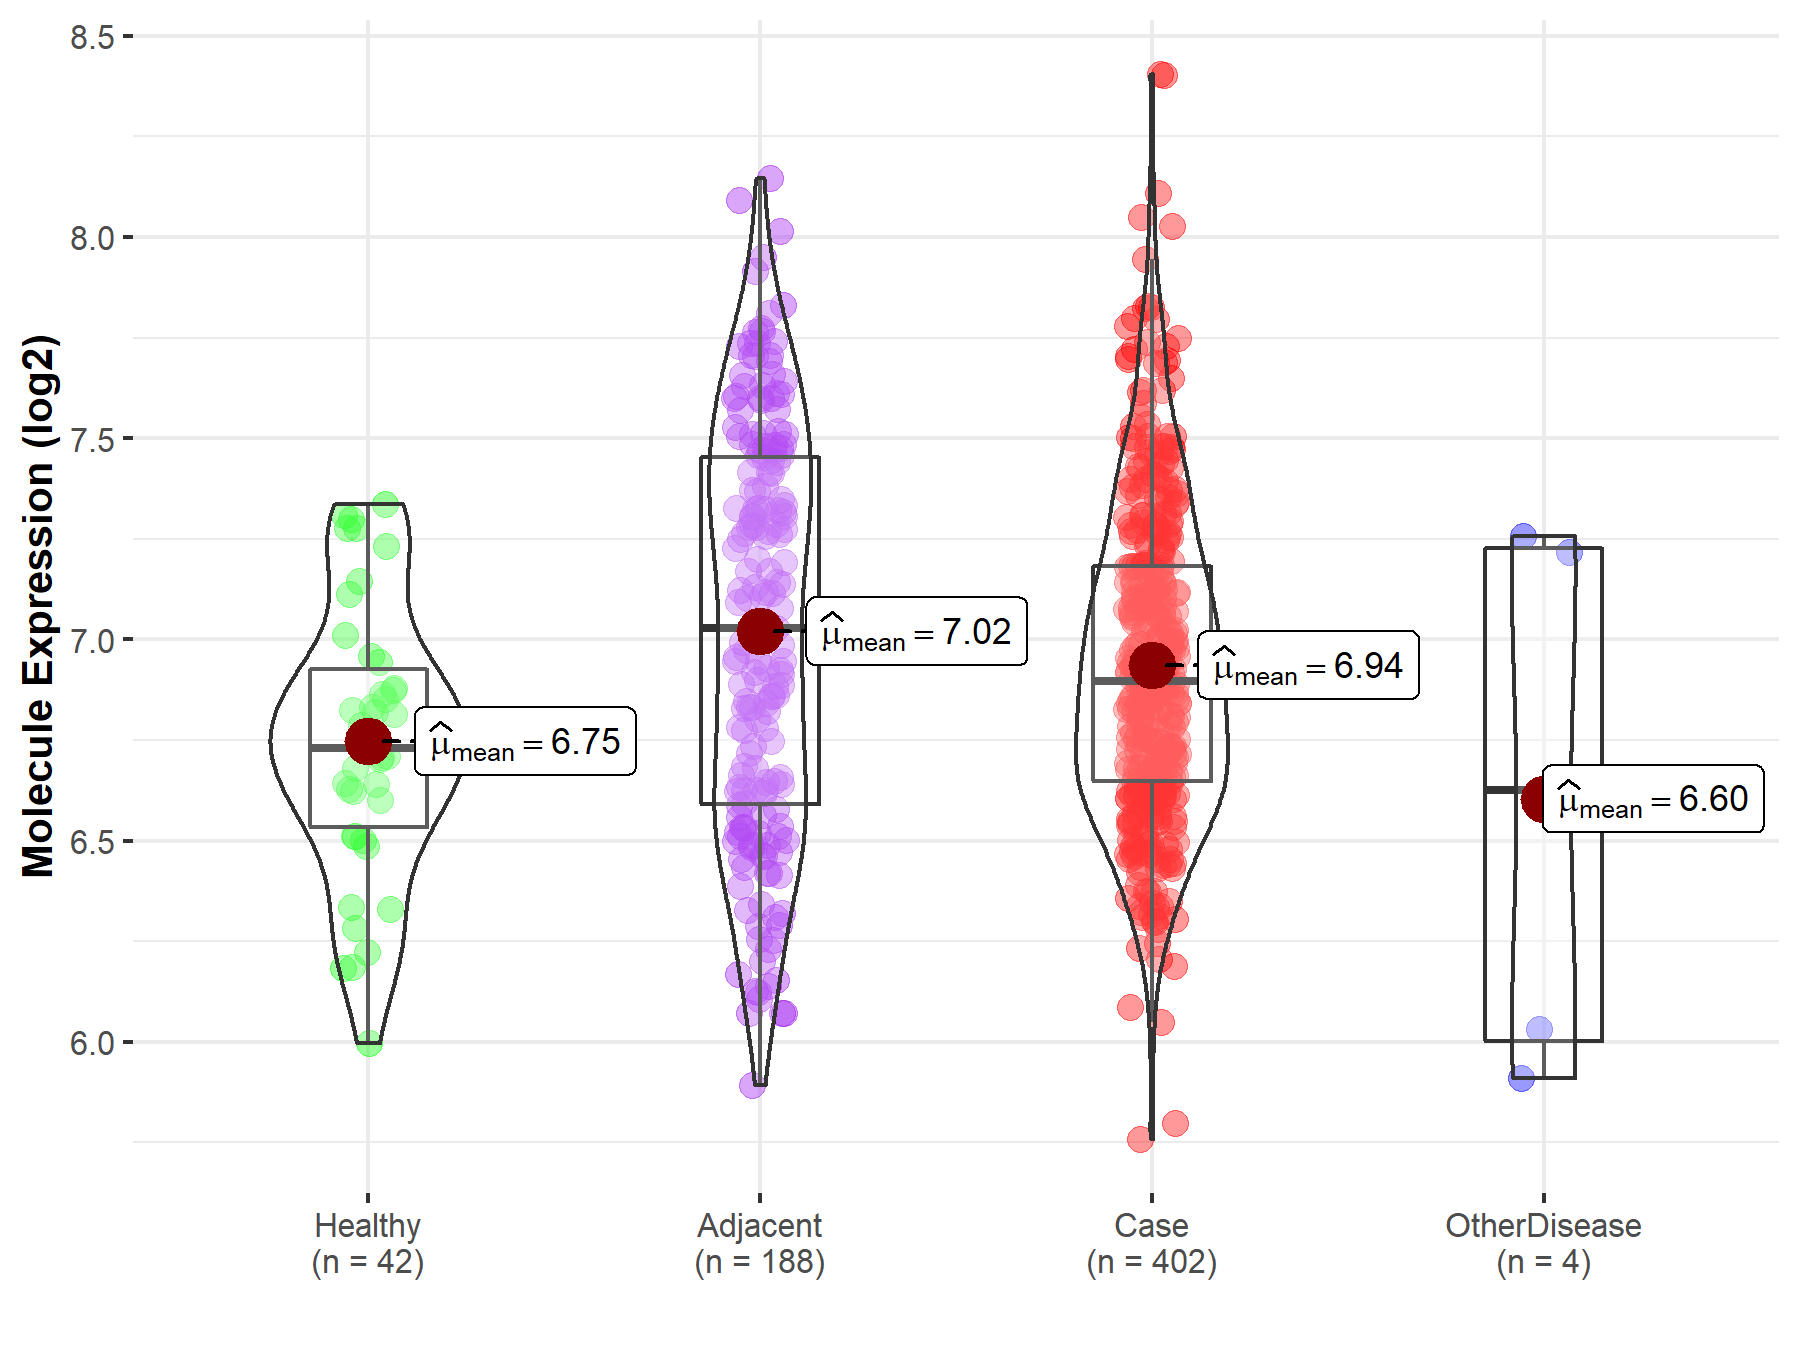
| Differential expression of molecule in resistant diseases | ||
| The Studied Tissue | Liver | |
| The Specified Disease | Liver cancer | |
| The Expression Level of Disease Section Compare with the Healthy Individual Tissue | p-value: 1.26E-03; Fold-change: 1.65E-01; Z-score: 4.92E-01 | |
| The Expression Level of Disease Section Compare with the Adjacent Tissue | p-value: 4.63E-02; Fold-change: -1.32E-01; Z-score: -2.61E-01 | |
| The Expression Level of Disease Section Compare with the Other Disease Section | p-value: 4.31E-01; Fold-change: 2.72E-01; Z-score: 3.70E-01 | |
|
Molecule expression in the normal tissue adjacent to the diseased tissue of patients
Molecule expression in the diseased tissue of patients
Molecule expression in the normal tissue of healthy individuals
Molecule expression in tissue other than the diseased tissue of patients
|
||
| Disease-specific Molecule Abundances |

|
Click to View the Clearer Original Diagram |
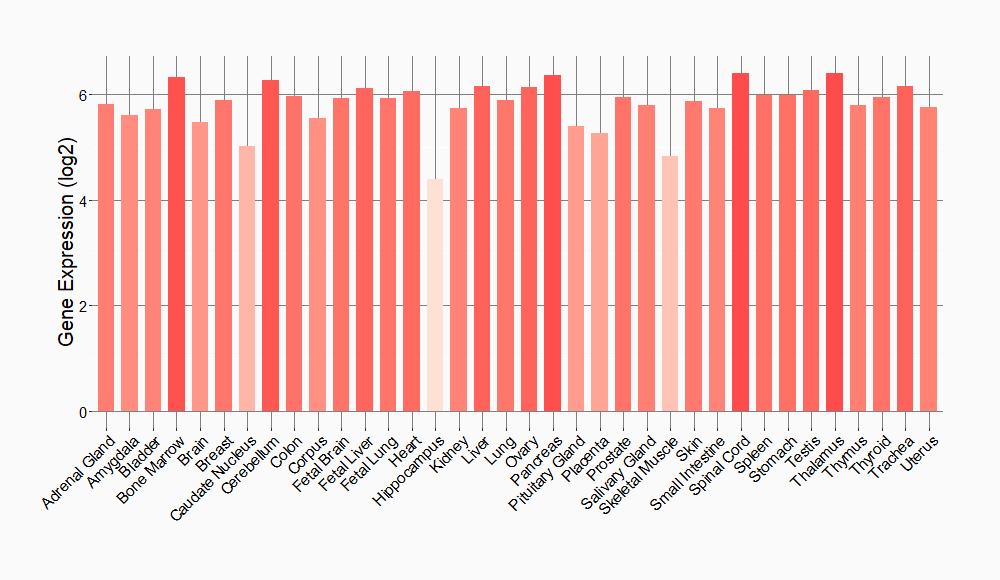
Tissue-specific Molecule Abundances in Healthy Individuals


|
||
References
If you find any error in data or bug in web service, please kindly report it to Dr. Sun and Dr. Yu.
