Molecule Information
General Information of the Molecule (ID: Mol00584)
| Name |
Ras-related C3 botulinum toxin substrate 1 (RAC1)
,Homo sapiens
|
||||
|---|---|---|---|---|---|
| Synonyms |
Cell migration-inducing gene 5 protein; Ras-like protein TC25; p21-Rac1; TC25; MIG5
Click to Show/Hide
|
||||
| Molecule Type |
Protein
|
||||
| Gene Name |
RAC1
|
||||
| Gene ID | |||||
| Location |
chr7:6374527-6403967[+]
|
||||
| Sequence |
MQAIKCVVVGDGAVGKTCLLISYTTNAFPGEYIPTVFDNYSANVMVDGKPVNLGLWDTAG
QEDYDRLRPLSYPQTDVFLICFSLVSPASFENVRAKWYPEVRHHCPNTPIILVGTKLDLR DDKDTIEKLKEKKLTPITYPQGLAMAKEIGAVKYLECSALTQRGLKTVFDEAIRAVLCPP PVKKRKRKCLLL Click to Show/Hide
|
||||
| 3D-structure |
|
||||
| Function |
Plasma membrane-associated small GTPase which cycles between active GTP-bound and inactive GDP-bound states. In its active state, binds to a variety of effector proteins to regulate cellular responses such as secretory processes, phagocytosis of apoptotic cells, epithelial cell polarization, neurons adhesion, migration and differentiation, and growth-factor induced formation of membrane ruffles. Rac1 p21/rho GDI heterodimer is the active component of the cytosolic factor sigma 1, which is involved in stimulation of the NADPH oxidase activity in macrophages. Essential for the SPATA13-mediated regulation of cell migration and adhesion assembly and disassembly. Stimulates PKN2 kinase activity. In concert with RAB7A, plays a role in regulating the formation of RBs (ruffled borders) in osteoclasts. In podocytes, promotes nuclear shuttling of NR3C2; this modulation is required for a proper kidney functioning. Required for atypical chemokine receptor ACKR2-induced LIMK1-PAK1-dependent phosphorylation of cofilin (CFL1) and for up-regulation of ACKR2 from endosomal compartment to cell membrane, increasing its efficiency in chemokine uptake and degradation. In neurons, is involved in dendritic spine formation and synaptic plasticity. In hippocampal neurons, involved in spine morphogenesis and synapse formation, through local activation at synapses by guanine nucleotide exchange factors (GEFs), such as ARHGEF6/ARHGEF7/PIX. In synapses, seems to mediate the regulation of F-actin cluster formation performed by SHANK3. In neurons, plays a crucial role in regulating GABA(A) receptor synaptic stability and hence GABAergic inhibitory synaptic transmission through its role in PAK1 activation and eventually F-actin stabilization.
Click to Show/Hide
|
||||
| Uniprot ID | |||||
| Ensembl ID | |||||
| HGNC ID | |||||
| Click to Show/Hide the Complete Species Lineage | |||||
Type(s) of Resistant Mechanism of This Molecule
Drug Resistance Data Categorized by Drug
Approved Drug(s)
2 drug(s) in total
| Drug Resistance Data Categorized by Their Corresponding Mechanisms | ||||
|
|
||||
| Disease Class: Non-small cell lung cancer [ICD-11: 2C25.Y] | [1] | |||
| Resistant Disease | Non-small cell lung cancer [ICD-11: 2C25.Y] | |||
| Resistant Drug | Gefitinib | |||
| Molecule Alteration | Expression | Up-regulation |
||
| Experimental Note | Revealed Based on the Cell Line Data | |||
| Cell Pathway Regulation | Cell apoptosis | Inhibition | hsa04210 | |
| Cell invasion | Activation | hsa05200 | ||
| Cell viability | Activation | hsa05200 | ||
| PI3K/AKT signaling pathway | Activation | hsa04151 | ||
| In Vitro Model | NCI-H1650 cells | Lung | Homo sapiens (Human) | CVCL_1483 |
| NCI-H1975 cells | Lung | Homo sapiens (Human) | CVCL_1511 | |
| Experiment for Molecule Alteration |
Western blot analysis | |||
| Experiment for Drug Resistance |
CCK8 assay; Flow cytometry assay; Transwell assay | |||
| Mechanism Description | miR-135a promoted cell growth and metastasis and activated the PI3k/AkT signaling pathway via a RAC1-dependent manner. | |||
| Drug Resistance Data Categorized by Their Corresponding Mechanisms | ||||
|
|
||||
| Disease Class: Acute myeloid leukemia [ICD-11: 2A60.0] | [2] | |||
| Resistant Disease | Acute myeloid leukemia [ICD-11: 2A60.0] | |||
| Resistant Drug | Midostaurin | |||
| Molecule Alteration | Function | Activation |
||
| Experimental Note | Revealed Based on the Cell Line Data | |||
| In Vitro Model | HEK293 cells | Kidney | Homo sapiens (Human) | CVCL_0045 |
| 786-O cells | Kidney | Homo sapiens (Human) | CVCL_1051 | |
| Experiment for Molecule Alteration |
RAC1 activation assay | |||
| Experiment for Drug Resistance |
CellTiter-Glo Luminescent Cell Viability Assay; Flow cytometric analysis | |||
| Mechanism Description | Midostaurin resistance can be overcome by a combination of midostaruin, the BCL-2 inhibitor venetoclax and the RAC1 inhibitor Eht1864 in midostaurin-resistant AML cell lines and primary samples, providing the first evidence of a potential new treatment approach to eradicate FLT3-ITD + AML. | |||
Disease- and Tissue-specific Abundances of This Molecule
ICD Disease Classification 02

| Differential expression of molecule in resistant diseases | ||
| The Studied Tissue | Bone marrow | |
| The Specified Disease | Acute myeloid leukemia | |
| The Expression Level of Disease Section Compare with the Healthy Individual Tissue | p-value: 2.46E-09; Fold-change: 2.90E-01; Z-score: 8.76E-01 | |
|
Molecule expression in the diseased tissue of patients
Molecule expression in the normal tissue of healthy individuals
|
||
| Disease-specific Molecule Abundances |

|
Click to View the Clearer Original Diagram |
| Differential expression of molecule in resistant diseases | ||
| The Studied Tissue | Lung | |
| The Specified Disease | Lung cancer | |
| The Expression Level of Disease Section Compare with the Healthy Individual Tissue | p-value: 2.00E-02; Fold-change: -8.23E-02; Z-score: -1.58E-01 | |
| The Expression Level of Disease Section Compare with the Adjacent Tissue | p-value: 9.66E-01; Fold-change: 3.97E-02; Z-score: 6.79E-02 | |
|
Molecule expression in the normal tissue adjacent to the diseased tissue of patients
Molecule expression in the diseased tissue of patients
Molecule expression in the normal tissue of healthy individuals
|
||
| Disease-specific Molecule Abundances |

|
Click to View the Clearer Original Diagram |
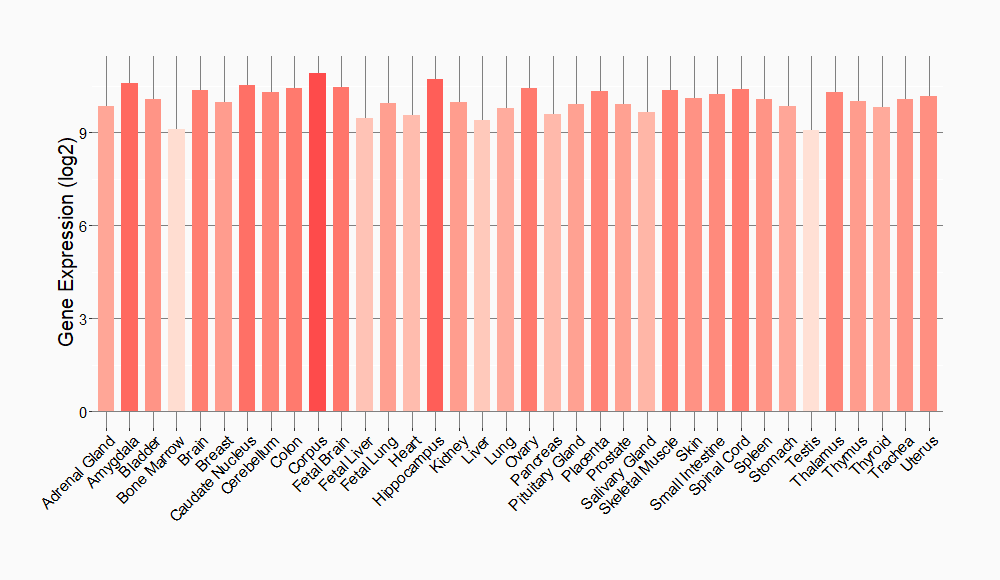
Tissue-specific Molecule Abundances in Healthy Individuals


|
||
References
If you find any error in data or bug in web service, please kindly report it to Dr. Sun and Dr. Yu.
