Molecule Information
General Information of the Molecule (ID: Mol00557)
| Name |
Prostaglandin G/H synthase 2 (PTGS2)
,Homo sapiens
|
||||
|---|---|---|---|---|---|
| Synonyms |
Cyclooxygenase-2; COX-2; PHS II; Prostaglandin H2 synthase 2; PGH synthase 2; PGHS-2; Prostaglandin-endoperoxide synthase 2; COX2
Click to Show/Hide
|
||||
| Molecule Type |
Protein
|
||||
| Gene Name |
PTGS2
|
||||
| Gene ID | |||||
| Location |
chr1:186671791-186680922[-]
|
||||
| Sequence |
MLARALLLCAVLALSHTANPCCSHPCQNRGVCMSVGFDQYKCDCTRTGFYGENCSTPEFL
TRIKLFLKPTPNTVHYILTHFKGFWNVVNNIPFLRNAIMSYVLTSRSHLIDSPPTYNADY GYKSWEAFSNLSYYTRALPPVPDDCPTPLGVKGKKQLPDSNEIVEKLLLRRKFIPDPQGS NMMFAFFAQHFTHQFFKTDHKRGPAFTNGLGHGVDLNHIYGETLARQRKLRLFKDGKMKY QIIDGEMYPPTVKDTQAEMIYPPQVPEHLRFAVGQEVFGLVPGLMMYATIWLREHNRVCD VLKQEHPEWGDEQLFQTSRLILIGETIKIVIEDYVQHLSGYHFKLKFDPELLFNKQFQYQ NRIAAEFNTLYHWHPLLPDTFQIHDQKYNYQQFIYNNSILLEHGITQFVESFTRQIAGRV AGGRNVPPAVQKVSQASIDQSRQMKYQSFNEYRKRFMLKPYESFEELTGEKEMSAELEAL YGDIDAVELYPALLVEKPRPDAIFGETMVEVGAPFSLKGLMGNVICSPAYWKPSTFGGEV GFQIINTASIQSLICNNVKGCPFTSFSVPDPELIKTVTINASSSRSGLDDINPTVLLKER STEL Click to Show/Hide
|
||||
| 3D-structure |
|
||||
| Function |
Dual cyclooxygenase and peroxidase in the biosynthesis pathway of prostanoids, a class of C20 oxylipins mainly derived from arachidonate, with a particular role in the inflammatory response. The cyclooxygenase activity oxygenates arachidonate (AA, C20:4(n-6)) to the hydroperoxy endoperoxide prostaglandin G2 (PGG2), and the peroxidase activity reduces PGG2 to the hydroxy endoperoxide PGH2, the precursor of all 2-series prostaglandins and thromboxanes. This complex transformation is initiated by abstraction of hydrogen at carbon 13 (with S-stereochemistry), followed by insertion of molecular O2 to form the endoperoxide bridge between carbon 9 and 11 that defines prostaglandins. The insertion of a second molecule of O2 (bis-oxygenase activity) yields a hydroperoxy group in PGG2 that is then reduced to PGH2 by two electrons. Similarly catalyzes successive cyclooxygenation and peroxidation of dihomo-gamma-linoleate (DGLA, C20:3(n-6)) and eicosapentaenoate (EPA, C20:5(n-3)) to corresponding PGH1 and PGH3, the precursors of 1- and 3-series prostaglandins. In an alternative pathway of prostanoid biosynthesis, converts 2-arachidonoyl lysophopholipids to prostanoid lysophopholipids, which are then hydrolyzed by intracellular phospholipases to release free prostanoids. Metabolizes 2-arachidonoyl glycerol yielding the glyceryl ester of PGH2, a process that can contribute to pain response. Generates lipid mediators from n-3 and n-6 polyunsaturated fatty acids (PUFAs) via a lipoxygenase-type mechanism. Oxygenates PUFAs to hydroperoxy compounds and then reduces them to corresponding alcohols. Plays a role in the generation of resolution phase interaction products (resolvins) during both sterile and infectious inflammation. Metabolizes docosahexaenoate (DHA, C22:6(n-3)) to 17R-HDHA, a precursor of the D-series resolvins (RvDs). As a component of the biosynthetic pathway of E-series resolvins (RvEs), converts eicosapentaenoate (EPA, C20:5(n-3)) primarily to 18S-HEPE that is further metabolized by ALOX5 and LTA4H to generate 18S-RvE1 and 18S-RvE2. In vascular endothelial cells, converts docosapentaenoate (DPA, C22:5(n-3)) to 13R-HDPA, a precursor for 13-series resolvins (RvTs) shown to activate macrophage phagocytosis during bacterial infection. In activated leukocytes, contributes to oxygenation of hydroxyeicosatetraenoates (HETE) to diHETES (5,15-diHETE and 5,11-diHETE). During neuroinflammation, plays a role in neuronal secretion of specialized preresolving mediators (SPMs) 15R-lipoxin A4 that regulates phagocytic microglia.
Click to Show/Hide
|
||||
| Uniprot ID | |||||
| Ensembl ID | |||||
| HGNC ID | |||||
| Click to Show/Hide the Complete Species Lineage | |||||
Type(s) of Resistant Mechanism of This Molecule
Drug Resistance Data Categorized by Drug
Approved Drug(s)
5 drug(s) in total
| Drug Sensitivity Data Categorized by Their Corresponding Mechanisms | ||||
|
|
||||
| Disease Class: Glioblastoma [ICD-11: 2A00.02] | [1] | |||
| Sensitive Disease | Glioblastoma [ICD-11: 2A00.02] | |||
| Sensitive Drug | Celecoxib | |||
| Molecule Alteration | Expression | Down-regulation |
||
| Differential expression of the molecule in resistant disease | ||||
| Classification of Disease | Brain cancer [ICD-11: 2A00] | |||
| The Specified Disease | Neuroectodermal tumor | |||
| The Studied Tissue | Brainstem tissue | |||
| The Expression Level of Disease Section Compare with the Healthy Individual Tissue | p-value: 2.91E-03 Fold-change: -4.00E-01 Z-score: -3.90E+00 |
|||
| Experimental Note | Revealed Based on the Cell Line Data | |||
| Cell Pathway Regulation | Cell proliferation | Inhibition | hsa05200 | |
| Cell apoptosis | Activation | hsa04210 | ||
| Cell autophagy | Activation | hsa04140 | ||
| In Vitro Model | MDA-175 cells | Pleural effusion | Homo sapiens (Human) | CVCL_1400 |
| MMQ cells | Pituitary gland | Rattus norvegicus (Rat) | CVCL_2117 | |
| Experiment for Molecule Alteration |
Western blot analysis; Fluorescence microscopy assay | |||
| Experiment for Drug Resistance |
MTS assay; Crystal violet staining assay; Fluorescence-activated cell sorting (FACS) assay; Flow cytometry | |||
| Mechanism Description | Celecoxib reverses the glioblastoma chemo-resistance to temozolomide through mitochondrial metabolism. | |||
| Drug Resistance Data Categorized by Their Corresponding Mechanisms | ||||
|
|
||||
| Disease Class: Hypo-attenuated leaflet thickening [ICD-11: BD10.2] | [2] | |||
| Resistant Disease | Hypo-attenuated leaflet thickening [ICD-11: BD10.2] | |||
| Resistant Drug | Aspirin | |||
| Molecule Alteration | SNP | rs20417 |
||
| Experimental Note | Identified from the Human Clinical Data | |||
| Mechanism Description | We thoroughly genotyped 34 SNPs and 8 SNPs that have been reported for clopidogrel and aspirin resistance. A total of 148 patients were enrolled. There were 15 patients demonstrating signs of HALT. Patients with HALT had a higher rate of atrial fibrillation (AF) pre-TAVR (33.3 vs. 7.5%, P = 0.01). | |||
| Disease Class: Dysmenorrhea [ICD-11: GA34.3] | [3] | |||
| Resistant Disease | Dysmenorrhea [ICD-11: GA34.3] | |||
| Resistant Drug | Aspirin | |||
| Molecule Alteration | SNP | rs20417 |
||
| Experimental Note | Identified from the Human Clinical Data | |||
| Mechanism Description | Notably, rs20417 is a SNP in the promoter region of COX-2 associated with aspirin resistance. Further research is needed to determine if the identified SNP have a transcriptional effect contributing to NSAID-resistant dysmenorrhea. | |||
| Drug Sensitivity Data Categorized by Their Corresponding Mechanisms | ||||
|
|
||||
| Disease Class: Bladder cancer [ICD-11: 2C94.0] | [4] | |||
| Sensitive Disease | Bladder cancer [ICD-11: 2C94.0] | |||
| Sensitive Drug | Cisplatin | |||
| Molecule Alteration | Expression | Down-regulation |
||
| Experimental Note | Revealed Based on the Cell Line Data | |||
| Cell Pathway Regulation | Cell apoptosis | Activation | hsa04210 | |
| Cell proliferation | Inhibition | hsa05200 | ||
| In Vitro Model | T24 cells | Bladder | Homo sapiens (Human) | CVCL_0554 |
| Experiment for Molecule Alteration |
Western blot analysis | |||
| Experiment for Drug Resistance |
MTT assay; Flow cytometry assay | |||
| Mechanism Description | Enforced expression of miR-101 enhances cisplatin sensitivity in human bladder cancer cells by downregulating the cyclooxygenase-2 pathway. | |||
| Drug Resistance Data Categorized by Their Corresponding Mechanisms | ||||
|
|
||||
| Disease Class: Endometriosis [ICD-11: GA10.0] | [5] | |||
| Resistant Disease | Endometriosis [ICD-11: GA10.0] | |||
| Resistant Drug | Fotemustine | |||
| Molecule Alteration | Expression | Up-regulation |
||
| Experimental Note | Discovered Using In-vivo Testing Model | |||
| Cell Pathway Regulation | MAPK signaling pathway | Activation | hsa04010 | |
| In Vivo Model | Female Sprague-Dawley rats model | Rattus norvegicus | ||
| Experiment for Molecule Alteration |
Western blot analysis | |||
| Mechanism Description | Fotemustine and dexamethasone administration had anti-apoptotic activity, restoring the impaired mechanism (TUNEL assay and Western blot analysis of Bax and Bcl-2). Moreover, no gastric disfunction was detected (histological analysis of stomachs). Thus, our data showed that the combined therapy of fotemustine and dexamethasone reduced endometriosis-induced inflammation, hyperproliferation and apoptosis resistance. | |||
| Drug Sensitivity Data Categorized by Their Corresponding Mechanisms | ||||
|
|
||||
| Disease Class: Colorectal cancer [ICD-11: 2B91.1] | [6] | |||
| Sensitive Disease | Colorectal cancer [ICD-11: 2B91.1] | |||
| Sensitive Drug | Irinotecan | |||
| Molecule Alteration | Expression | Down-regulation |
||
| Experimental Note | Identified from the Human Clinical Data | |||
| Cell Pathway Regulation | Sphere tumorogenicity | Inhibition | hsa04140 | |
| Wnt signaling pathway | Inhibition | hsa04310 | ||
| In Vitro Model | HT29 Cells | Colon | Homo sapiens (Human) | CVCL_A8EZ |
| DLD1 cells | Colon | Homo sapiens (Human) | CVCL_0248 | |
| SW620 cells | Colon | Homo sapiens (Human) | CVCL_0547 | |
| LOVO cells | Colon | Homo sapiens (Human) | CVCL_0399 | |
| RkO cells | Colon | Homo sapiens (Human) | CVCL_0504 | |
| LS513 cells | Colon | Homo sapiens (Human) | CVCL_1386 | |
| In Vivo Model | BALB/c nude mouse xenograft model | Mus musculus | ||
| Experiment for Molecule Alteration |
Western blot analysis | |||
| Experiment for Drug Resistance |
MTS assay | |||
| Mechanism Description | COX-2 allows Wnt activation, which is essential for CSC growth, the decrease of colorectal CSC formation and growth could result from miR-451-mediated downregulation of cyclooxygenase-2 (COX-2) and Wnt pathway. | |||
Disease- and Tissue-specific Abundances of This Molecule
ICD Disease Classification 02

| Differential expression of molecule in resistant diseases | ||
| The Studied Tissue | Nervous tissue | |
| The Specified Disease | Brain cancer | |
| The Expression Level of Disease Section Compare with the Healthy Individual Tissue | p-value: 5.47E-01; Fold-change: -1.46E-01; Z-score: -1.42E-01 | |
|
Molecule expression in the diseased tissue of patients
Molecule expression in the normal tissue of healthy individuals
|
||
| Disease-specific Molecule Abundances |
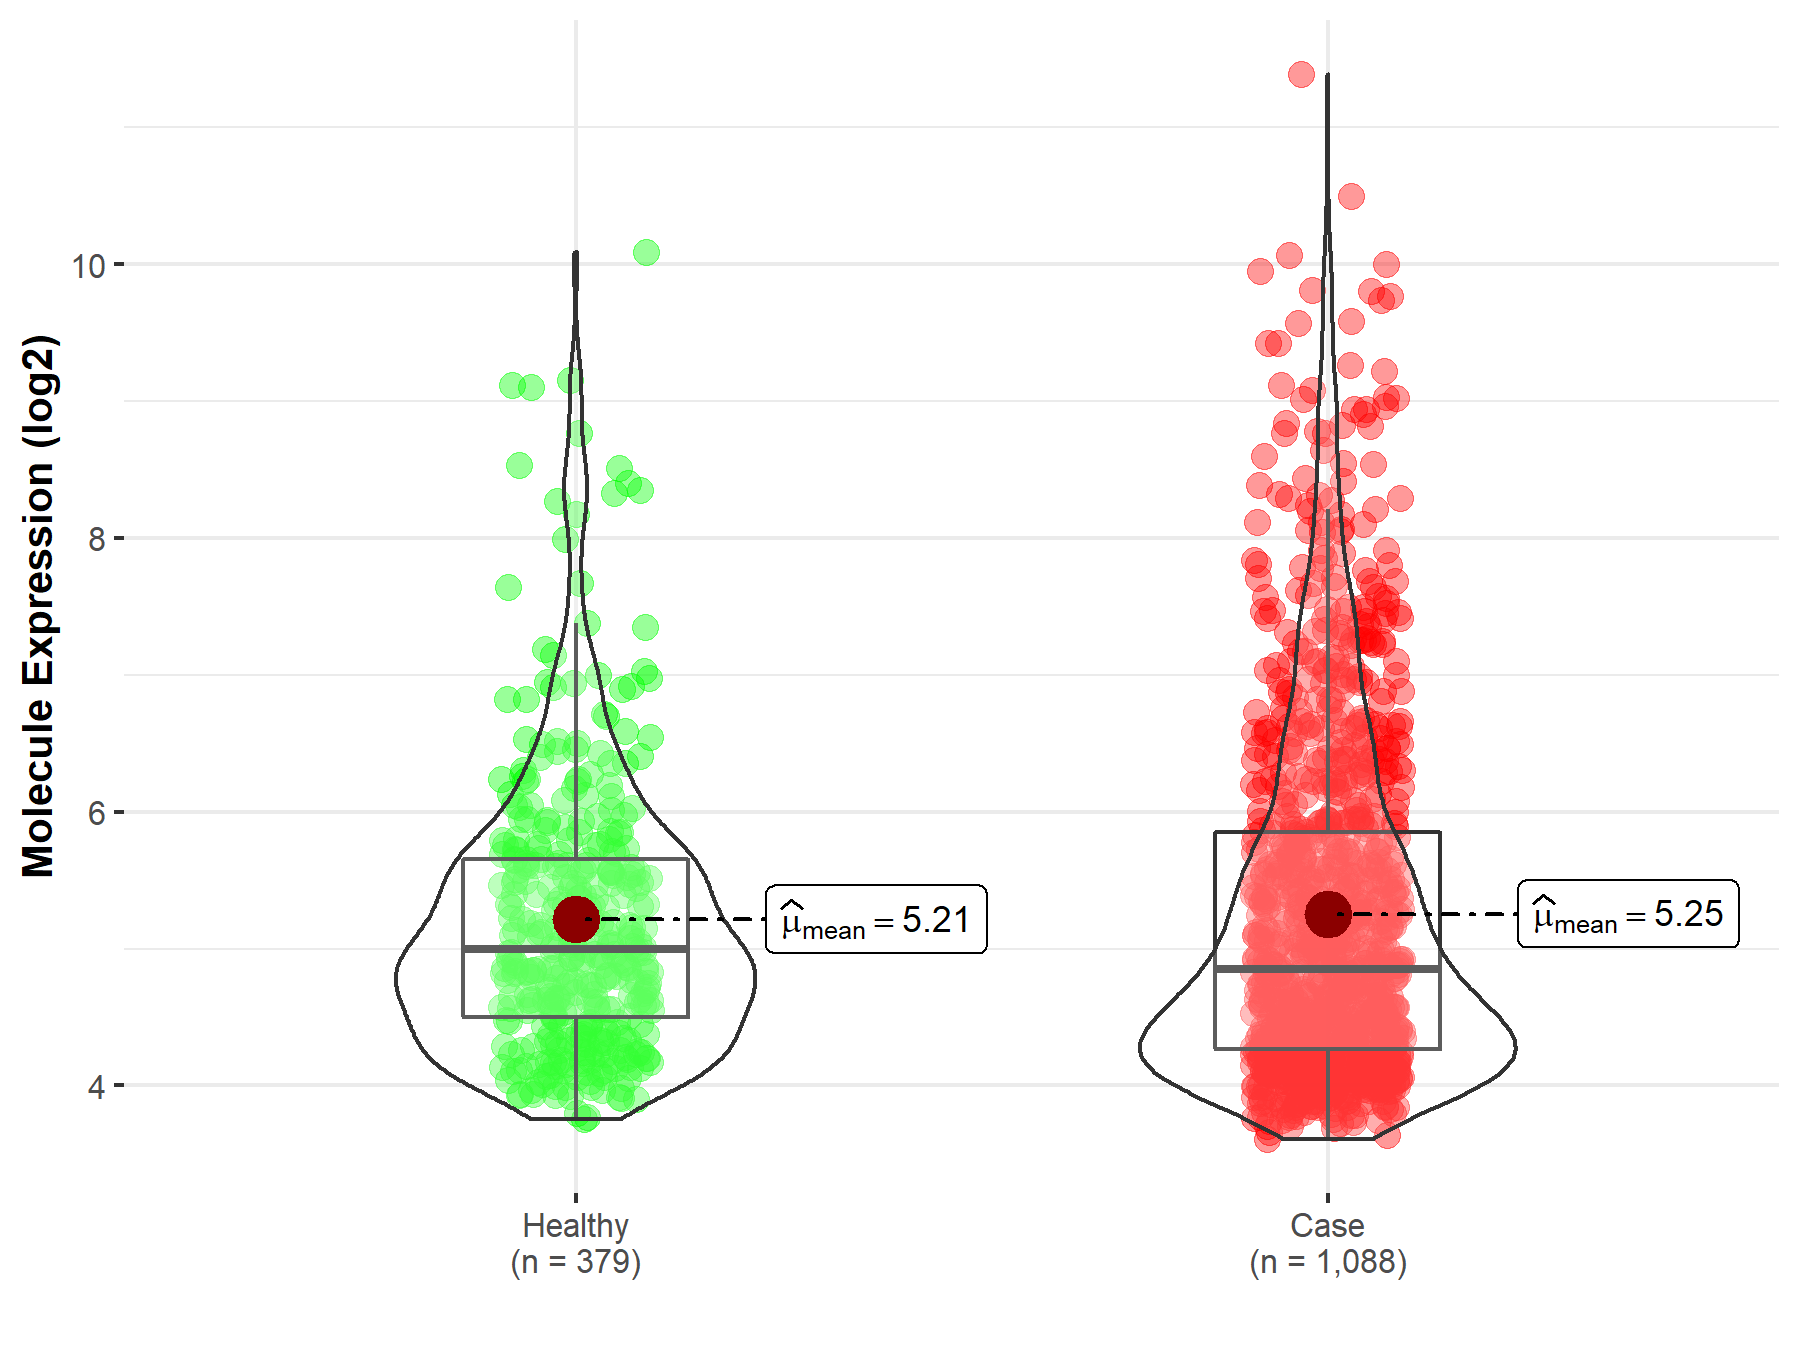
|
Click to View the Clearer Original Diagram |
| The Studied Tissue | Brainstem tissue | |
| The Specified Disease | Glioma | |
| The Expression Level of Disease Section Compare with the Healthy Individual Tissue | p-value: 7.58E-02; Fold-change: 3.46E-01; Z-score: 1.66E+00 | |
|
Molecule expression in the diseased tissue of patients
Molecule expression in the normal tissue of healthy individuals
|
||
| Disease-specific Molecule Abundances |
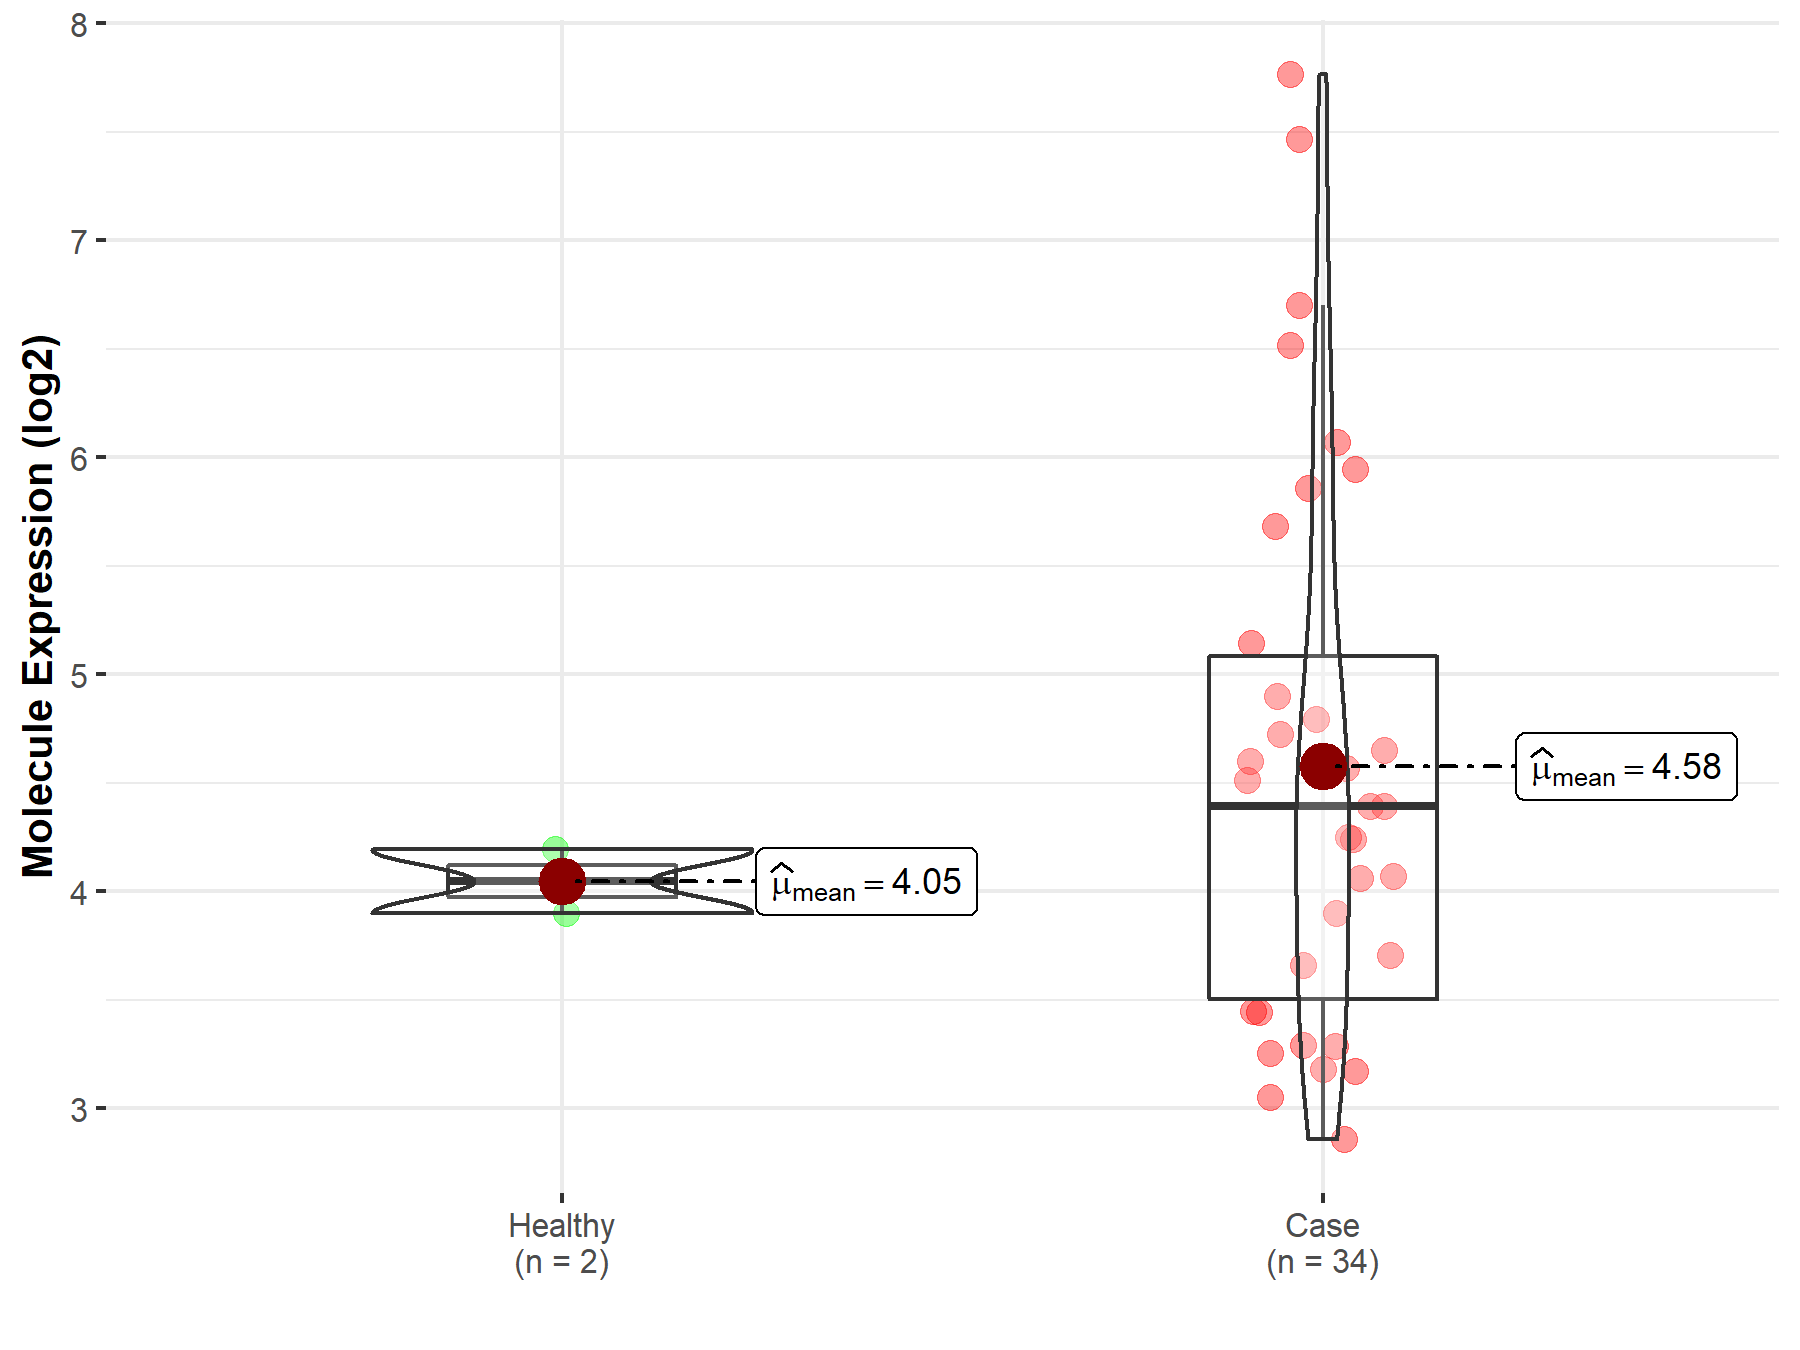
|
Click to View the Clearer Original Diagram |
| The Studied Tissue | White matter | |
| The Specified Disease | Glioma | |
| The Expression Level of Disease Section Compare with the Healthy Individual Tissue | p-value: 9.74E-01; Fold-change: 2.26E-01; Z-score: 1.78E-01 | |
|
Molecule expression in the diseased tissue of patients
Molecule expression in the normal tissue of healthy individuals
|
||
| Disease-specific Molecule Abundances |
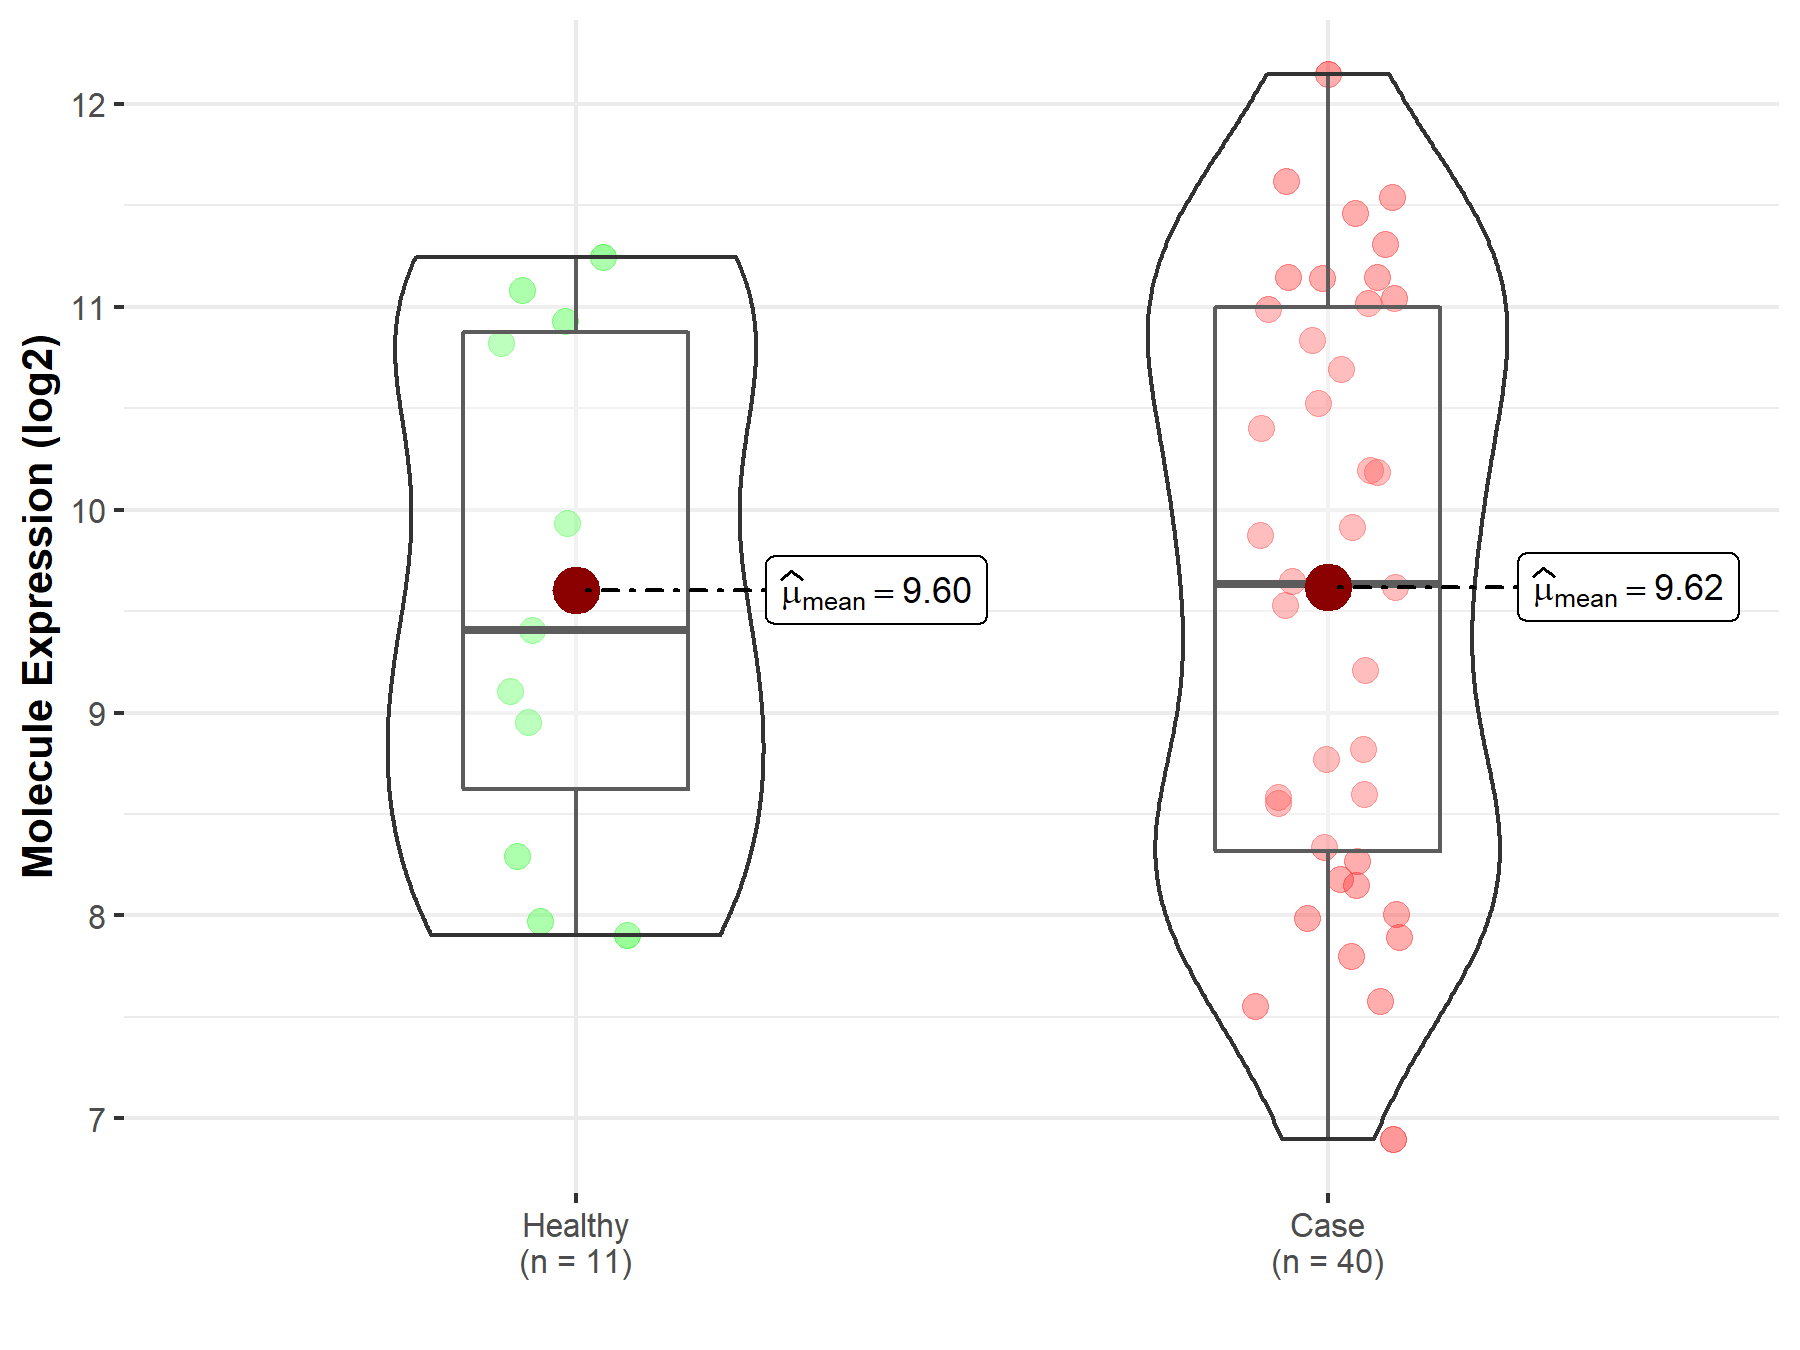
|
Click to View the Clearer Original Diagram |
| The Studied Tissue | Brainstem tissue | |
| The Specified Disease | Neuroectodermal tumor | |
| The Expression Level of Disease Section Compare with the Healthy Individual Tissue | p-value: 2.91E-03; Fold-change: -1.71E+00; Z-score: -1.72E+00 | |
|
Molecule expression in the diseased tissue of patients
Molecule expression in the normal tissue of healthy individuals
|
||
| Disease-specific Molecule Abundances |
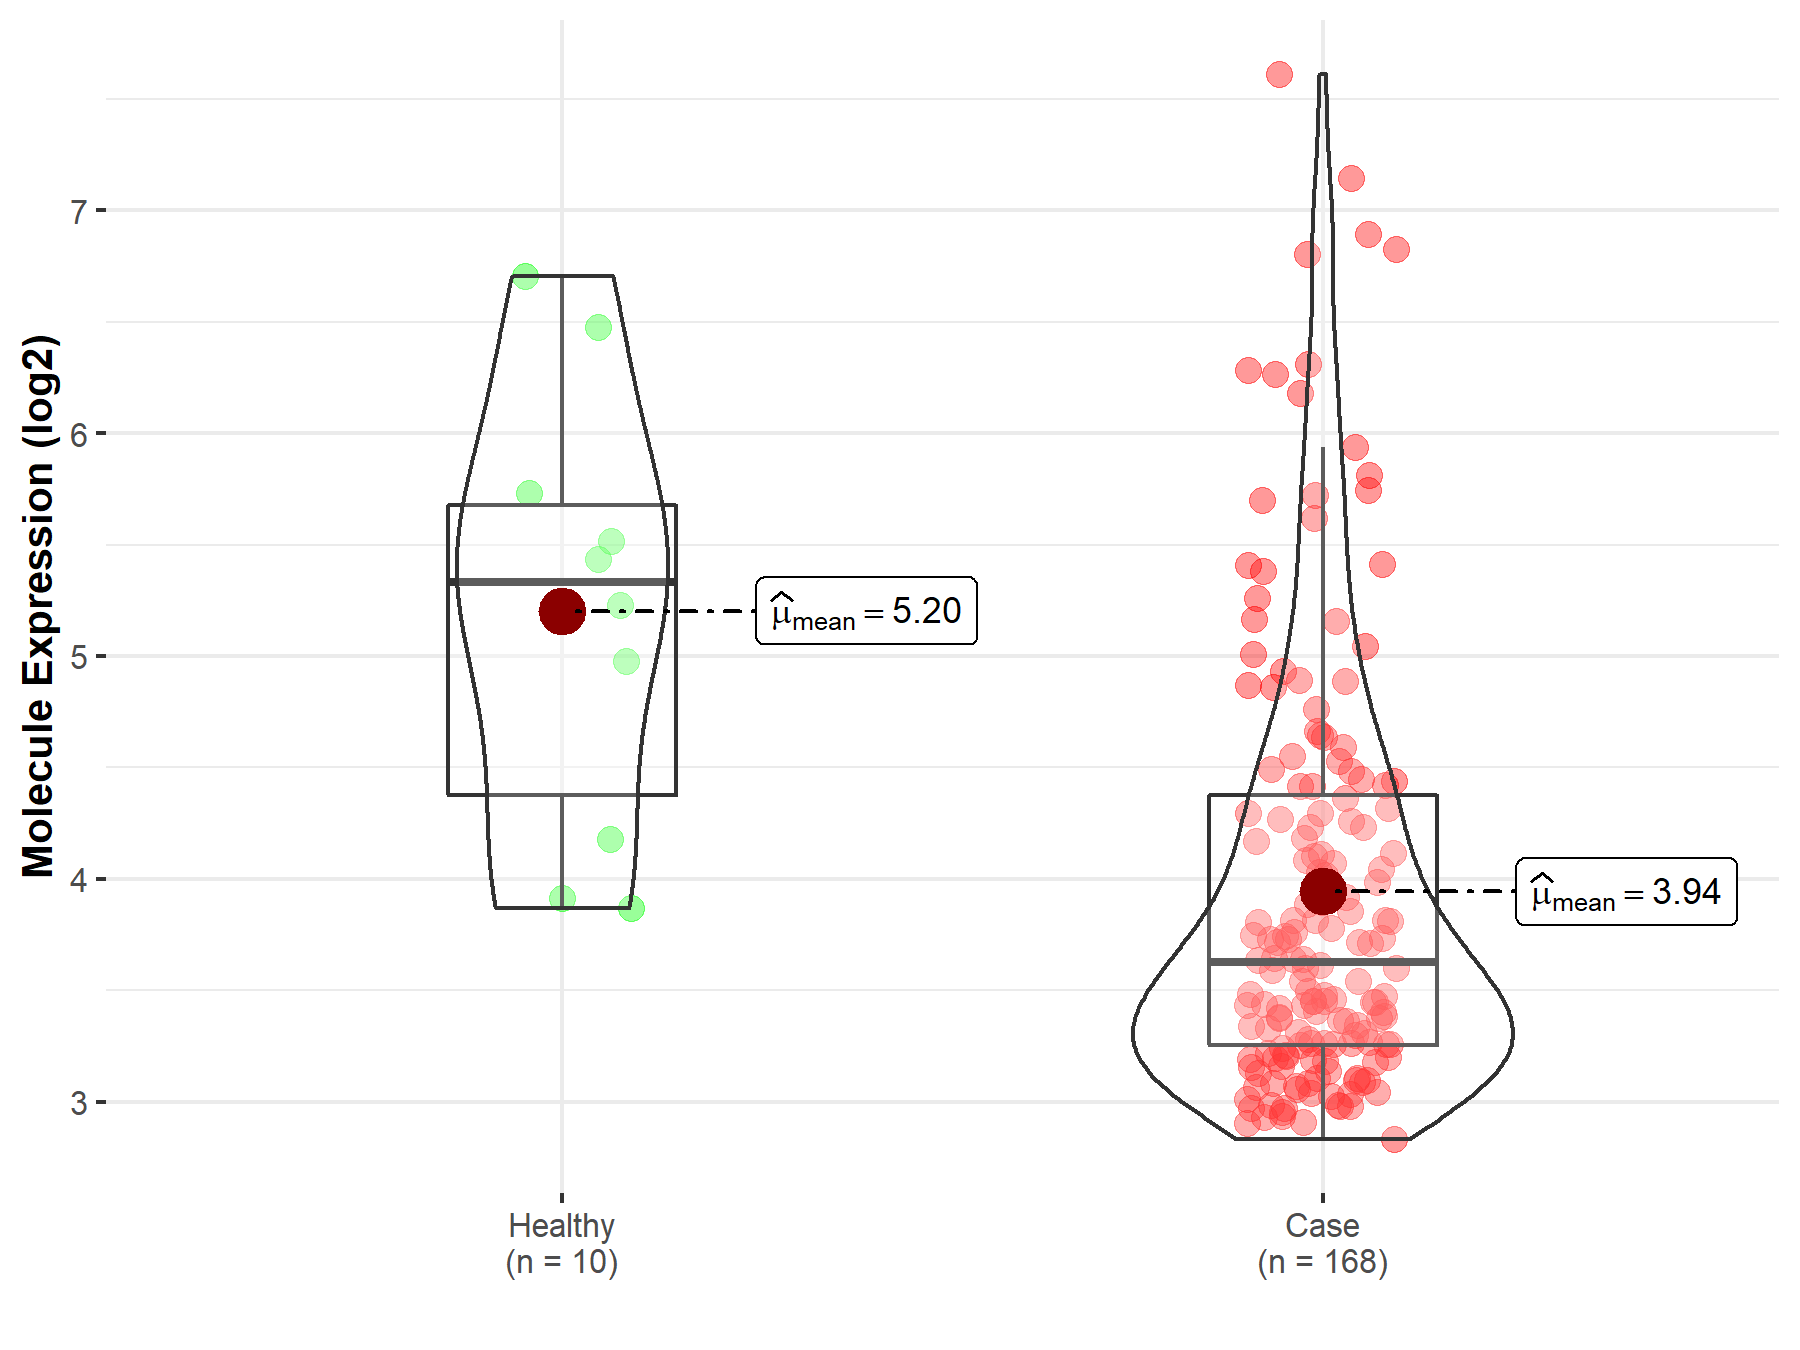
|
Click to View the Clearer Original Diagram |
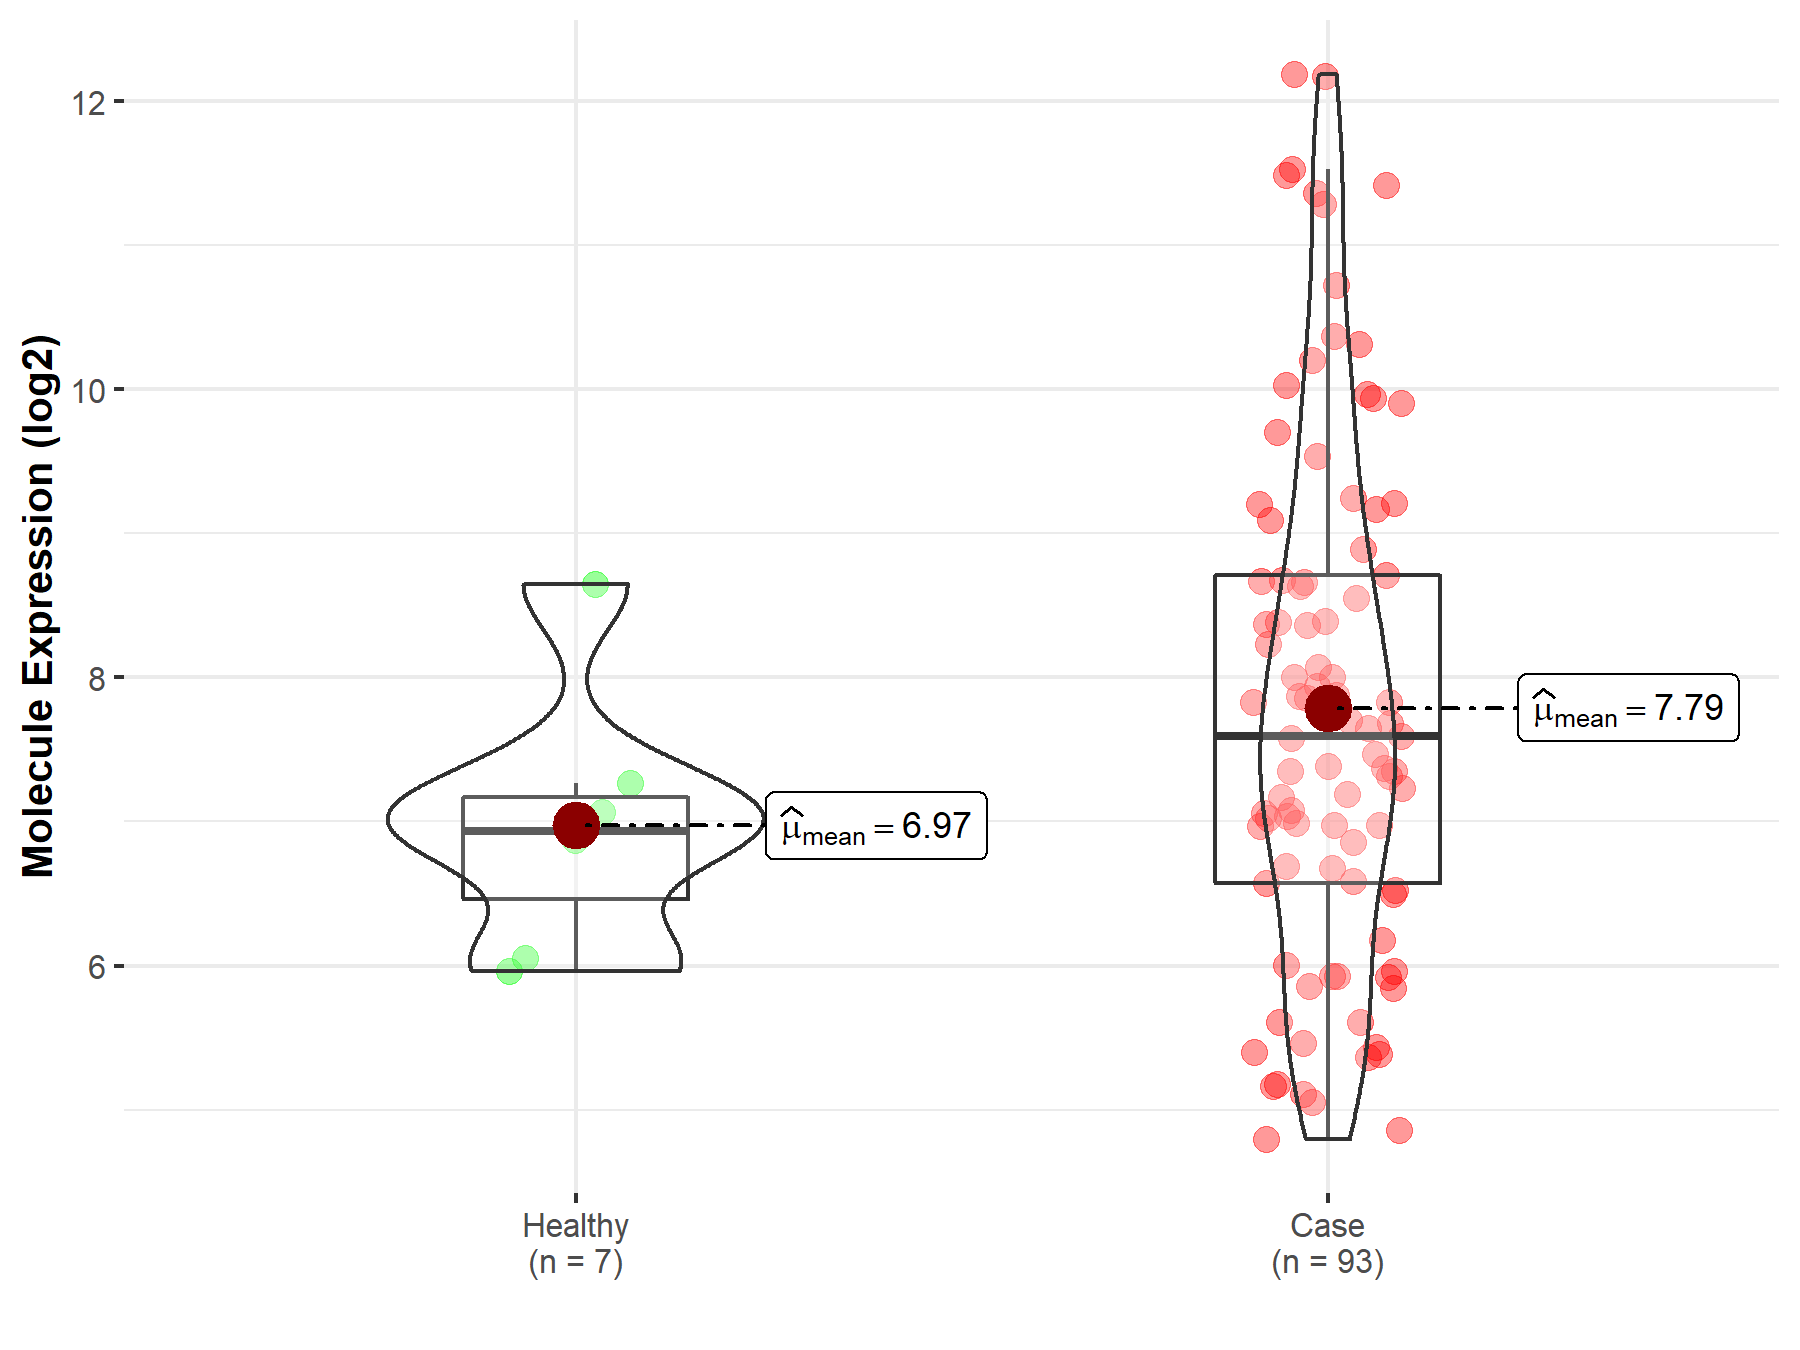
| Differential expression of molecule in resistant diseases | ||
| The Studied Tissue | Bladder tissue | |
| The Specified Disease | Bladder cancer | |
| The Expression Level of Disease Section Compare with the Healthy Individual Tissue | p-value: 5.95E-02; Fold-change: 6.63E-01; Z-score: 7.42E-01 | |
|
Molecule expression in the diseased tissue of patients
Molecule expression in the normal tissue of healthy individuals
|
||
| Disease-specific Molecule Abundances |
|
Click to View the Clearer Original Diagram |
ICD Disease Classification 16

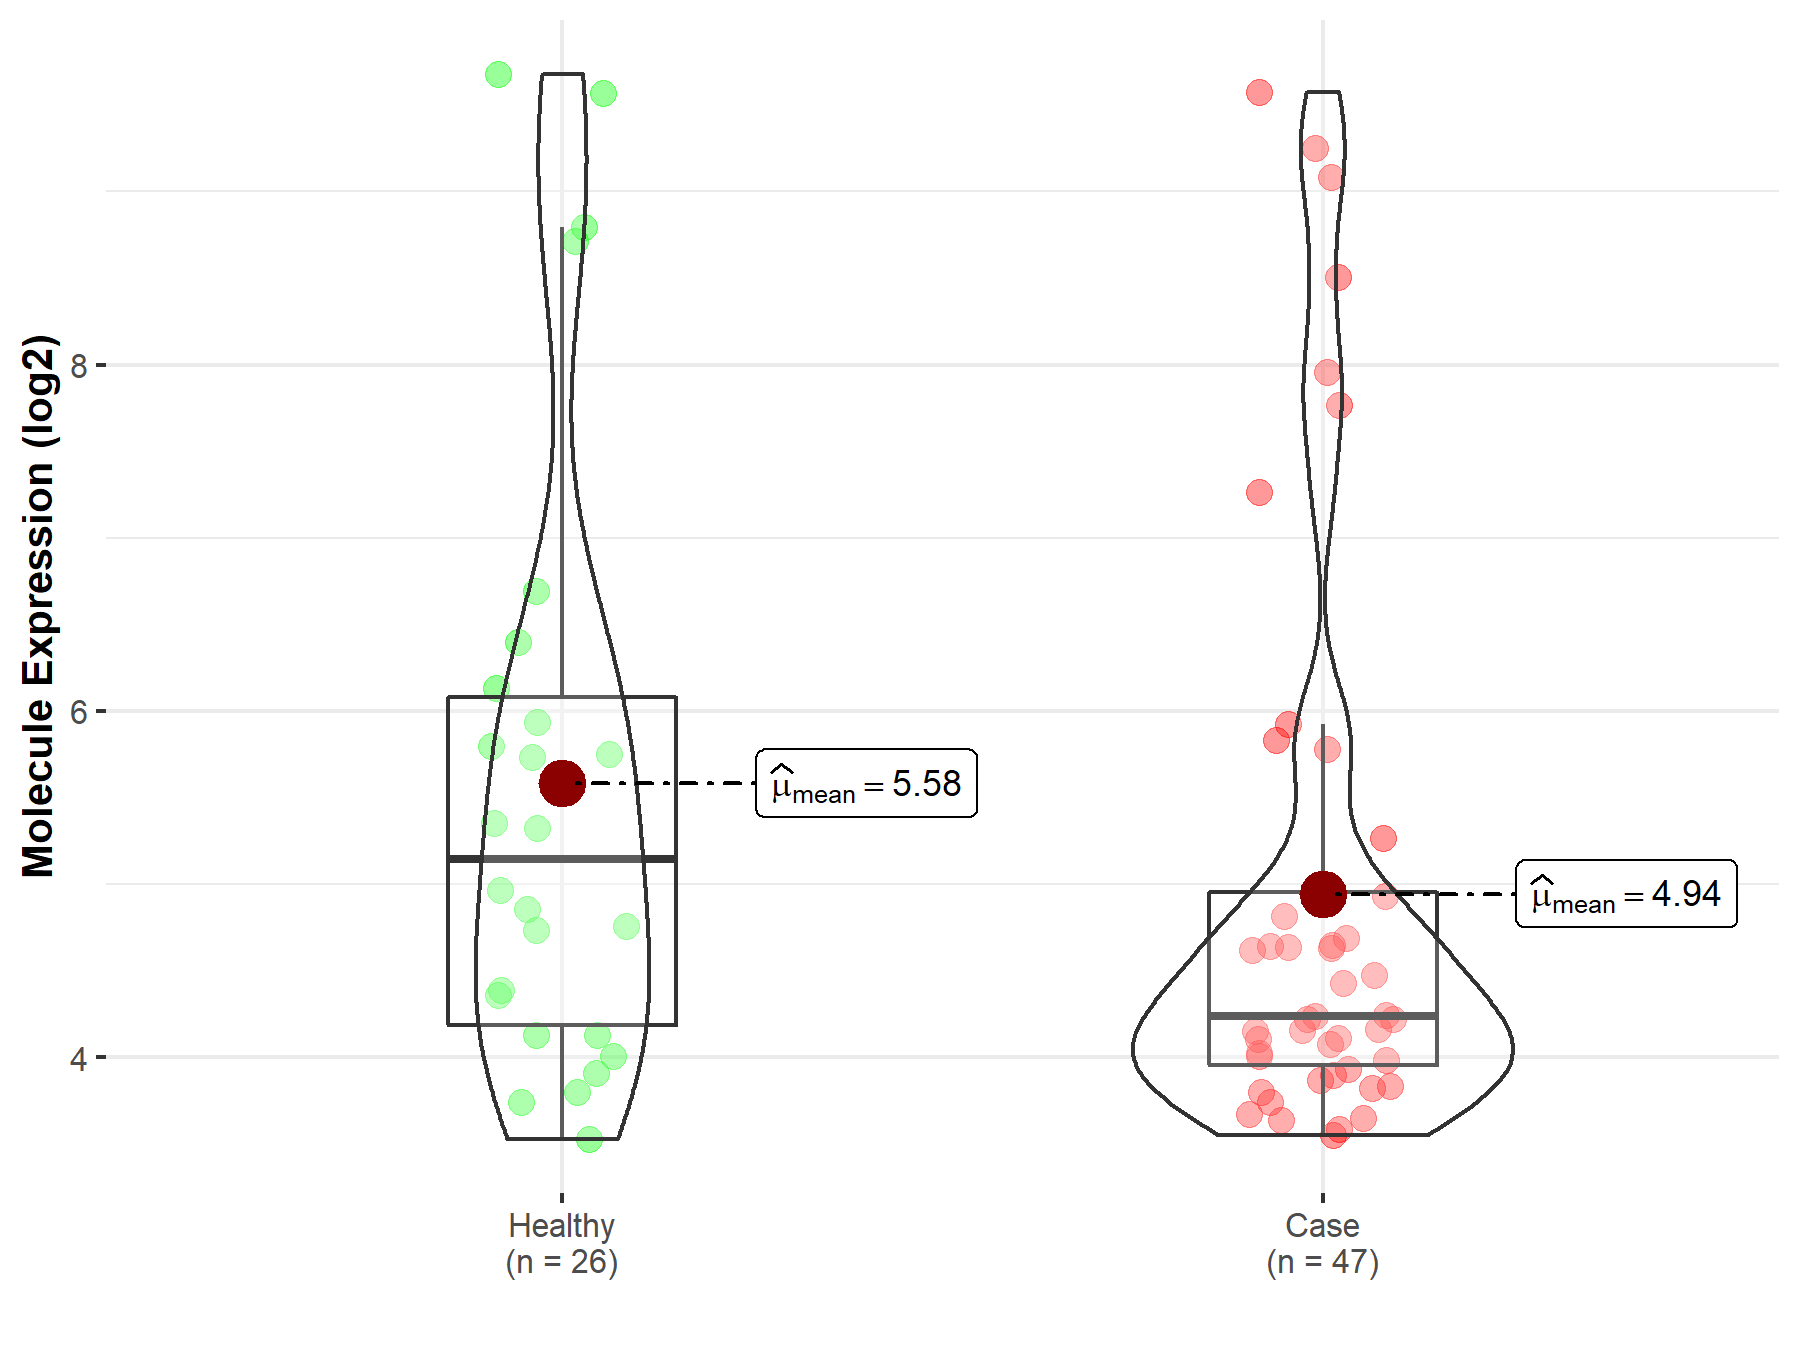
| Differential expression of molecule in resistant diseases | ||
| The Studied Tissue | Endometrium | |
| The Specified Disease | Endometriosis | |
| The Expression Level of Disease Section Compare with the Healthy Individual Tissue | p-value: 1.40E-01; Fold-change: -9.05E-01; Z-score: -5.03E-01 | |
|
Molecule expression in the diseased tissue of patients
Molecule expression in the normal tissue of healthy individuals
|
||
| Disease-specific Molecule Abundances |
|
Click to View the Clearer Original Diagram |
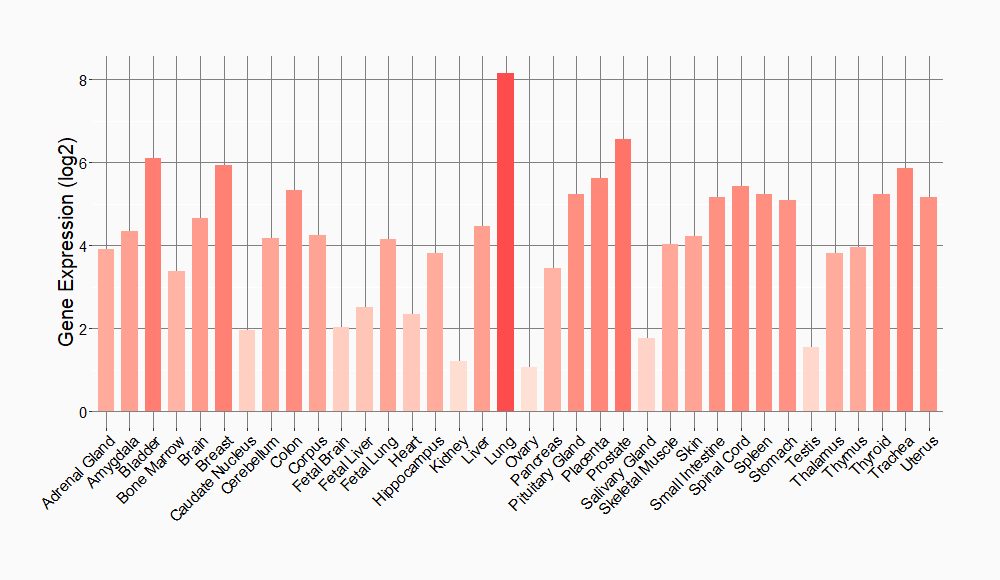
Tissue-specific Molecule Abundances in Healthy Individuals

|
||
References
If you find any error in data or bug in web service, please kindly report it to Dr. Sun and Dr. Yu.
