Molecule Information
General Information of the Molecule (ID: Mol00472)
| Name |
Lymphoid enhancer-binding factor 1 (LEF1)
,Homo sapiens
|
||||
|---|---|---|---|---|---|
| Synonyms |
LEF-1; T cell-specific transcription factor 1-alpha; TCF1-alpha
Click to Show/Hide
|
||||
| Molecule Type |
Protein
|
||||
| Gene Name |
LEF1
|
||||
| Gene ID | |||||
| Location |
chr4:108047545-108168956[-]
|
||||
| Sequence |
MPQLSGGGGGGGGDPELCATDEMIPFKDEGDPQKEKIFAEISHPEEEGDLADIKSSLVNE
SEIIPASNGHEVARQAQTSQEPYHDKAREHPDDGKHPDGGLYNKGPSYSSYSGYIMMPNM NNDPYMSNGSLSPPIPRTSNKVPVVQPSHAVHPLTPLITYSDEHFSPGSHPSHIPSDVNS KQGMSRHPPAPDIPTFYPLSPGGVGQITPPLGWQGQPVYPITGGFRQPYPSSLSVDTSMS RFSHHMIPGPPGPHTTGIPHPAIVTPQVKQEHPHTDSDLMHVKPQHEQRKEQEPKRPHIK KPLNAFMLYMKEMRANVVAECTLKESAAINQILGRRWHALSREEQAKYYELARKERQLHM QLYPGWSARDNYGKKKKRKREKLQESASGTGPRMTAAYI Click to Show/Hide
|
||||
| Function |
Transcription factor that binds DNA in a sequence-specific manner. Participates in the Wnt signaling pathway. Activates transcription of target genes in the presence of CTNNB1 and EP300. PIAG antagonizes both Wnt-dependent and Wnt-independent activation by LEF1. TLE1, TLE2, TLE3 and TLE4 repress transactivation mediated by LEF1 and CTNNB1. Regulates T-cell receptor alpha enhancer function. Required for IL17A expressing gamma-delta T-cell maturation and development, via binding to regulator loci of BLK to modulate expression. May play a role in hair cell differentiation and follicle morphogenesis.
Click to Show/Hide
|
||||
| Uniprot ID | |||||
| Ensembl ID | |||||
| HGNC ID | |||||
| Click to Show/Hide the Complete Species Lineage | |||||
Type(s) of Resistant Mechanism of This Molecule
Drug Resistance Data Categorized by Drug
Approved Drug(s)
2 drug(s) in total
| Drug Sensitivity Data Categorized by Their Corresponding Mechanisms | ||||
|
|
||||
| Disease Class: Bladder cancer [ICD-11: 2C94.0] | [1] | |||
| Sensitive Disease | Bladder cancer [ICD-11: 2C94.0] | |||
| Sensitive Drug | Epirubicin | |||
| Molecule Alteration | Expression | Down-regulation |
||
| Differential expression of the molecule in resistant disease | ||||
| Classification of Disease | Bladder cancer [ICD-11: 2C94] | |||
| The Specified Disease | Bladder cancer | |||
| The Studied Tissue | Bladder tissue | |||
| The Expression Level of Disease Section Compare with the Healthy Individual Tissue | p-value: 1.80E-01 Fold-change: -1.76E-02 Z-score: -1.40E+00 |
|||
| Experimental Note | Revealed Based on the Cell Line Data | |||
| Cell Pathway Regulation | Cell apoptosis | Activation | hsa04210 | |
| Cell colony | Inhibition | hsa05200 | ||
| Cell invasion | Inhibition | hsa05200 | ||
| Cell migration | Inhibition | hsa04670 | ||
| Cell viability | Inhibition | hsa05200 | ||
| Wnt/Beta-catenin signaling pathway | Regulation | N.A. | ||
| In Vitro Model | BIU87 cells | Bladder | Homo sapiens (Human) | CVCL_6881 |
| In Vivo Model | BALB/c nude mouse xenograft model | Mus musculus | ||
| Experiment for Molecule Alteration |
Western blot analysis | |||
| Experiment for Drug Resistance |
CCK8 assay; Flow cytometry assay | |||
| Mechanism Description | miR-34a increased chemosensitivity in BIU87/ADR cells by inhibiting the TCF1/LEF1 axis. | |||
| Drug Resistance Data Categorized by Their Corresponding Mechanisms | ||||
|
|
||||
| Disease Class: Endometrial cancer [ICD-11: 2C76.1] | [2] | |||
| Resistant Disease | Endometrial cancer [ICD-11: 2C76.1] | |||
| Resistant Drug | Progesterone | |||
| Molecule Alteration | Expression | Down-regulation |
||
| Experimental Note | Revealed Based on the Cell Line Data | |||
| Cell Pathway Regulation | Cell apoptosis | Inhibition | hsa04210 | |
| Cell colony | Activation | hsa05200 | ||
| Cell cycle | Activation | hsa04110 | ||
| In Vitro Model | 293T cells | Breast | Homo sapiens (Human) | CVCL_0063 |
| Ishikawa cells | Endometrium | Homo sapiens (Human) | CVCL_2529 | |
| Experiment for Molecule Alteration |
Western blot analysis | |||
| Experiment for Drug Resistance |
Flow cytometry assay | |||
| Mechanism Description | Progesterone Repressed LncRNA NEAT1,LEF1, c-myc, and MMP9 in Wnt/beta-catenin Signaling Pathway via Inhibition of NEAT1/miRNA-146b-5p Axis in Endometrial Cancer. | |||
Disease- and Tissue-specific Abundances of This Molecule
ICD Disease Classification 02

| Differential expression of molecule in resistant diseases | ||
| The Studied Tissue | Bladder tissue | |
| The Specified Disease | Bladder cancer | |
| The Expression Level of Disease Section Compare with the Healthy Individual Tissue | p-value: 1.80E-01; Fold-change: 1.78E-02; Z-score: 1.55E-01 | |
|
Molecule expression in the diseased tissue of patients
Molecule expression in the normal tissue of healthy individuals
|
||
| Disease-specific Molecule Abundances |

|
Click to View the Clearer Original Diagram |
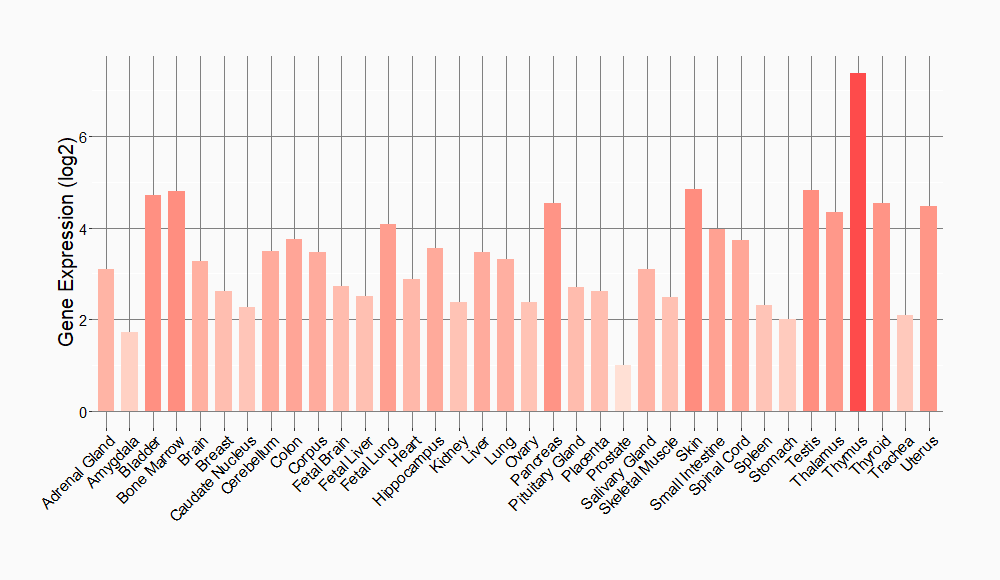
Tissue-specific Molecule Abundances in Healthy Individuals


|
||
References
If you find any error in data or bug in web service, please kindly report it to Dr. Sun and Dr. Yu.
