Molecule Information
General Information of the Molecule (ID: Mol00454)
| Name |
Potassium voltage-gated channel subfamily H member 1 (KCNH1)
,Homo sapiens
|
||||
|---|---|---|---|---|---|
| Synonyms |
Ether-a-go-go potassium channel 1; EAG channel 1; h-eag; hEAG1; Voltage-gated potassium channel subunit Kv10.1; EAG; EAG1
Click to Show/Hide
|
||||
| Molecule Type |
Protein
|
||||
| Gene Name |
KCNH1
|
||||
| Gene ID | |||||
| Location |
chr1:210676823-211134165[-]
|
||||
| Sequence |
MTMAGGRRGLVAPQNTFLENIVRRSNDTNFVLGNAQIVDWPIVYSNDGFCKLSGYHRAEV
MQKSSTCSFMYGELTDKDTIEKVRQTFENYEMNSFEILMYKKNRTPVWFFVKIAPIRNEQ DKVVLFLCTFSDITAFKQPIEDDSCKGWGKFARLTRALTSSRGVLQQLAPSVQKGENVHK HSRLAEVLQLGSDILPQYKQEAPKTPPHIILHYCVFKTTWDWIILILTFYTAILVPYNVS FKTRQNNVAWLVVDSIVDVIFLVDIVLNFHTTFVGPAGEVISDPKLIRMNYLKTWFVIDL LSCLPYDVINAFENVDEVSAFMGDPGKIGFADQIPPPLEGRESQGISSLFSSLKVVRLLR LGRVARKLDHYIEYGAAVLVLLVCVFGLAAHWMACIWYSIGDYEIFDEDTKTIRNNSWLY QLAMDIGTPYQFNGSGSGKWEGGPSKNSVYISSLYFTMTSLTSVGFGNIAPSTDIEKIFA VAIMMIGSLLYATIFGNVTTIFQQMYANTNRYHEMLNSVRDFLKLYQVPKGLSERVMDYI VSTWSMSRGIDTEKVLQICPKDMRADICVHLNRKVFKEHPAFRLASDGCLRALAMEFQTV HCAPGDLIYHAGESVDSLCFVVSGSLEVIQDDEVVAILGKGDVFGDVFWKEATLAQSCAN VRALTYCDLHVIKRDALQKVLEFYTAFSHSFSRNLILTYNLRKRIVFRKISDVKREEEER MKRKNEAPLILPPDHPVRRLFQRFRQQKEARLAAERGGRDLDDLDVEKGNVLTEHASANH SLVKASVVTVRESPATPVSFQAASTSGVPDHAKLQAPGSECLGPKGGGGDCAKRKSWARF KDACGKSEDWNKVSKAESMETLPERTKASGEATLKKTDSCDSGITKSDLRLDNVGEARSP QDRSPILAEVKHSFYPIPEQTLQATVLEVRHELKEDIKALNAKMTNIEKQLSEILRILTS RRSSQSPQELFEISRPQSPESERDIFGAS Click to Show/Hide
|
||||
| 3D-structure |
|
||||
| Function |
Pore-forming (alpha) subunit of a voltage-gated delayed rectifier potassium channel. Channel properties are modulated by subunit assembly. Mediates IK(NI) current in myoblasts. Involved in the regulation of cell proliferation and differentiation, in particular adipogenic and osteogenic differentiation in bone marrow-derived mesenchymal stem cells (MSCs).
Click to Show/Hide
|
||||
| Uniprot ID | |||||
| Ensembl ID | |||||
| HGNC ID | |||||
| Click to Show/Hide the Complete Species Lineage | |||||
Type(s) of Resistant Mechanism of This Molecule
Drug Resistance Data Categorized by Drug
Approved Drug(s)
3 drug(s) in total
| Drug Sensitivity Data Categorized by Their Corresponding Mechanisms | ||||
|
|
||||
| Disease Class: Glioblastoma [ICD-11: 2A00.02] | [1] | |||
| Sensitive Disease | Glioblastoma [ICD-11: 2A00.02] | |||
| Sensitive Drug | Imatinib | |||
| Molecule Alteration | Expression | Down-regulation |
||
| Differential expression of the molecule in resistant disease | ||||
| Classification of Disease | Brain cancer [ICD-11: 2A00] | |||
| The Specified Disease | Glioblastoma | |||
| The Studied Tissue | Nervous tissue | |||
| The Expression Level of Disease Section Compare with the Healthy Individual Tissue | p-value: 1.05E-07 Fold-change: -1.72E+00 Z-score: -1.27E+01 |
|||
| Experimental Note | Identified from the Human Clinical Data | |||
| Cell Pathway Regulation | Cell invasion | Inhibition | hsa05200 | |
| Cell proliferation | Inhibition | hsa05200 | ||
| In Vitro Model | U251 cells | Brain | Homo sapiens (Human) | CVCL_0021 |
| U251AR cells | Brain | Homo sapiens (Human) | CVCL_1G29 | |
| Experiment for Molecule Alteration |
Western blot analysis | |||
| Experiment for Drug Resistance |
CCK8 assay | |||
| Mechanism Description | EAG1 channel might be involved in cell-cycle progression of tumour cells because a significant reduction in the proliferation of tumour cell lines could be achieved by inhibiting EAG1 expression using antisense oligonucleotides. Ectopic expression of miR-296-3p reduced EAG1 expression and suppressed cell proliferation drug resistance. | |||
| Drug Sensitivity Data Categorized by Their Corresponding Mechanisms | ||||
|
|
||||
| Disease Class: Glioblastoma [ICD-11: 2A00.02] | [1] | |||
| Sensitive Disease | Glioblastoma [ICD-11: 2A00.02] | |||
| Sensitive Drug | Temozolomide | |||
| Molecule Alteration | Expression | Down-regulation |
||
| Differential expression of the molecule in resistant disease | ||||
| Classification of Disease | Brain cancer [ICD-11: 2A00] | |||
| The Specified Disease | Glioblastoma | |||
| The Studied Tissue | Nervous tissue | |||
| The Expression Level of Disease Section Compare with the Healthy Individual Tissue | p-value: 1.05E-07 Fold-change: -1.72E+00 Z-score: -1.27E+01 |
|||
| Experimental Note | Identified from the Human Clinical Data | |||
| Cell Pathway Regulation | Cell invasion | Inhibition | hsa05200 | |
| Cell proliferation | Inhibition | hsa05200 | ||
| In Vitro Model | U251 cells | Brain | Homo sapiens (Human) | CVCL_0021 |
| U251AR cells | Brain | Homo sapiens (Human) | CVCL_1G29 | |
| Experiment for Molecule Alteration |
Western blot analysis | |||
| Experiment for Drug Resistance |
CCK8 assay | |||
| Mechanism Description | EAG1 channel might be involved in cell-cycle progression of tumour cells because a significant reduction in the proliferation of tumour cell lines could be achieved by inhibiting EAG1 expression using antisense oligonucleotides. Ectopic expression of miR-296-3p reduced EAG1 expression and suppressed cell proliferation drug resistance. | |||
| Drug Sensitivity Data Categorized by Their Corresponding Mechanisms | ||||
|
|
||||
| Disease Class: Glioblastoma [ICD-11: 2A00.02] | [1] | |||
| Sensitive Disease | Glioblastoma [ICD-11: 2A00.02] | |||
| Sensitive Drug | Etoposide | |||
| Molecule Alteration | Expression | Down-regulation |
||
| Differential expression of the molecule in resistant disease | ||||
| Classification of Disease | Brain cancer [ICD-11: 2A00] | |||
| The Specified Disease | Brain cancer | |||
| The Studied Tissue | Nervous tissue | |||
| The Expression Level of Disease Section Compare with the Healthy Individual Tissue | p-value: 8.48E-65 Fold-change: -1.66E-01 Z-score: -2.01E+01 |
|||
| Experimental Note | Identified from the Human Clinical Data | |||
| Cell Pathway Regulation | Cell invasion | Inhibition | hsa05200 | |
| Cell proliferation | Inhibition | hsa05200 | ||
| In Vitro Model | U251 cells | Brain | Homo sapiens (Human) | CVCL_0021 |
| U251AR cells | Brain | Homo sapiens (Human) | CVCL_1G29 | |
| Experiment for Molecule Alteration |
Western blot analysis | |||
| Experiment for Drug Resistance |
CCK8 assay | |||
| Mechanism Description | EAG1 channel might be involved in cell-cycle progression of tumour cells because a significant reduction in the proliferation of tumour cell lines could be achieved by inhibiting EAG1 expression using antisense oligonucleotides. Ectopic expression of miR-296-3p reduced EAG1 expression and suppressed cell proliferation drug resistance. | |||
Disease- and Tissue-specific Abundances of This Molecule
ICD Disease Classification 02

| Differential expression of molecule in resistant diseases | ||
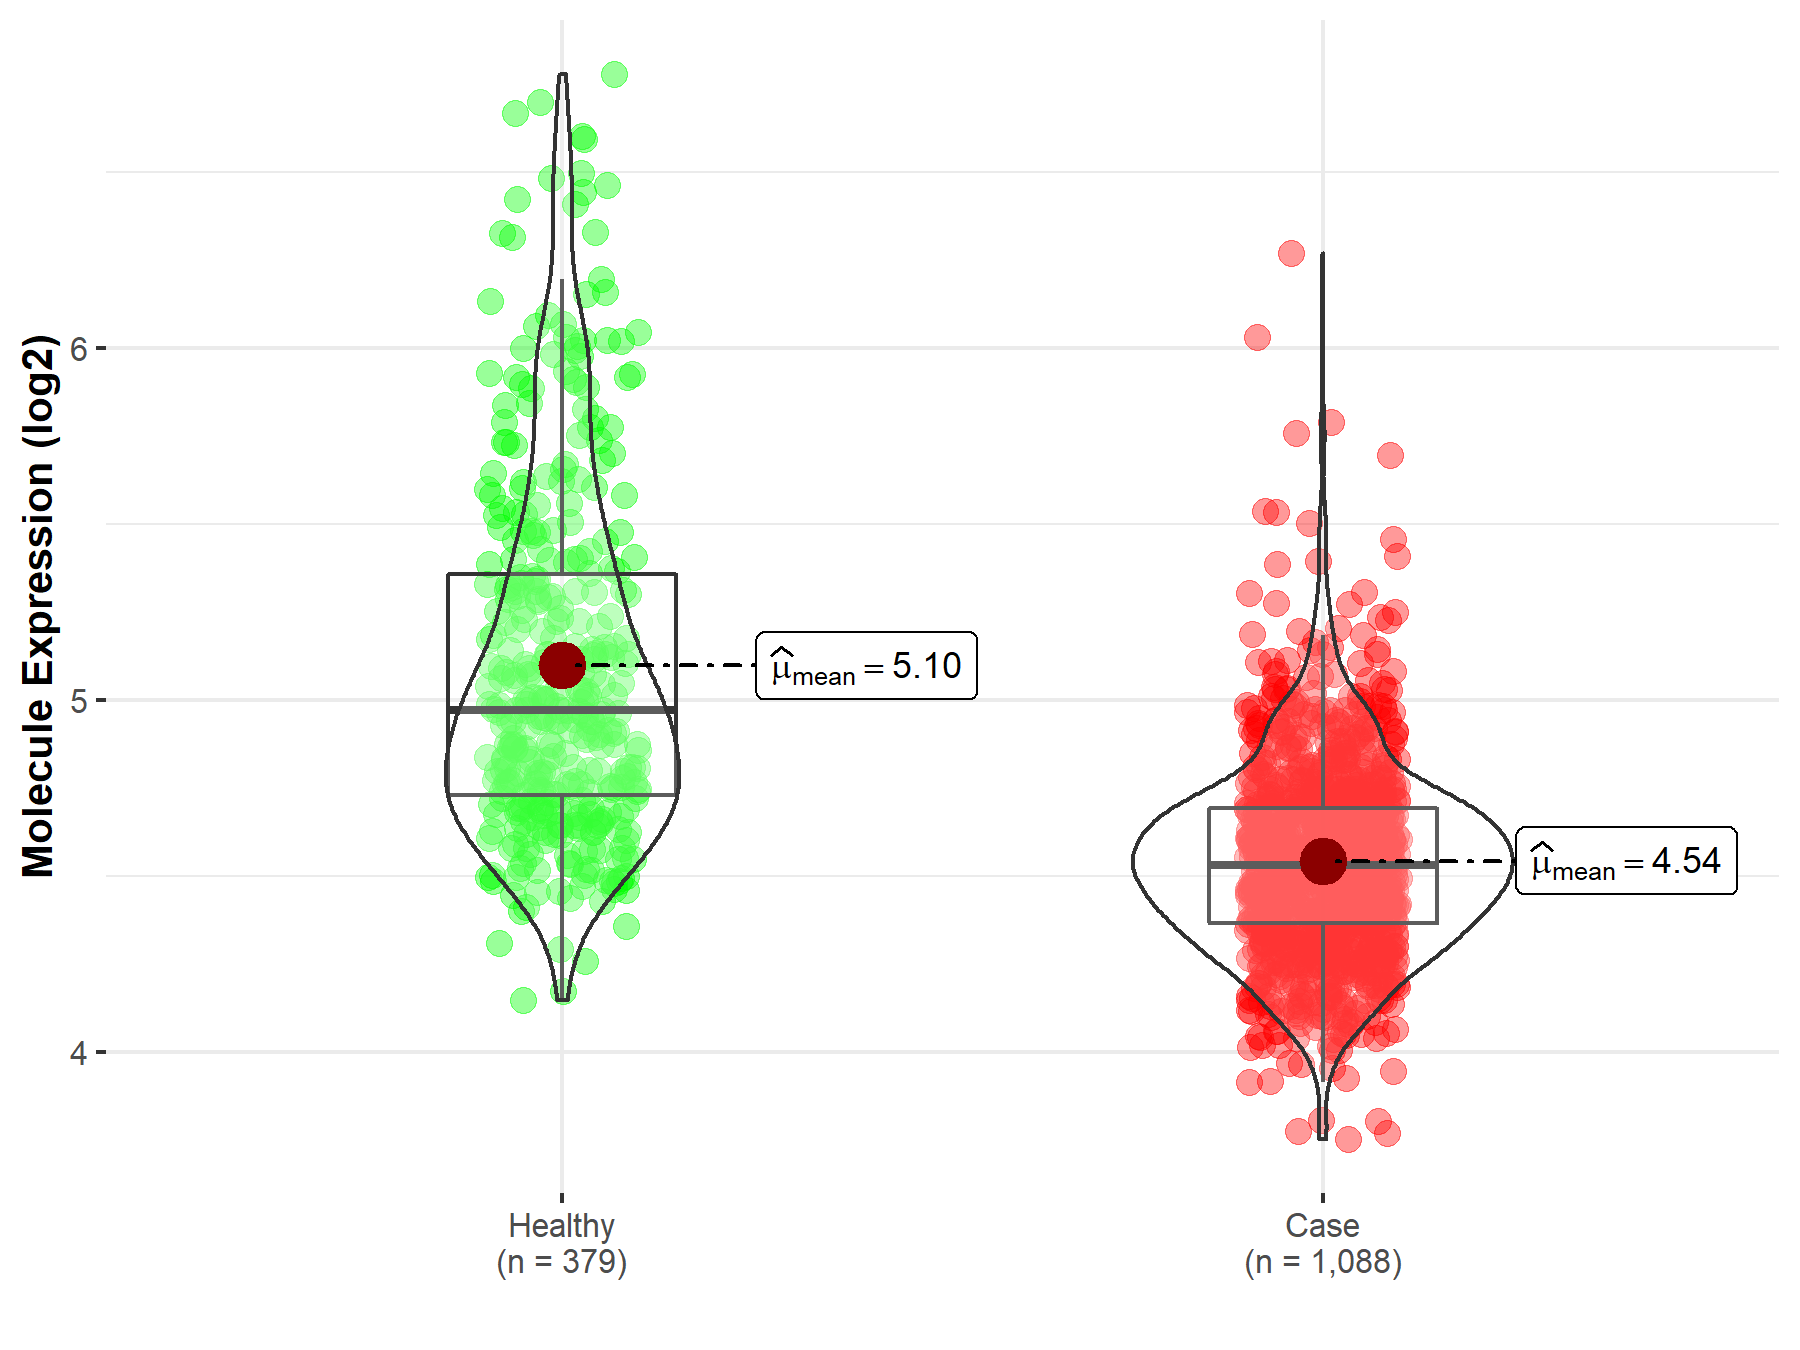
| The Studied Tissue | Nervous tissue | |
| The Specified Disease | Brain cancer | |
| The Expression Level of Disease Section Compare with the Healthy Individual Tissue | p-value: 8.48E-65; Fold-change: -4.42E-01; Z-score: -8.63E-01 | |
|
Molecule expression in the diseased tissue of patients
Molecule expression in the normal tissue of healthy individuals
|
||
| Disease-specific Molecule Abundances |
|
Click to View the Clearer Original Diagram |
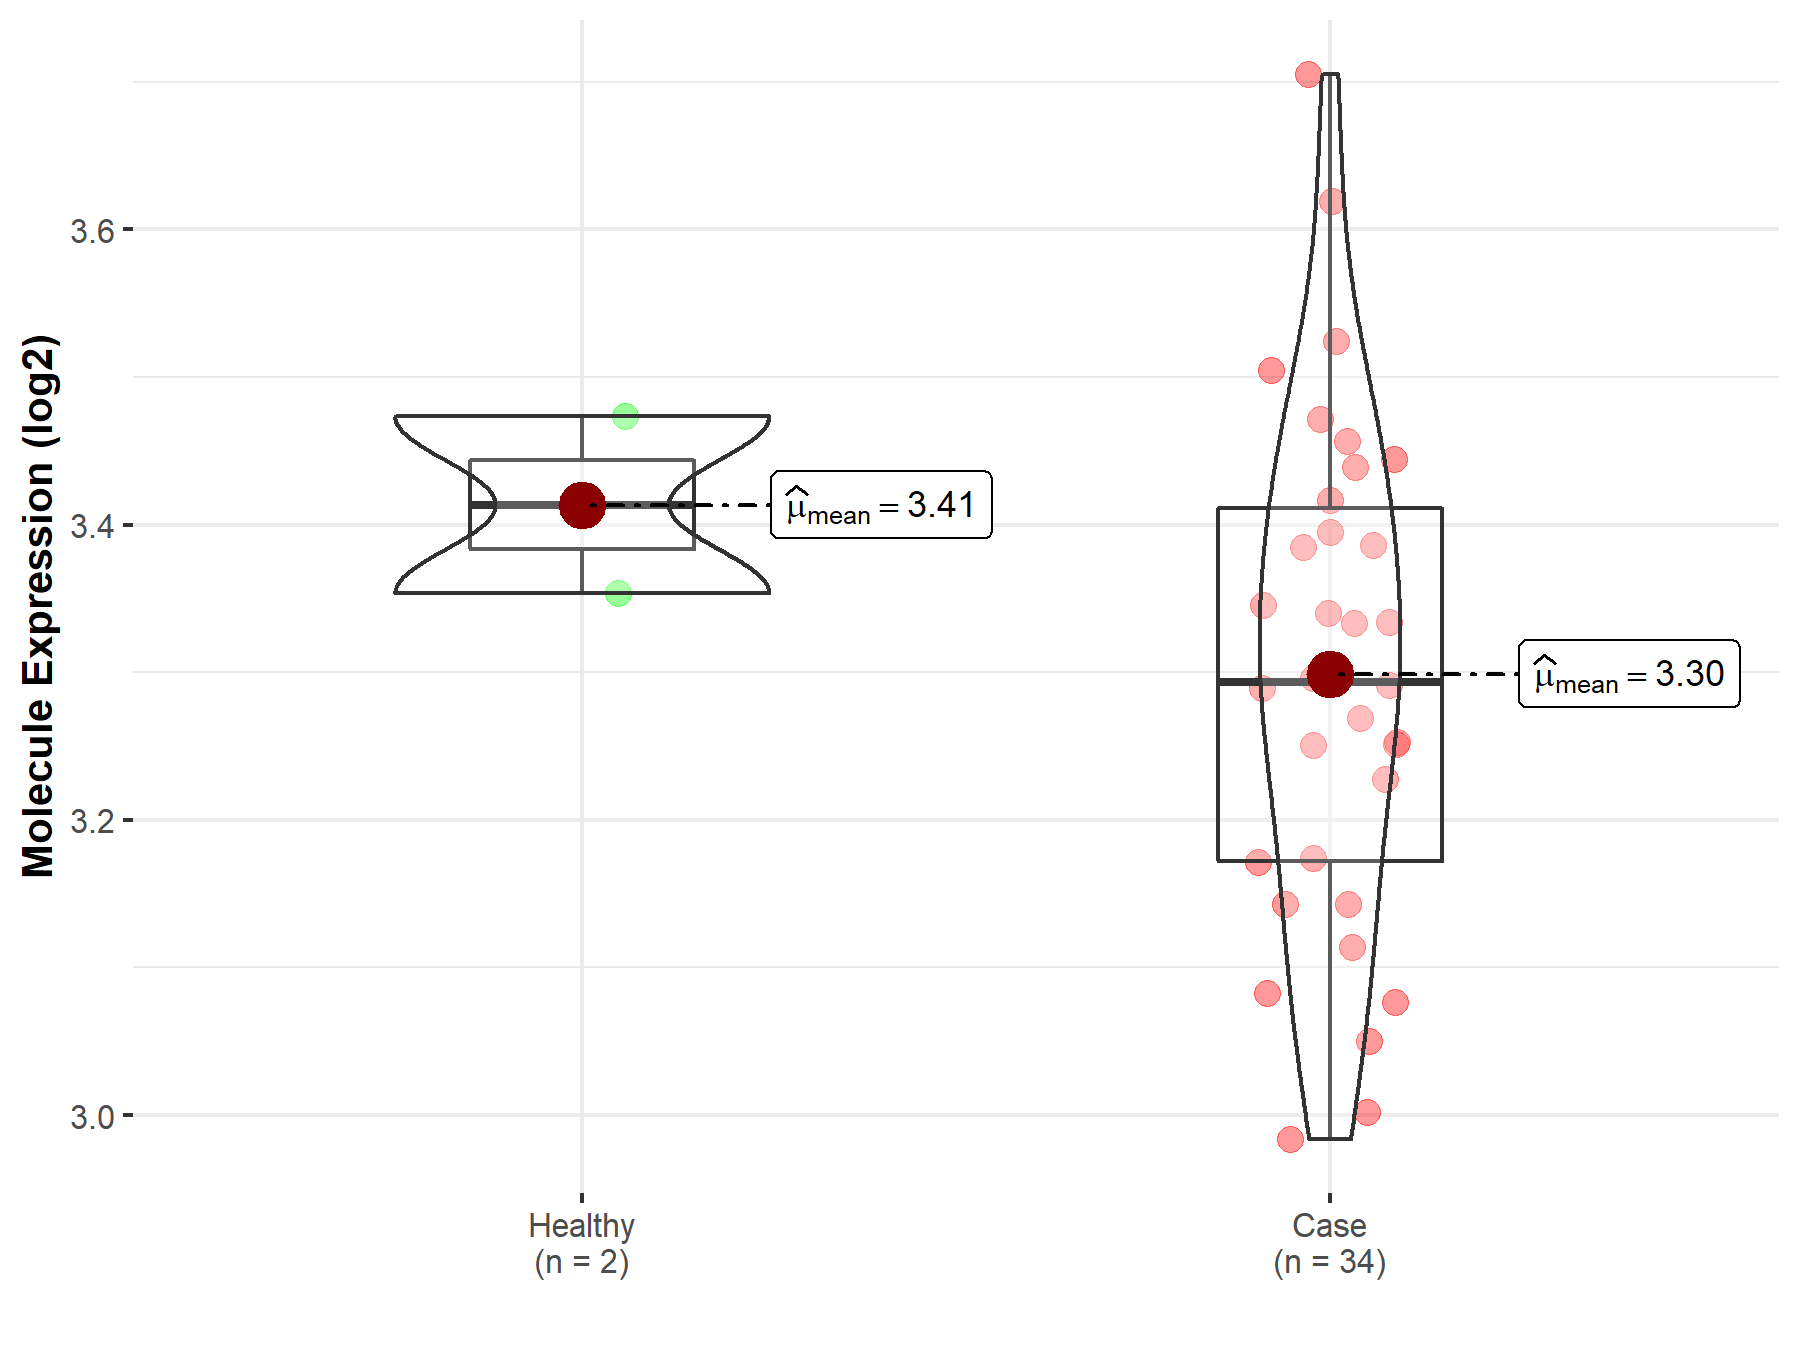
| The Studied Tissue | Brainstem tissue | |
| The Specified Disease | Glioma | |
| The Expression Level of Disease Section Compare with the Healthy Individual Tissue | p-value: 2.66E-01; Fold-change: -1.20E-01; Z-score: -1.41E+00 | |
|
Molecule expression in the diseased tissue of patients
Molecule expression in the normal tissue of healthy individuals
|
||
| Disease-specific Molecule Abundances |
|
Click to View the Clearer Original Diagram |
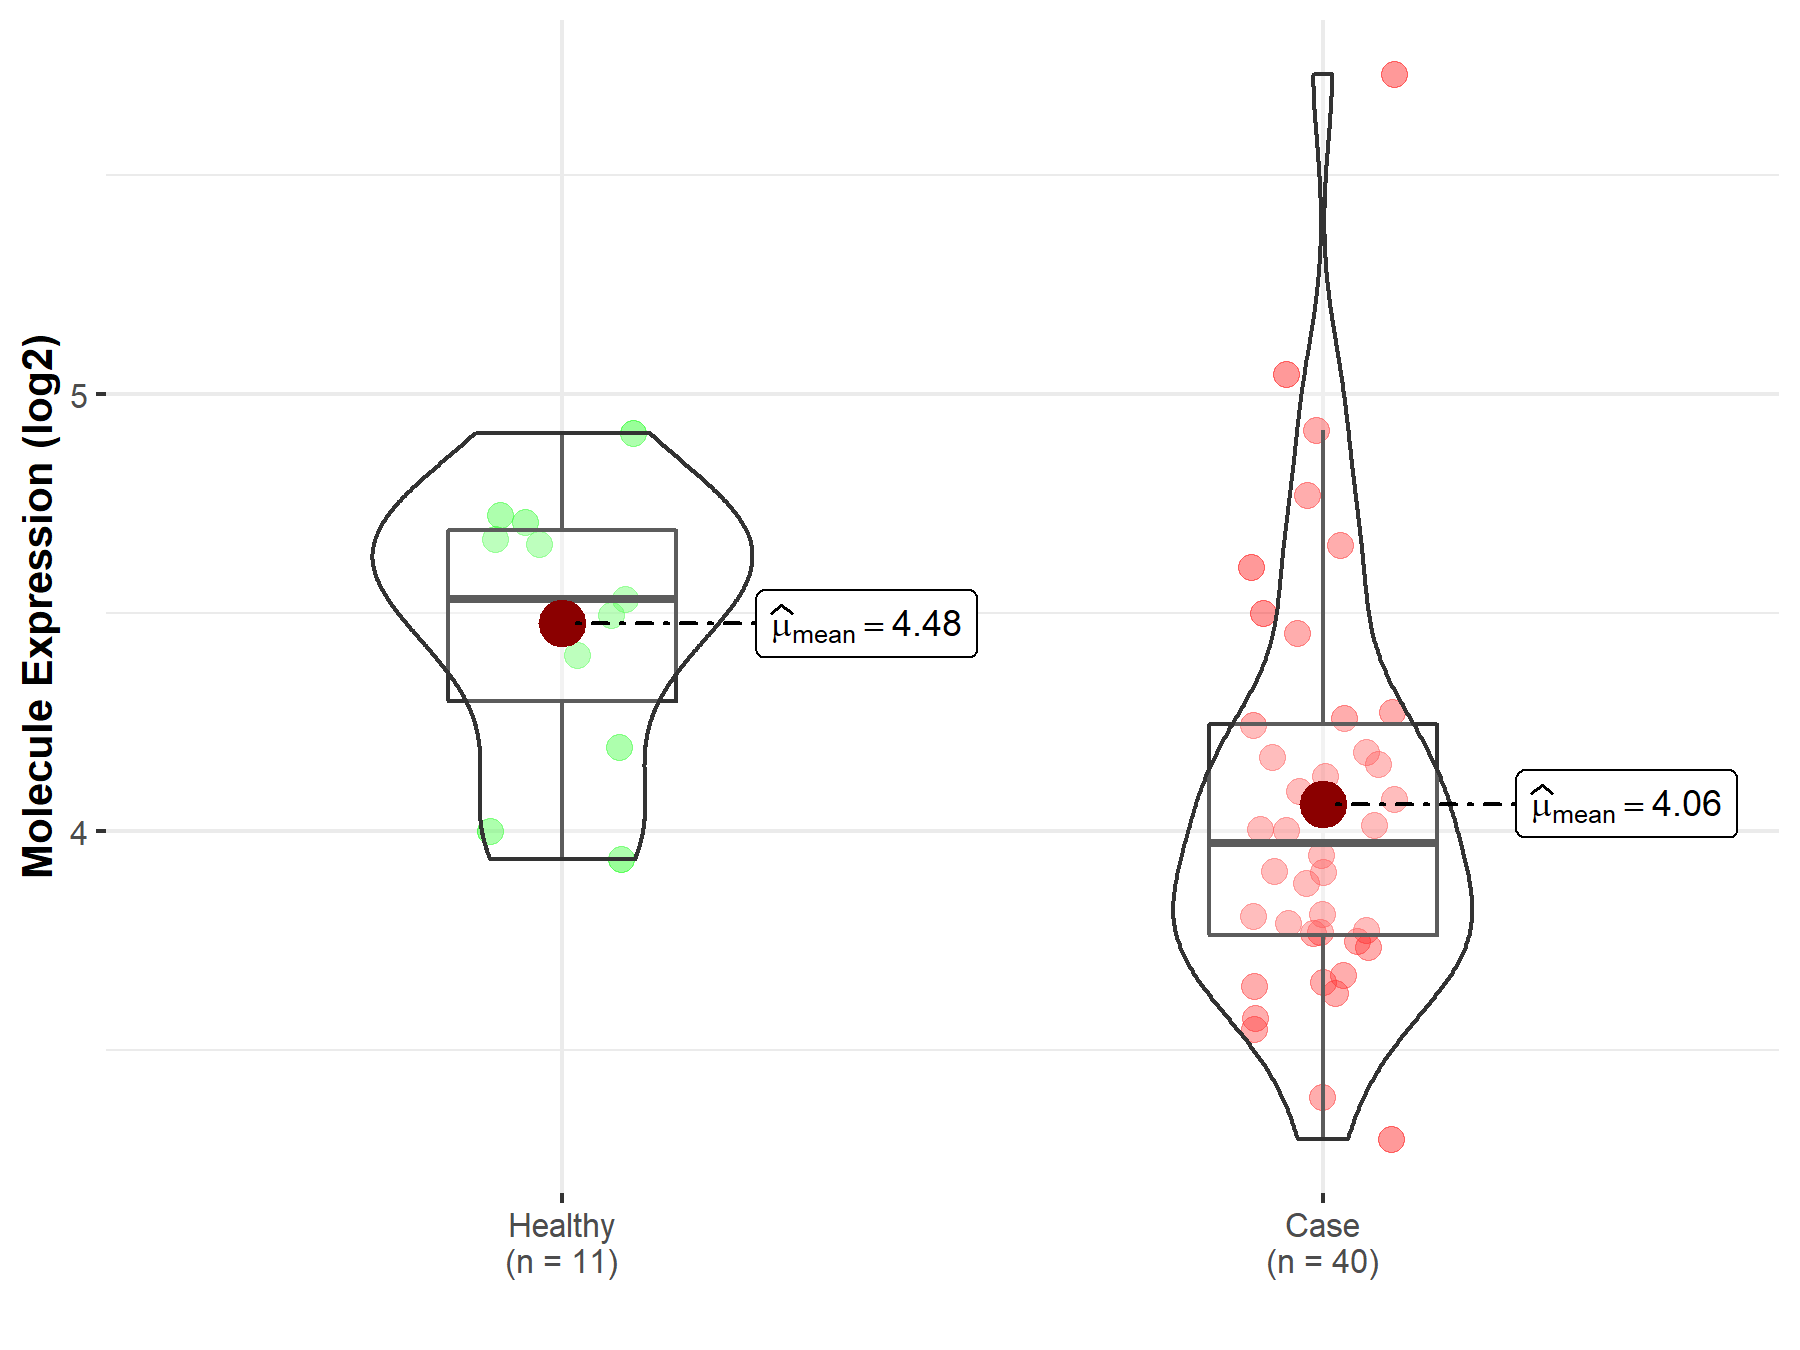
| The Studied Tissue | White matter | |
| The Specified Disease | Glioma | |
| The Expression Level of Disease Section Compare with the Healthy Individual Tissue | p-value: 2.32E-03; Fold-change: -5.58E-01; Z-score: -1.79E+00 | |
|
Molecule expression in the diseased tissue of patients
Molecule expression in the normal tissue of healthy individuals
|
||
| Disease-specific Molecule Abundances |
|
Click to View the Clearer Original Diagram |
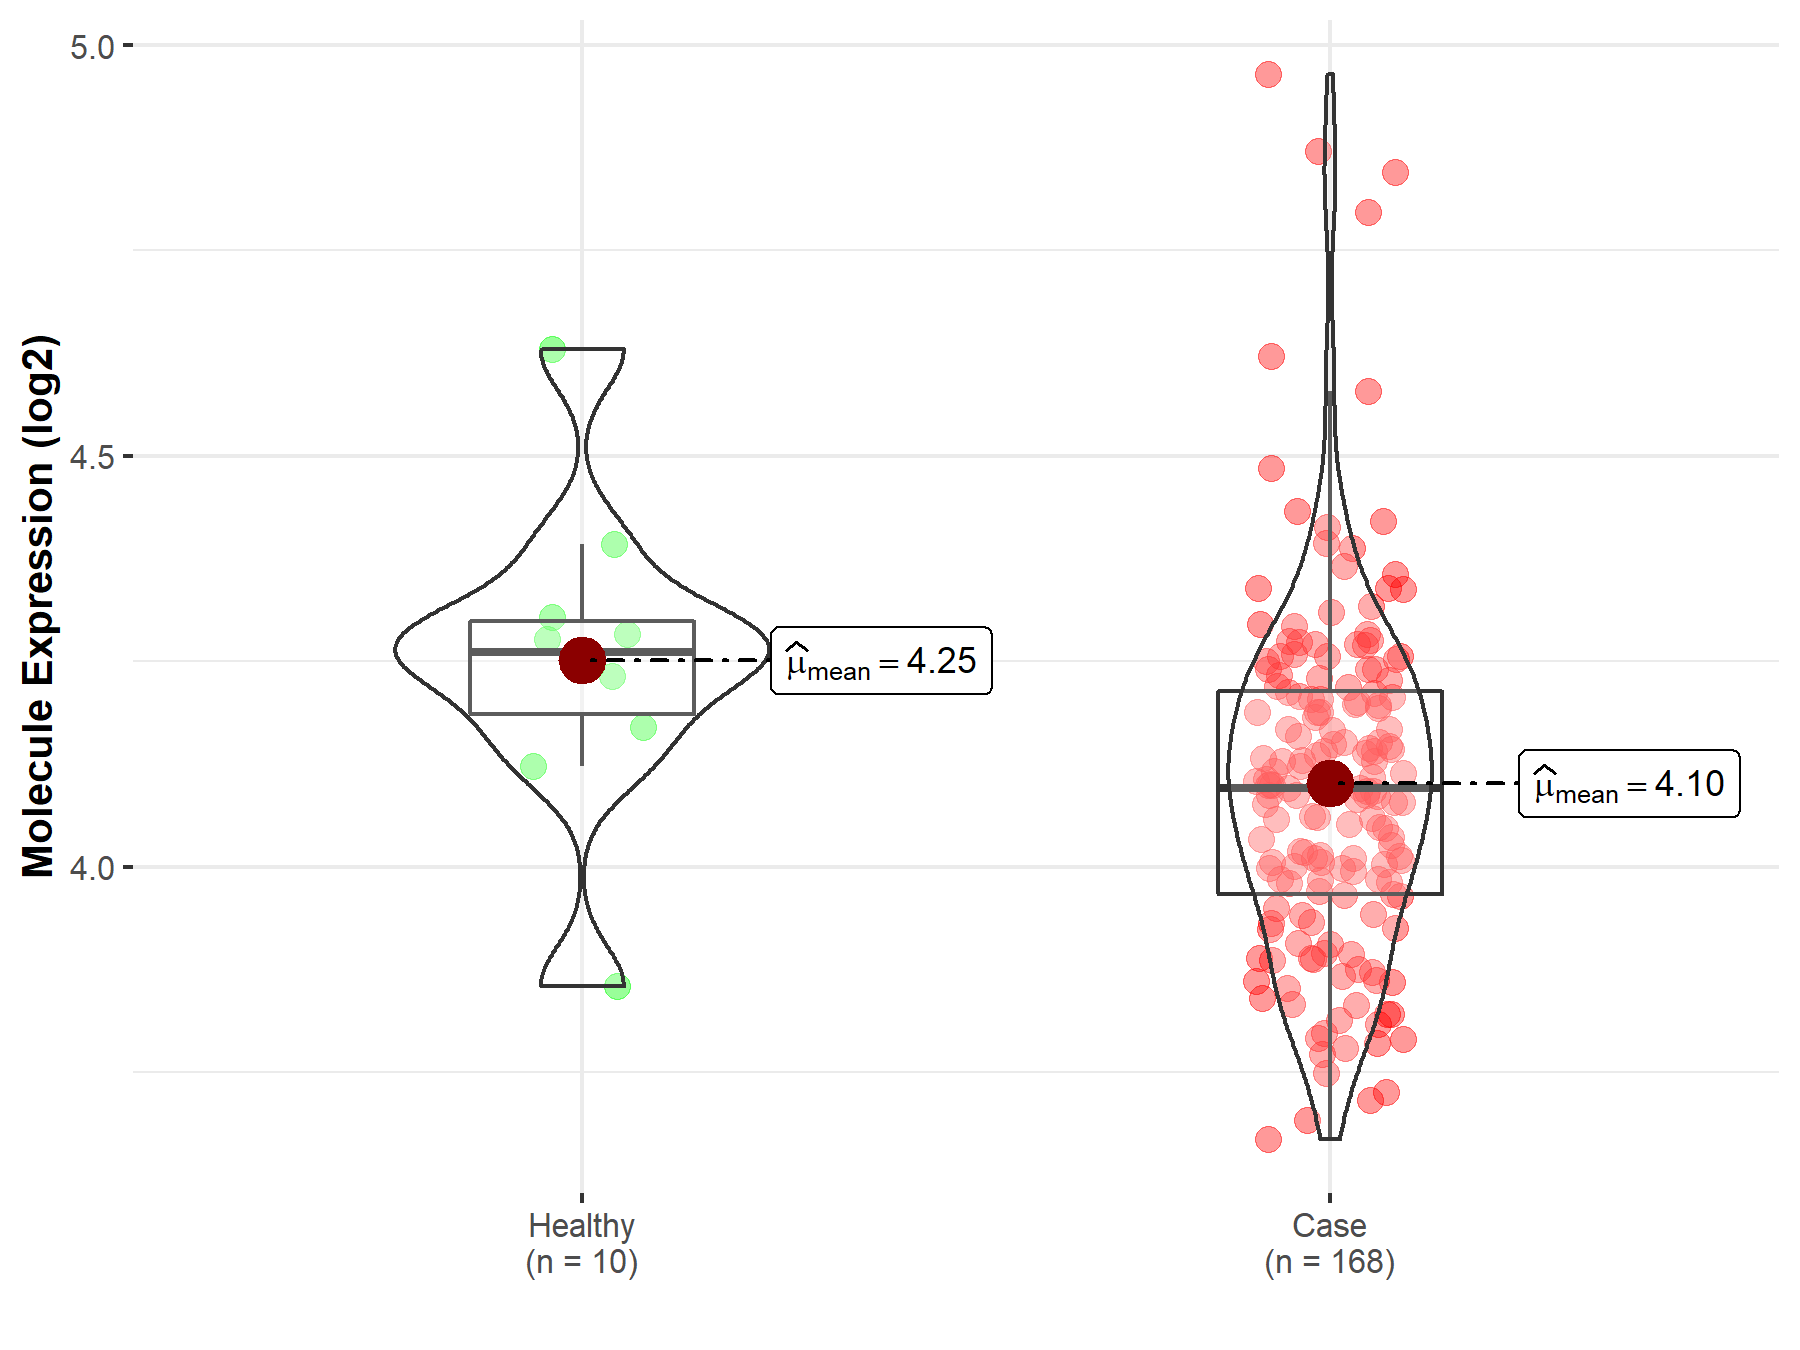
| The Studied Tissue | Brainstem tissue | |
| The Specified Disease | Neuroectodermal tumor | |
| The Expression Level of Disease Section Compare with the Healthy Individual Tissue | p-value: 4.17E-02; Fold-change: -1.65E-01; Z-score: -8.40E-01 | |
|
Molecule expression in the diseased tissue of patients
Molecule expression in the normal tissue of healthy individuals
|
||
| Disease-specific Molecule Abundances |
|
Click to View the Clearer Original Diagram |
Tissue-specific Molecule Abundances in Healthy Individuals

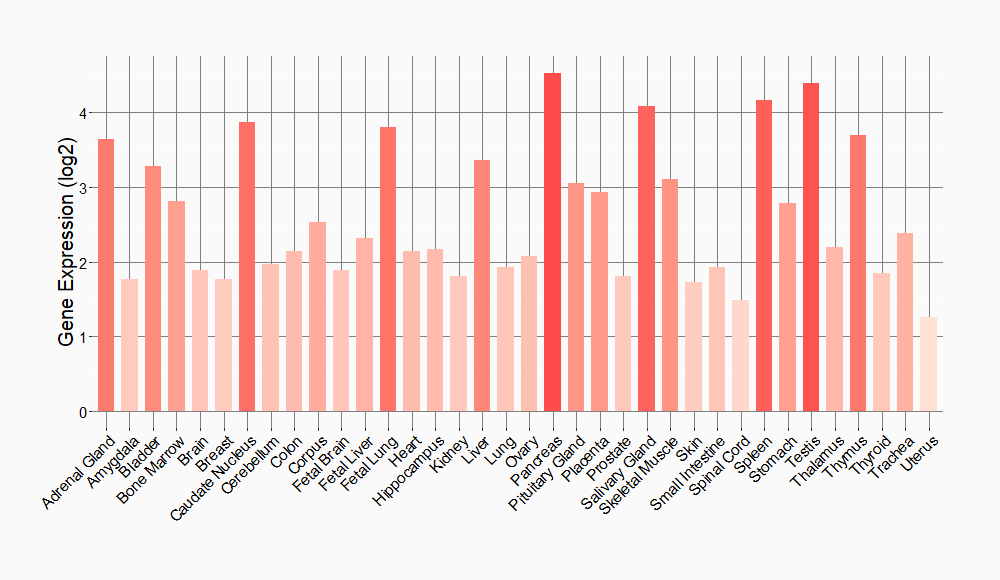
|
||
References
If you find any error in data or bug in web service, please kindly report it to Dr. Sun and Dr. Yu.
