Molecule Information
General Information of the Molecule (ID: Mol00444)
| Name |
Integrin beta-1 (ITGB1)
,Homo sapiens
|
||||
|---|---|---|---|---|---|
| Molecule Type |
Protein
|
||||
| Gene Name |
ITGB1
|
||||
| Gene ID | |||||
| Location |
chr10:32887273-33005792[-]
|
||||
| Sequence |
MNLQPIFWIGLISSVCCVFAQTDENRCLKANAKSCGECIQAGPNCGWCTNSTFLQEGMPT
SARCDDLEALKKKGCPPDDIENPRGSKDIKKNKNVTNRSKGTAEKLKPEDITQIQPQQLV LRLRSGEPQTFTLKFKRAEDYPIDLYYLMDLSYSMKDDLENVKSLGTDLMNEMRRITSDF RIGFGSFVEKTVMPYISTTPAKLRNPCTSEQNCTSPFSYKNVLSLTNKGEVFNELVGKQR ISGNLDSPEGGFDAIMQVAVCGSLIGWRNVTRLLVFSTDAGFHFAGDGKLGGIVLPNDGQ CHLENNMYTMSHYYDYPSIAHLVQKLSENNIQTIFAVTEEFQPVYKELKNLIPKSAVGTL SANSSNVIQLIIDAYNSLSSEVILENGKLSEGVTISYKSYCKNGVNGTGENGRKCSNISI GDEVQFEISITSNKCPKKDSDSFKIRPLGFTEEVEVILQYICECECQSEGIPESPKCHEG NGTFECGACRCNEGRVGRHCECSTDEVNSEDMDAYCRKENSSEICSNNGECVCGQCVCRK RDNTNEIYSGKFCECDNFNCDRSNGLICGGNGVCKCRVCECNPNYTGSACDCSLDTSTCE ASNGQICNGRGICECGVCKCTDPKFQGQTCEMCQTCLGVCAEHKECVQCRAFNKGEKKDT CTQECSYFNITKVESRDKLPQPVQPDPVSHCKEKDVDDCWFYFTYSVNGNNEVMVHVVEN PECPTGPDIIPIVAGVVAGIVLIGLALLLIWKLLMIIHDRREFAKFEKEKMNAKWDTGEN PIYKSAVTTVVNPKYEGK Click to Show/Hide
|
||||
| 3D-structure |
|
||||
| Function |
Integrins alpha-1/beta-1, alpha-2/beta-1, alpha-10/beta-1 and alpha-11/beta-1 are receptors for collagen. Integrins alpha-1/beta-1 and alpha-2/beta-2 recognize the proline-hydroxylated sequence G-F-P-G-E-R in collagen. Integrins alpha-2/beta-1, alpha-3/beta-1, alpha-4/beta-1, alpha-5/beta-1, alpha-8/beta-1, alpha-10/beta-1, alpha-11/beta-1 and alpha-V/beta-1 are receptors for fibronectin. Alpha-4/beta-1 recognizes one or more domains within the alternatively spliced CS-1 and CS-5 regions of fibronectin. Integrin alpha-5/beta-1 is a receptor for fibrinogen. Integrin alpha-1/beta-1, alpha-2/beta-1, alpha-6/beta-1 and alpha-7/beta-1 are receptors for lamimin. Integrin alpha-6/beta-1 (ITGA6:ITGB1) is present in oocytes and is involved in sperm-egg fusion. Integrin alpha-4/beta-1 is a receptor for VCAM1. It recognizes the sequence Q-I-D-S in VCAM1. Integrin alpha-9/beta-1 is a receptor for VCAM1, cytotactin and osteopontin. It recognizes the sequence A-E-I-D-G-I-E-L in cytotactin. Integrin alpha-3/beta-1 is a receptor for epiligrin, thrombospondin and CSPG4. Alpha-3/beta-1 may mediate with LGALS3 the stimulation by CSPG4 of endothelial cells migration. Integrin alpha-V/beta-1 is a receptor for vitronectin. Beta-1 integrins recognize the sequence R-G-D in a wide array of ligands. When associated with alpha-7 integrin, regulates cell adhesion and laminin matrix deposition. Involved in promoting endothelial cell motility and angiogenesis. Involved in osteoblast compaction through the fibronectin fibrillogenesis cell-mediated matrix assembly process and the formation of mineralized bone nodules. May be involved in up-regulation of the activity of kinases such as PKC via binding to KRT1. Together with KRT1 and RACK1, serves as a platform for SRC activation or inactivation. Plays a mechanistic adhesive role during telophase, required for the successful completion of cytokinesis. Integrin alpha-3/beta-1 provides a docking site for FAP (seprase) at invadopodia plasma membranes in a collagen-dependent manner and hence may participate in the adhesion, formation of invadopodia and matrix degradation processes, promoting cell invasion. ITGA4:ITGB1 binds to fractalkine (CX3CL1) and may act as its coreceptor in CX3CR1-dependent fractalkine signaling. ITGA4:ITGB1 and ITGA5:ITGB1 bind to PLA2G2A via a site (site 2) which is distinct from the classical ligand-binding site (site 1) and this induces integrin conformational changes and enhanced ligand binding to site 1. ITGA5:ITGB1 acts as a receptor for fibrillin-1 (FBN1) and mediates R-G-D-dependent cell adhesion to FBN1. ITGA5:ITGB1 is a receptor for IL1B and binding is essential for IL1B signaling. ITGA5:ITGB3 is a receptor for soluble CD40LG and is required for CD40/CD40LG signaling. Plays an important role in myoblast differentiation and fusion during skeletal myogenesis.
Click to Show/Hide
|
||||
| Uniprot ID | |||||
| Ensembl ID | |||||
| HGNC ID | |||||
| Click to Show/Hide the Complete Species Lineage | |||||
Type(s) of Resistant Mechanism of This Molecule
Drug Resistance Data Categorized by Drug
Approved Drug(s)
3 drug(s) in total
| Drug Sensitivity Data Categorized by Their Corresponding Mechanisms | ||||
|
|
||||
| Disease Class: Glioblastoma [ICD-11: 2A00.02] | [1] | |||
| Sensitive Disease | Glioblastoma [ICD-11: 2A00.02] | |||
| Sensitive Drug | Prochlorperazine | |||
| Molecule Alteration | Expression | Down-regulation |
||
| Differential expression of the molecule in resistant disease | ||||
| Classification of Disease | Brain cancer [ICD-11: 2A00] | |||
| The Specified Disease | Glioblastoma | |||
| The Studied Tissue | Blood | |||
| The Expression Level of Disease Section Compare with the Healthy Individual Tissue | p-value: 1.62E-08 Fold-change: -1.51E-01 Z-score: -5.90E+00 |
|||
| Experimental Note | Revealed Based on the Cell Line Data | |||
| Cell Pathway Regulation | Cell invasion | Inhibition | hsa05200 | |
| Cell migration | Inhibition | hsa04670 | ||
| In Vitro Model | SHI-1 cells | Bone marrow | Homo sapiens (Human) | CVCL_2191 |
| Experiment for Molecule Alteration |
Western blot analysis; RNA-sequencing analysis | |||
| Experiment for Drug Resistance |
Wound healing assay;Transwell assay | |||
| Mechanism Description | Prochlorperazine may modulate the expression levels of multidrug resistance proteins (they decreased ABCB1 and increased ABCG2 expression), E-cadherin, alpha-tubulin and integrins, and could impair the migration and invasion of U-87 MG cells. | |||
| Drug Sensitivity Data Categorized by Their Corresponding Mechanisms | ||||
|
|
||||
| Disease Class: Glioblastoma [ICD-11: 2A00.02] | [1] | |||
| Sensitive Disease | Glioblastoma [ICD-11: 2A00.02] | |||
| Sensitive Drug | Perphenazine | |||
| Molecule Alteration | Expression | Down-regulation |
||
| Differential expression of the molecule in resistant disease | ||||
| Classification of Disease | Brain cancer [ICD-11: 2A00] | |||
| The Specified Disease | Neuroectodermal tumor | |||
| The Studied Tissue | Brainstem tissue | |||
| The Expression Level of Disease Section Compare with the Healthy Individual Tissue | p-value: 4.76E-04 Fold-change: -6.90E-02 Z-score: -4.53E+00 |
|||
| Experimental Note | Revealed Based on the Cell Line Data | |||
| Cell Pathway Regulation | Cell migration | Inhibition | hsa04670 | |
| Cell invasion | Inhibition | hsa05200 | ||
| In Vitro Model | SHI-1 cells | Bone marrow | Homo sapiens (Human) | CVCL_2191 |
| Experiment for Molecule Alteration |
Western blot analysis | |||
| Mechanism Description | The present study explored the effects of perphenazine and prochlorperazine on the levels of ABCB1, ABCG2, E-cadherin, alpha-tubulin and integrins (alpha3, alpha5, and beta1), as well as on the migratory and invasive ability of U87-MG cells. The results suggested that perphenazine and prochlorperazine may modulate the expression levels of multidrug resistance proteins (they decreased ABCB1 and increased ABCG2 expression), E-cadherin, alpha-tubulin and integrins, and could impair the migration and invasion of U-87 MG cells. | |||
| Drug Sensitivity Data Categorized by Their Corresponding Mechanisms | ||||
|
|
||||
| Disease Class: Nasopharyngeal carcinoma [ICD-11: 2B6B.0] | [2] | |||
| Sensitive Disease | Nasopharyngeal carcinoma [ICD-11: 2B6B.0] | |||
| Sensitive Drug | Paclitaxel | |||
| Molecule Alteration | Expression | Down-regulation |
||
| Experimental Note | Revealed Based on the Cell Line Data | |||
| Cell Pathway Regulation | Cell apoptosis | Activation | hsa04210 | |
| Cell viability | Inhibition | hsa05200 | ||
| In Vitro Model | C666-1 cells | Throat | Homo sapiens (Human) | CVCL_7949 |
| SUNE-1 cells | Nasopharynx | Homo sapiens (Human) | CVCL_6946 | |
| In Vivo Model | Nude mouse xenograft model | Mus musculus | ||
| Experiment for Molecule Alteration |
Western blot analysis | |||
| Experiment for Drug Resistance |
MTT assay; Flow cytometry assay | |||
| Mechanism Description | Overexpression of miR-29c and knockdown of ITGB1 can resensitize drug-resistant NPC cells to Taxol and promote apoptosis. | |||
Disease- and Tissue-specific Abundances of This Molecule
ICD Disease Classification 02

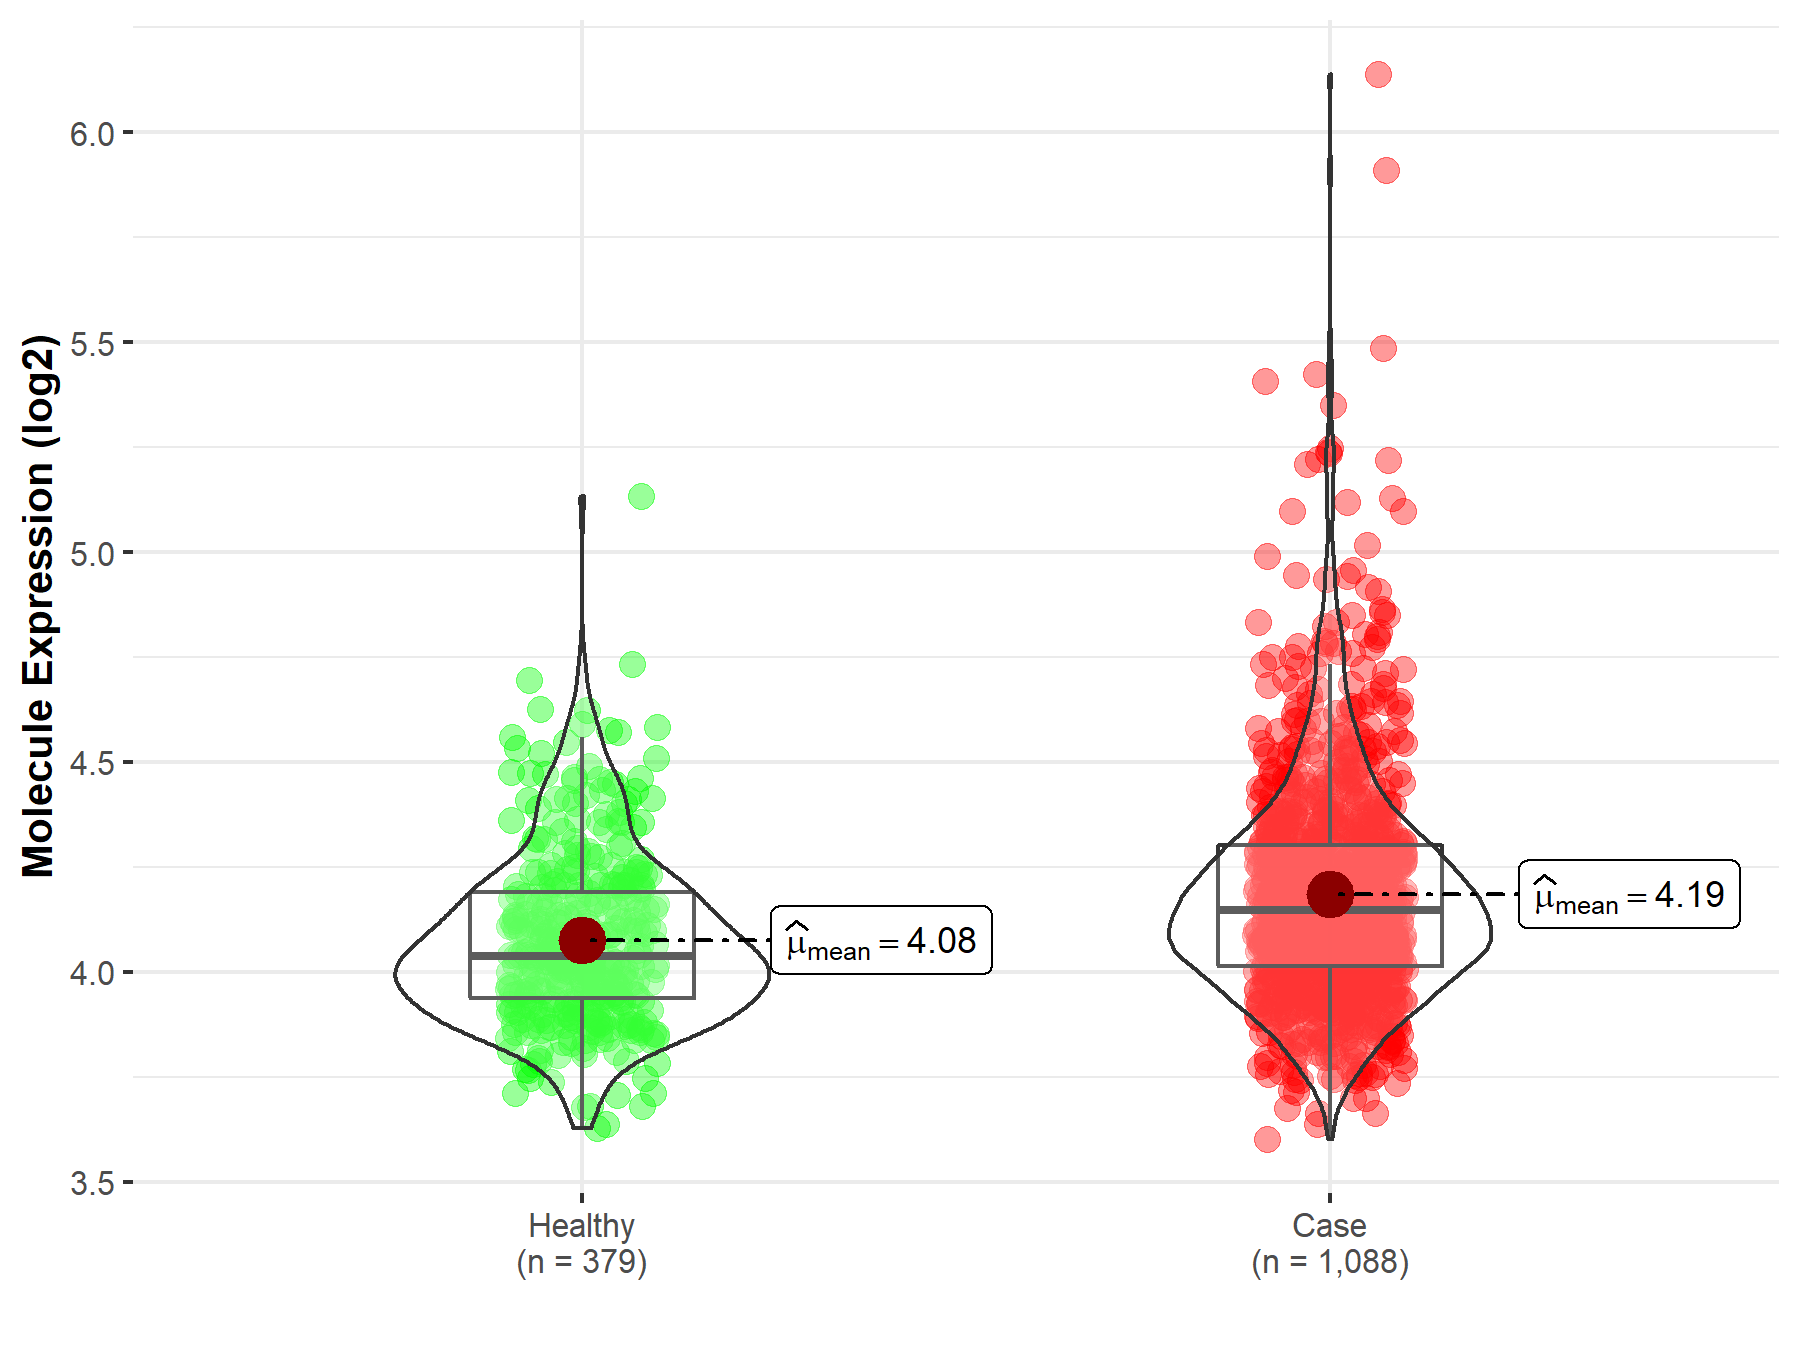
| Differential expression of molecule in resistant diseases | ||
| The Studied Tissue | Nervous tissue | |
| The Specified Disease | Brain cancer | |
| The Expression Level of Disease Section Compare with the Healthy Individual Tissue | p-value: 2.06E-15; Fold-change: 1.10E-01; Z-score: 5.32E-01 | |
|
Molecule expression in the diseased tissue of patients
Molecule expression in the normal tissue of healthy individuals
|
||
| Disease-specific Molecule Abundances |

|
Click to View the Clearer Original Diagram |
| The Studied Tissue | Brainstem tissue | |
| The Specified Disease | Glioma | |
| The Expression Level of Disease Section Compare with the Healthy Individual Tissue | p-value: 2.30E-01; Fold-change: 2.67E-01; Z-score: 1.75E+00 | |
|
Molecule expression in the diseased tissue of patients
Molecule expression in the normal tissue of healthy individuals
|
||
| Disease-specific Molecule Abundances |

|
Click to View the Clearer Original Diagram |
| The Studied Tissue | White matter | |
| The Specified Disease | Glioma | |
| The Expression Level of Disease Section Compare with the Healthy Individual Tissue | p-value: 3.28E-01; Fold-change: -1.81E-01; Z-score: -7.08E-01 | |
|
Molecule expression in the diseased tissue of patients
Molecule expression in the normal tissue of healthy individuals
|
||
| Disease-specific Molecule Abundances |

|
Click to View the Clearer Original Diagram |
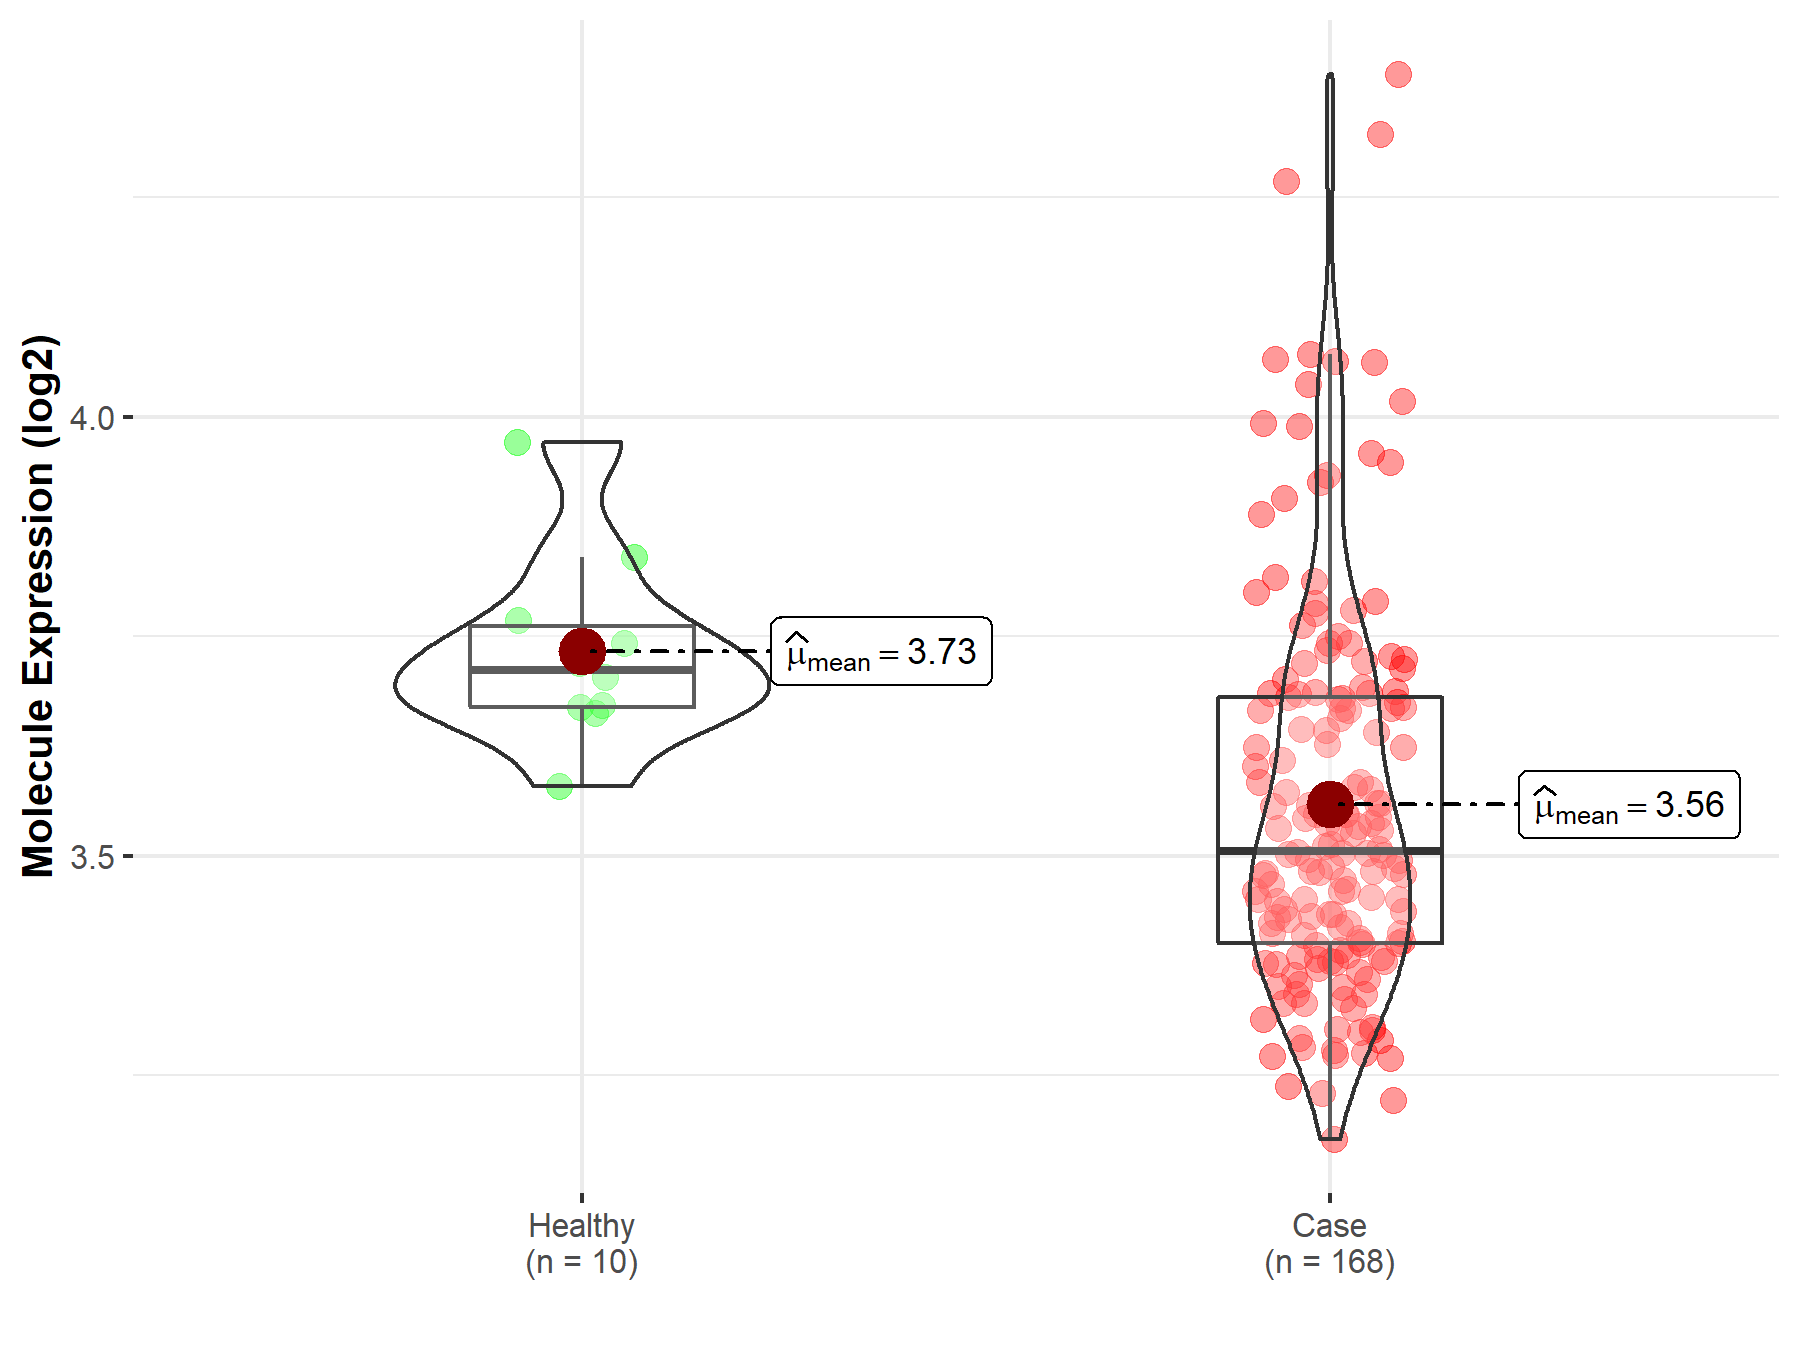
| The Studied Tissue | Brainstem tissue | |
| The Specified Disease | Neuroectodermal tumor | |
| The Expression Level of Disease Section Compare with the Healthy Individual Tissue | p-value: 4.76E-04; Fold-change: -2.06E-01; Z-score: -1.89E+00 | |
|
Molecule expression in the diseased tissue of patients
Molecule expression in the normal tissue of healthy individuals
|
||
| Disease-specific Molecule Abundances |

|
Click to View the Clearer Original Diagram |
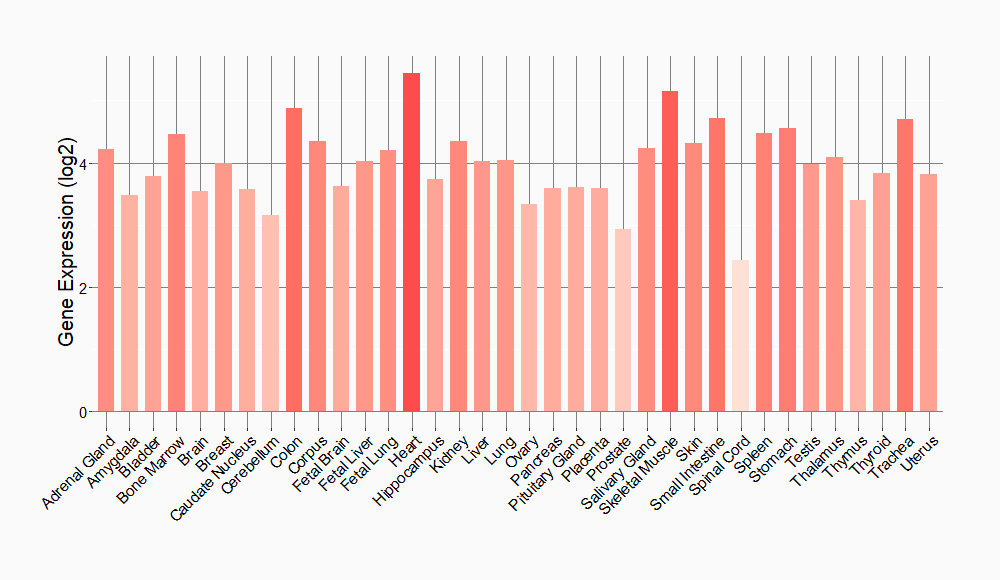
Tissue-specific Molecule Abundances in Healthy Individuals


|
||
References
If you find any error in data or bug in web service, please kindly report it to Dr. Sun and Dr. Yu.
