Molecule Information
General Information of the Molecule (ID: Mol00428)
| Name |
Interferon-induced protein with tetratricopeptide repeats 2 (IFIT2)
,Homo sapiens
|
||||
|---|---|---|---|---|---|
| Synonyms |
IFIT-2; ISG-54 K; Interferon-induced 54 kDa protein; IFI-54K; P54; CIG-42; G10P2; IFI54; ISG54
Click to Show/Hide
|
||||
| Molecule Type |
Protein
|
||||
| Gene Name |
IFIT2
|
||||
| Gene ID | |||||
| Location |
chr10:89283694-89309271[+]
|
||||
| Sequence |
MSENNKNSLESSLRQLKCHFTWNLMEGENSLDDFEDKVFYRTEFQNREFKATMCNLLAYL
KHLKGQNEAALECLRKAEELIQQEHADQAEIRSLVTWGNYAWVYYHMGRLSDVQIYVDKV KHVCEKFSSPYRIESPELDCEEGWTRLKCGGNQNERAKVCFEKALEKKPKNPEFTSGLAI ASYRLDNWPPSQNAIDPLRQAIRLNPDNQYLKVLLALKLHKMREEGEEEGEGEKLVEEAL EKAPGVTDVLRSAAKFYRRKDEPDKAIELLKKALEYIPNNAYLHCQIGCCYRAKVFQVMN LRENGMYGKRKLLELIGHAVAHLKKADEANDNLFRVCSILASLHALADQYEDAEYYFQKE FSKELTPVAKQLLHLRYGNFQLYQMKCEDKAIHHFIEGVKINQKSREKEKMKDKLQKIAK MRLSKNGADSEALHVLAFLQELNEKMQQADEDSERGLESGSLIPSASSWNGE Click to Show/Hide
|
||||
| 3D-structure |
|
||||
| Function |
IFN-induced antiviral protein which inhibits expression of viral messenger RNAs lacking 2'-O-methylation of the 5' cap. The ribose 2'-O-methylation would provide a molecular signature to distinguish between self and non-self mRNAs by the host during viral infection. Viruses evolved several ways to evade this restriction system such as encoding their own 2'-O-methylase for their mRNAs or by stealing host cap containing the 2'-O-methylation (cap snatching mechanism). Binds AU-rich viral RNAs, with or without 5' triphosphorylation, RNA-binding is required for antiviral activity. Can promote apoptosis.
Click to Show/Hide
|
||||
| Uniprot ID | |||||
| Ensembl ID | |||||
| HGNC ID | |||||
| Click to Show/Hide the Complete Species Lineage | |||||
Type(s) of Resistant Mechanism of This Molecule
Drug Resistance Data Categorized by Drug
Approved Drug(s)
2 drug(s) in total
| Drug Resistance Data Categorized by Their Corresponding Mechanisms | ||||
|
|
||||
| Disease Class: Ovarian cancer [ICD-11: 2C73.0] | [1] | |||
| Resistant Disease | Ovarian cancer [ICD-11: 2C73.0] | |||
| Resistant Drug | Carboplatin | |||
| Molecule Alteration | Expression | Down-regulation |
||
| Experimental Note | Revealed Based on the Cell Line Data | |||
| In Vitro Model | OVCAR3 cells | Ovary | Homo sapiens (Human) | CVCL_0465 |
| Experiment for Molecule Alteration |
qPCR | |||
| Experiment for Drug Resistance |
Alamar Blue assay | |||
| Mechanism Description | 2 platinum-associated miRNAs (miR-193b* and miR-320) that inhibit the expression of five platinum-associated genes (CRIM1, IFIT2, OAS1, kCNMA1 and GRAMD1B). over-expression of miR-193b* in a randomly selected HapMap cell line results in resistance to both carboplatin and cisplatin. | |||
| Drug Resistance Data Categorized by Their Corresponding Mechanisms | ||||
|
|
||||
| Disease Class: Osteosarcoma [ICD-11: 2B51.0] | [2] | |||
| Resistant Disease | Osteosarcoma [ICD-11: 2B51.0] | |||
| Resistant Drug | Cisplatin | |||
| Molecule Alteration | Expression | Down-regulation |
||
| Experimental Note | Revealed Based on the Cell Line Data | |||
| Cell Pathway Regulation | Cell colony | Inhibition | hsa05200 | |
| In Vitro Model | MG63 cells | Bone marrow | Homo sapiens (Human) | CVCL_0426 |
| U2OS cells | Bone | Homo sapiens (Human) | CVCL_0042 | |
| Experiment for Molecule Alteration |
Western blot analysis | |||
| Experiment for Drug Resistance |
Ckk-8 assay; Colony formation assay; Annexin V-FITC staining assay | |||
| Mechanism Description | Long non-coding RNA LINC00161 sensitises osteosarcoma cells to cisplatin-induced apoptosis by regulating the miR645-IFIT2 axis. LINC00161 upregulated IFIT2 expression via miR645. | |||
Disease- and Tissue-specific Abundances of This Molecule
ICD Disease Classification 02

| Differential expression of molecule in resistant diseases | ||
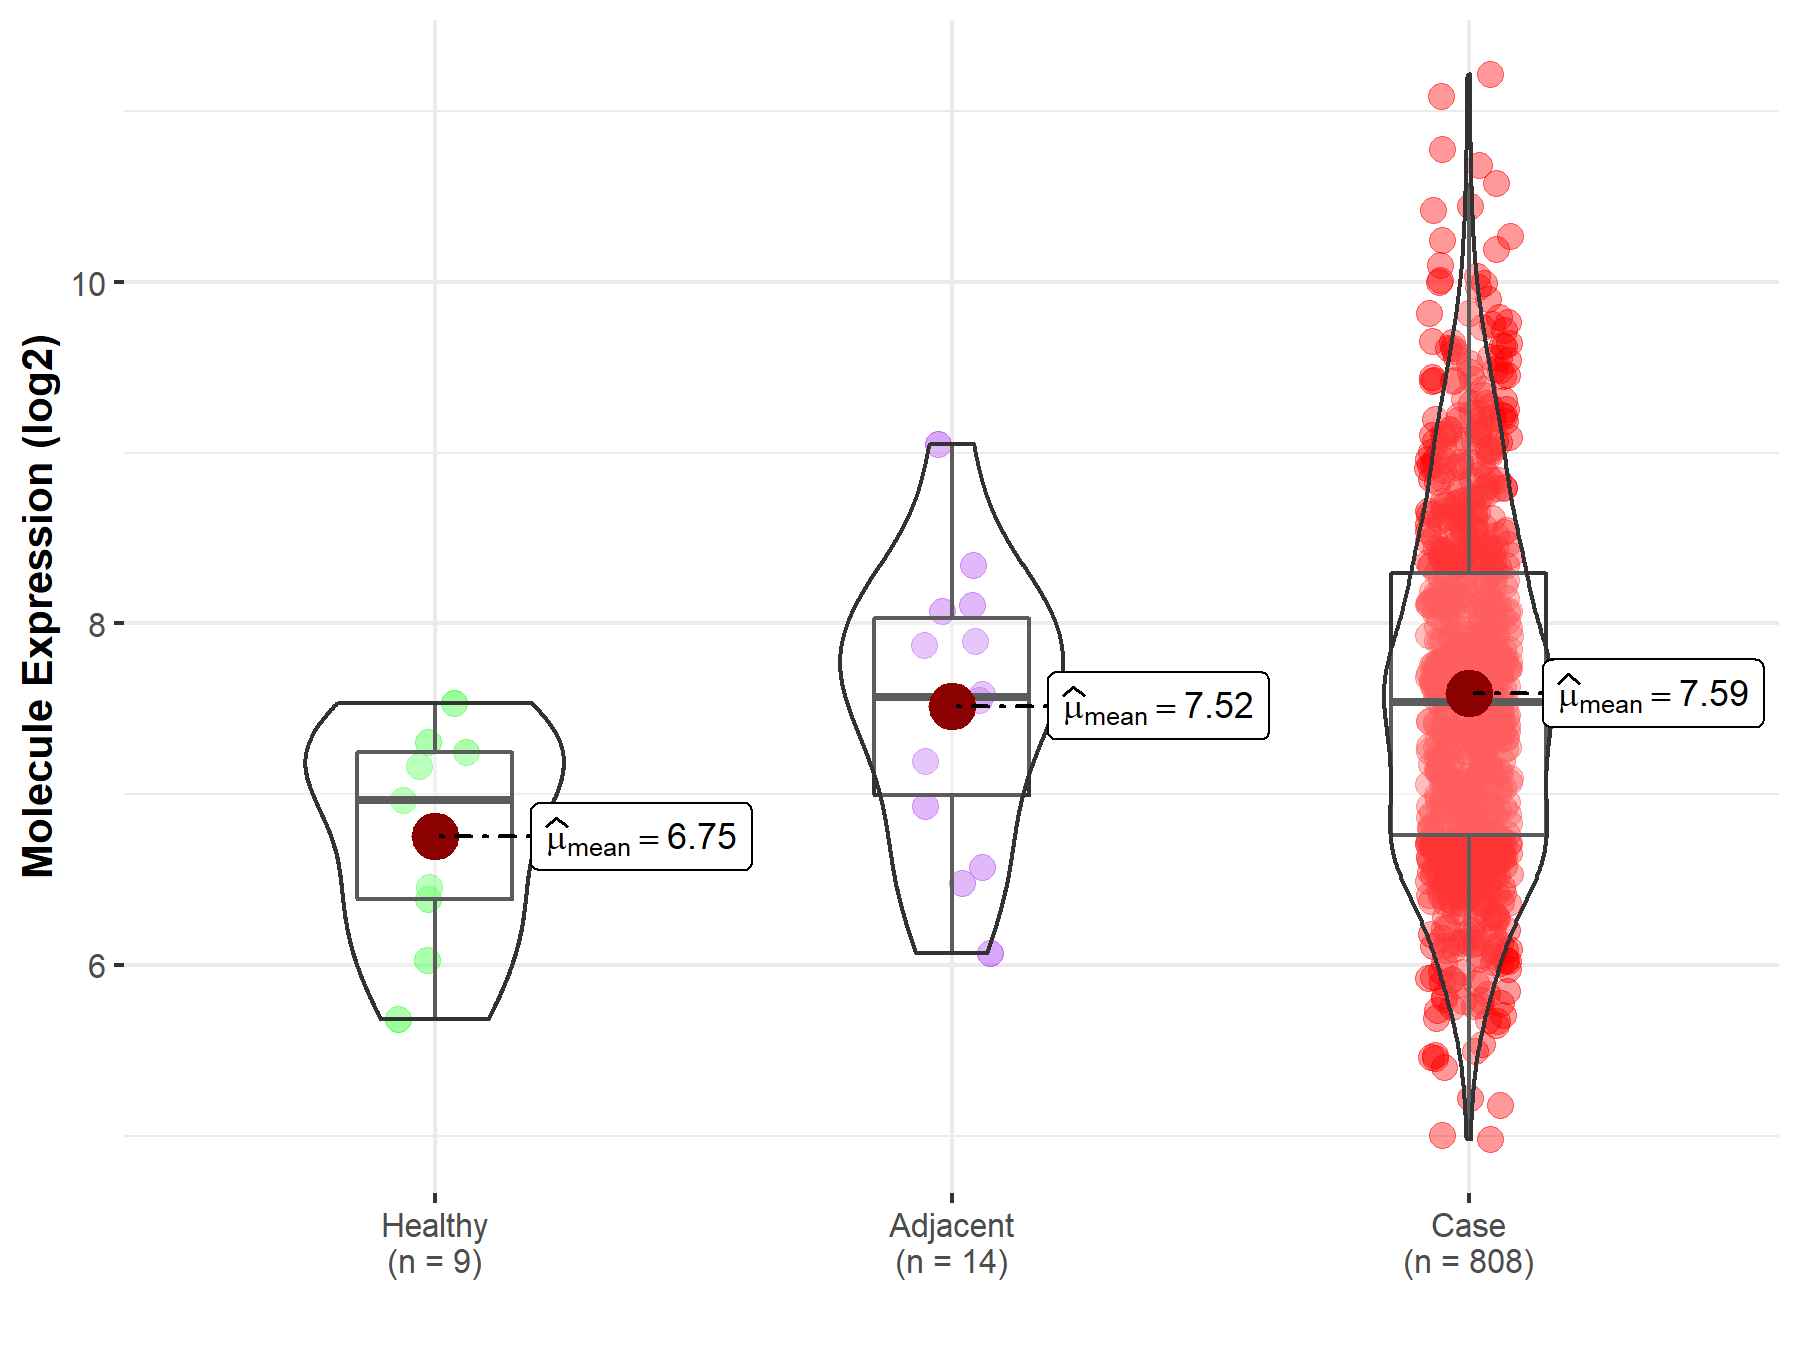
| The Studied Tissue | Ovary | |
| The Specified Disease | Ovarian cancer | |
| The Expression Level of Disease Section Compare with the Healthy Individual Tissue | p-value: 4.21E-03; Fold-change: 5.74E-01; Z-score: 8.97E-01 | |
| The Expression Level of Disease Section Compare with the Adjacent Tissue | p-value: 7.45E-01; Fold-change: -2.65E-02; Z-score: -3.28E-02 | |
|
Molecule expression in the normal tissue adjacent to the diseased tissue of patients
Molecule expression in the diseased tissue of patients
Molecule expression in the normal tissue of healthy individuals
|
||
| Disease-specific Molecule Abundances |

|
Click to View the Clearer Original Diagram |
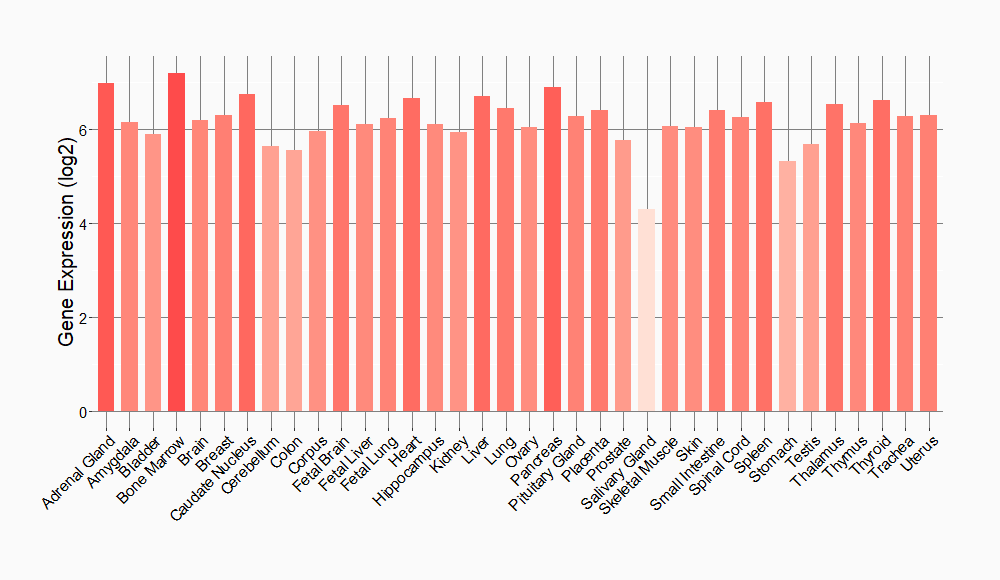
Tissue-specific Molecule Abundances in Healthy Individuals


|
||
References
If you find any error in data or bug in web service, please kindly report it to Dr. Sun and Dr. Yu.
