Molecule Information
General Information of the Molecule (ID: Mol00366)
| Name |
Fanconi anemia group D2 protein (FANCD2)
,Homo sapiens
|
||||
|---|---|---|---|---|---|
| Synonyms |
Protein FACD2; FACD
Click to Show/Hide
|
||||
| Molecule Type |
Protein
|
||||
| Gene Name |
FANCD2
|
||||
| Gene ID | |||||
| Location |
chr3:10026370-10101932[+]
|
||||
| Sequence |
MVSKRRLSKSEDKESLTEDASKTRKQPLSKKTKKSHIANEVEENDSIFVKLLKISGIILK
TGESQNQLAVDQIAFQKKLFQTLRRHPSYPKIIEEFVSGLESYIEDEDSFRNCLLSCERL QDEEASMGASYSKSLIKLLLGIDILQPAIIKTLFEKLPEYFFENKNSDEINIPRLIVSQL KWLDRVVDGKDLTTKIMQLISIAPENLQHDIITSLPEILGDSQHADVGKELSDLLIENTS LTVPILDVLSSLRLDPNFLLKVRQLVMDKLSSIRLEDLPVIIKFILHSVTAMDTLEVISE LREKLDLQHCVLPSRLQASQVKLKSKGRASSSGNQESSGQSCIILLFDVIKSAIRYEKTI SEAWIKAIENTASVSEHKVFDLVMLFIIYSTNTQTKKYIDRVLRNKIRSGCIQEQLLQST FSVHYLVLKDMCSSILSLAQSLLHSLDQSIISFGSLLYKYAFKFFDTYCQQEVVGALVTH ICSGNEAEVDTALDVLLELVVLNPSAMMMNAVFVKGILDYLDNISPQQIRKLFYVLSTLA FSKQNEASSHIQDDMHLVIRKQLSSTVFKYKLIGIIGAVTMAGIMAADRSESPSLTQERA NLSDEQCTQVTSLLQLVHSCSEQSPQASALYYDEFANLIQHEKLDPKALEWVGHTICNDF QDAFVVDSCVVPEGDFPFPVKALYGLEEYDTQDGIAINLLPLLFSQDFAKDGGPVTSQES GQKLVSPLCLAPYFRLLRLCVERQHNGNLEEIDGLLDCPIFLTDLEPGEKLESMSAKERS FMCSLIFLTLNWFREIVNAFCQETSPEMKGKVLTRLKHIVELQIILEKYLAVTPDYVPPL GNFDVETLDITPHTVTAISAKIRKKGKIERKQKTDGSKTSSSDTLSEEKNSECDPTPSHR GQLNKEFTGKEEKTSLLLHNSHAFFRELDIEVFSILHCGLVTKFILDTEMHTEATEVVQL GPPELLFLLEDLSQKLESMLTPPIARRVPFLKNKGSRNIGFSHLQQRSAQEIVHCVFQLL TPMCNHLENIHNYFQCLAAENHGVVDGPGVKVQEYHIMSSCYQRLLQIFHGLFAWSGFSQ PENQNLLYSALHVLSSRLKQGEHSQPLEELLSQSVHYLQNFHQSIPSFQCALYLIRLLMV ILEKSTASAQNKEKIASLARQFLCRVWPSGDKEKSNISNDQLHALLCIYLEHTESILKAI EEIAGVGVPELINSPKDASSSTFPTLTRHTFVVFFRVMMAELEKTVKKIEPGTAADSQQI HEEKLLYWNMAVRDFSILINLIKVFDSHPVLHVCLKYGRLFVEAFLKQCMPLLDFSFRKH REDVLSLLETFQLDTRLLHHLCGHSKIHQDTRLTQHVPLLKKTLELLVCRVKAMLTLNNC REAFWLGNLKNRDLQGEEIKSQNSQESTADESEDDMSSQASKSKATEDGEEDEVSAGEKE QDSDESYDDSD Click to Show/Hide
|
||||
| 3D-structure |
|
||||
| Function |
Required for maintenance of chromosomal stability. Promotes accurate and efficient pairing of homologs during meiosis. Involved in the repair of DNA double-strand breaks, both by homologous recombination and single-strand annealing. May participate in S phase and G2 phase checkpoint activation upon DNA damage. Plays a role in preventing breakage and loss of missegregating chromatin at the end of cell division, particularly after replication stress. Required for the targeting, or stabilization, of BLM to non-centromeric abnormal structures induced by replicative stress. Promotes BRCA2/FANCD1 loading onto damaged chromatin. May also be involved in B-cell immunoglobulin isotype switching.
Click to Show/Hide
|
||||
| Uniprot ID | |||||
| Ensembl ID | |||||
| HGNC ID | |||||
| Click to Show/Hide the Complete Species Lineage | |||||
Type(s) of Resistant Mechanism of This Molecule
Drug Resistance Data Categorized by Drug
Approved Drug(s)
1 drug(s) in total
| Drug Resistance Data Categorized by Their Corresponding Mechanisms | ||||
|
|
||||
| Disease Class: Breast cancer [ICD-11: 2C60.3] | [1] | |||
| Resistant Disease | Breast cancer [ICD-11: 2C60.3] | |||
| Resistant Drug | Epirubicin | |||
| Molecule Alteration | Missense mutation | p.G56V |
||
| Experimental Note | Identified from the Human Clinical Data | |||
| Cell Pathway Regulation | ATF2/ATF3/ATF4 signaling pathway | Inhibition | hsa04915 | |
| In Vitro Model | Plasma | Blood | Homo sapiens (Human) | N.A. |
| Experiment for Molecule Alteration |
Circulating-free DNA assay; Whole exome sequencing assay | |||
| Mechanism Description | Quantification of allele fractions in plasma identified increased representation of mutant alleles in association with emergence of therapy resistance. | |||
Disease- and Tissue-specific Abundances of This Molecule
ICD Disease Classification 02

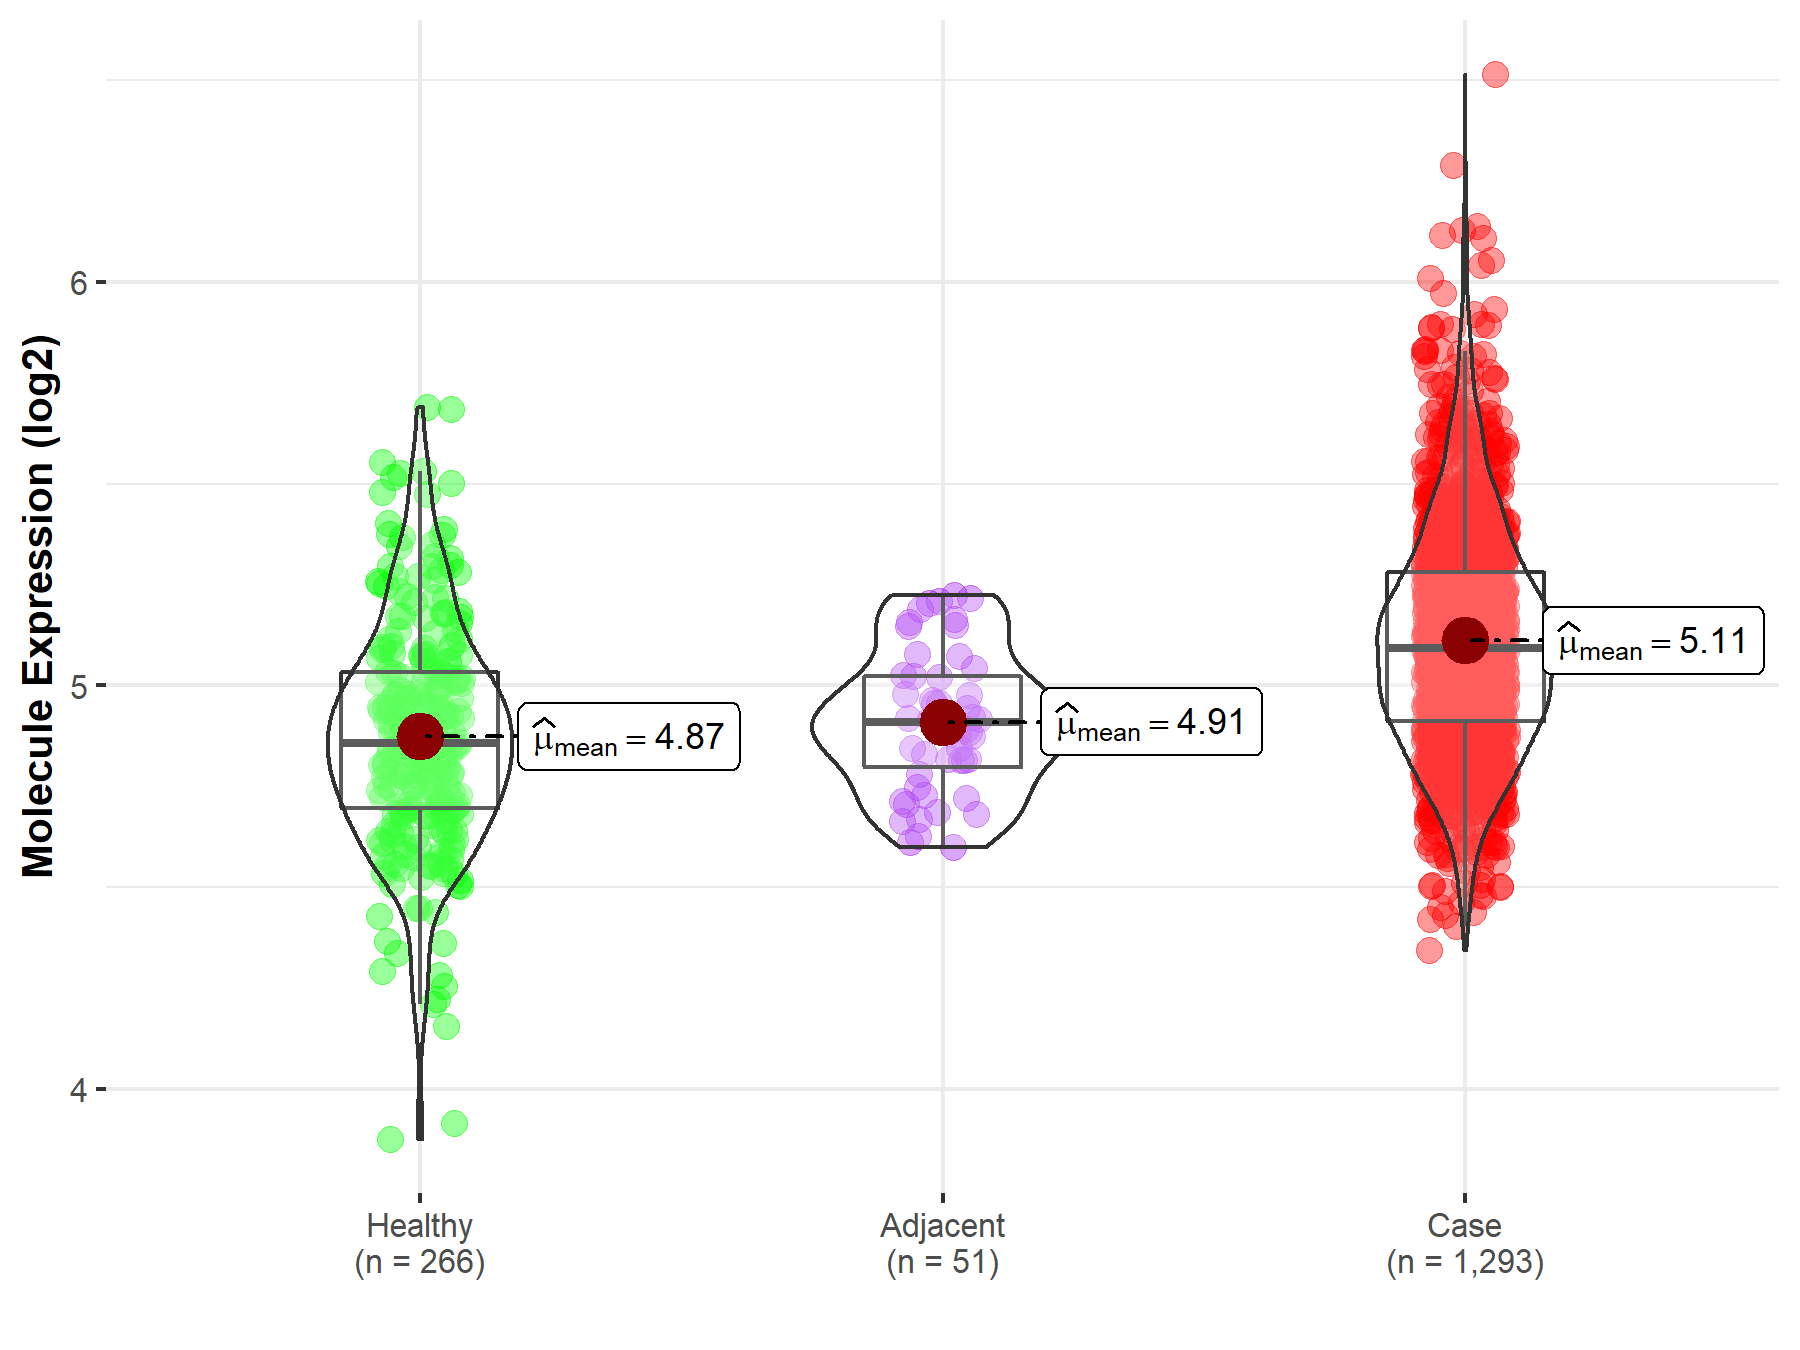
| Differential expression of molecule in resistant diseases | ||
| The Studied Tissue | Breast tissue | |
| The Specified Disease | Breast cancer | |
| The Expression Level of Disease Section Compare with the Healthy Individual Tissue | p-value: 9.08E-30; Fold-change: 2.36E-01; Z-score: 8.28E-01 | |
| The Expression Level of Disease Section Compare with the Adjacent Tissue | p-value: 1.03E-10; Fold-change: 1.85E-01; Z-score: 1.05E+00 | |
|
Molecule expression in the normal tissue adjacent to the diseased tissue of patients
Molecule expression in the diseased tissue of patients
Molecule expression in the normal tissue of healthy individuals
|
||
| Disease-specific Molecule Abundances |

|
Click to View the Clearer Original Diagram |
References
If you find any error in data or bug in web service, please kindly report it to Dr. Sun and Dr. Yu.
