Molecule Information
General Information of the Molecule (ID: Mol00328)
| Name |
DNA (cytosine-5)-methyltransferase 3A (DNMT3A)
,Homo sapiens
|
||||
|---|---|---|---|---|---|
| Synonyms |
Dnmt3a; Cysteine methyltransferase DNMT3A; DNA methyltransferase HsaIIIA; DNA MTase HsaIIIA; M.HsaIIIA
Click to Show/Hide
|
||||
| Molecule Type |
Protein
|
||||
| Gene Name |
DNMT3A
|
||||
| Gene ID | |||||
| Location |
chr2:25227855-25342590[-]
|
||||
| Sequence |
MPAMPSSGPGDTSSSAAEREEDRKDGEEQEEPRGKEERQEPSTTARKVGRPGRKRKHPPV
ESGDTPKDPAVISKSPSMAQDSGASELLPNGDLEKRSEPQPEEGSPAGGQKGGAPAEGEG AAETLPEASRAVENGCCTPKEGRGAPAEAGKEQKETNIESMKMEGSRGRLRGGLGWESSL RQRPMPRLTFQAGDPYYISKRKRDEWLARWKREAEKKAKVIAGMNAVEENQGPGESQKVE EASPPAVQQPTDPASPTVATTPEPVGSDAGDKNATKAGDDEPEYEDGRGFGIGELVWGKL RGFSWWPGRIVSWWMTGRSRAAEGTRWVMWFGDGKFSVVCVEKLMPLSSFCSAFHQATYN KQPMYRKAIYEVLQVASSRAGKLFPVCHDSDESDTAKAVEVQNKPMIEWALGGFQPSGPK GLEPPEEEKNPYKEVYTDMWVEPEAAAYAPPPPAKKPRKSTAEKPKVKEIIDERTRERLV YEVRQKCRNIEDICISCGSLNVTLEHPLFVGGMCQNCKNCFLECAYQYDDDGYQSYCTIC CGGREVLMCGNNNCCRCFCVECVDLLVGPGAAQAAIKEDPWNCYMCGHKGTYGLLRRRED WPSRLQMFFANNHDQEFDPPKVYPPVPAEKRKPIRVLSLFDGIATGLLVLKDLGIQVDRY IASEVCEDSITVGMVRHQGKIMYVGDVRSVTQKHIQEWGPFDLVIGGSPCNDLSIVNPAR KGLYEGTGRLFFEFYRLLHDARPKEGDDRPFFWLFENVVAMGVSDKRDISRFLESNPVMI DAKEVSAAHRARYFWGNLPGMNRPLASTVNDKLELQECLEHGRIAKFSKVRTITTRSNSI KQGKDQHFPVFMNEKEDILWCTEMERVFGFPVHYTDVSNMSRLARQRLLGRSWSVPVIRH LFAPLKEYFACV Click to Show/Hide
|
||||
| 3D-structure |
|
||||
| Function |
Required for genome-wide de novo methylation and is essential for the establishment of DNA methylation patterns during development. DNA methylation is coordinated with methylation of histones. It modifies DNA in a non-processive manner and also methylates non-CpG sites. May preferentially methylate DNA linker between 2 nucleosomal cores and is inhibited by histone H1. Plays a role in paternal and maternal imprinting. Required for methylation of most imprinted loci in germ cells. Acts as a transcriptional corepressor for ZBTB18. Recruited to trimethylated 'Lys-36' of histone H3 (H3K36me3) sites. Can actively repress transcription through the recruitment of HDAC activity. Also has weak auto-methylation activity on Cys-710 in absence of DNA.
Click to Show/Hide
|
||||
| Uniprot ID | |||||
| Ensembl ID | |||||
| HGNC ID | |||||
| Click to Show/Hide the Complete Species Lineage | |||||
Type(s) of Resistant Mechanism of This Molecule
Drug Resistance Data Categorized by Drug
Approved Drug(s)
6 drug(s) in total
| Drug Sensitivity Data Categorized by Their Corresponding Mechanisms | ||||
|
|
||||
| Disease Class: Ovarian cancer [ICD-11: 2C73.0] | [1] | |||
| Sensitive Disease | Ovarian cancer [ICD-11: 2C73.0] | |||
| Sensitive Drug | Cisplatin | |||
| Molecule Alteration | Expression | Down-regulation |
||
| Experimental Note | Revealed Based on the Cell Line Data | |||
| Cell Pathway Regulation | Cell apoptosis | Activation | hsa04210 | |
| Cell viability | Inhibition | hsa05200 | ||
| In Vitro Model | SkOV3 cells | Ovary | Homo sapiens (Human) | CVCL_0532 |
| A2780 cells | Ovary | Homo sapiens (Human) | CVCL_0134 | |
| A2780CP cells | Ovary | Homo sapiens (Human) | CVCL_0135 | |
| HIOSE-80 cells | Ovary | Homo sapiens (Human) | CVCL_E274 | |
| OV119 cells | Ovary | Homo sapiens (Human) | N.A. | |
| In Vivo Model | Nude mouse xenograft model | Mus musculus | ||
| Experiment for Molecule Alteration |
Western blot analysis | |||
| Experiment for Drug Resistance |
MTT assay; Flow cytometry assay | |||
| Mechanism Description | miR-200b- and miR-200c-mediated downregulation of DNMTs may improve chemotherapeutic efficacy by increasing the sensitivity of cancer cells. | |||
| Drug Sensitivity Data Categorized by Their Corresponding Mechanisms | ||||
|
|
||||
| Disease Class: Chronic myelogenous Ph(+) leukemia [ICD-11: 2A20.1] | [2] | |||
| Sensitive Disease | Chronic myelogenous Ph(+) leukemia [ICD-11: 2A20.1] | |||
| Sensitive Drug | Dasatinib | |||
| Molecule Alteration | Expression | Down-regulation |
||
| Experimental Note | Identified from the Human Clinical Data | |||
| In Vitro Model | Bcr/Abl-expressing k562 cells | Blood | Homo sapiens (Human) | CVCL_0004 |
| K562DR cells | Blood | Homo sapiens (Human) | CVCL_4V59 | |
| K562NR cells | Blood | Homo sapiens (Human) | CVCL_4V63 | |
| In Vivo Model | BALB/c nude mouse xenograft model | Mus musculus | ||
| Experiment for Molecule Alteration |
Western blot analysis | |||
| Experiment for Drug Resistance |
MTT assay | |||
| Mechanism Description | Forced expression of miR-217 inhibited expression of DNMT3A through a miR-217-binding site within the 3'-untranslated region of DNMT3A and sensitized these cells to growth inhibition mediated by the TkI. long-term exposure of CML k562 cells to ABL TkI such as dasatinib and nilotinib decreased the levels of miR-217 and increased the levels of DNMT1 and DNMT3A, as well as resulting in acquisition of TkI resistance. | |||
| Drug Resistance Data Categorized by Their Corresponding Mechanisms | |||||||||||||
|
|
|||||||||||||
| Disease Class: Acute myeloid leukemia [ICD-11: 2A60.0] | [3] | ||||||||||||
| Resistant Disease | Acute myeloid leukemia [ICD-11: 2A60.0] | ||||||||||||
| Resistant Drug | Daunorubicin | ||||||||||||
| Molecule Alteration | Missense mutation | p.R882H |
|||||||||||
| Wild Type Structure | Method: X-ray diffraction | Resolution: 2.40 Å | |||||||||||
| Mutant Type Structure | Method: X-ray diffraction | Resolution: 2.44 Å | |||||||||||
| Download The Information of Sequence | Download The Structure File | ||||||||||||
-
A
A
E
E
630
|
K
K
R
R
K
K
P
P
I
I
R
R
V
V
L
L
S
S
L
L
640
|
F
F
D
D
G
G
I
I
A
A
T
T
G
G
L
L
L
L
V
V
650
|
L
L
K
K
D
D
L
L
G
G
I
I
Q
Q
V
V
D
D
R
R
660
|
Y
Y
I
I
A
A
S
S
E
E
V
V
C
C
E
E
D
D
S
S
670
|
I
I
T
T
V
V
G
G
M
M
V
V
R
R
H
H
Q
Q
G
G
680
|
K
K
I
I
M
M
Y
Y
V
V
G
G
D
D
V
V
R
R
S
S
690
|
V
V
T
T
Q
Q
K
K
H
H
I
I
Q
Q
E
E
W
W
G
G
700
|
P
P
F
F
D
D
L
L
V
V
I
I
G
G
G
G
S
S
P
P
710
|
C
C
N
N
D
D
L
L
S
S
I
I
V
V
N
N
P
P
A
A
720
|
R
R
K
K
G
G
L
L
Y
Y
E
E
G
G
T
T
G
G
R
R
730
|
L
L
F
F
F
F
E
E
F
F
Y
Y
R
R
L
L
L
L
H
H
740
|
D
D
A
A
R
R
P
P
K
K
E
E
G
G
D
D
D
D
R
R
750
|
P
P
F
F
F
F
W
W
L
L
F
F
E
E
N
N
V
V
V
V
760
|
A
A
M
M
G
G
V
V
S
S
D
D
K
K
R
R
D
D
I
I
770
|
S
S
R
R
F
F
L
L
E
E
S
S
N
N
P
P
V
V
M
M
780
|
I
I
D
D
A
A
K
K
E
E
V
V
S
S
A
A
A
A
H
H
790
|
R
R
A
A
R
R
Y
Y
F
F
W
W
G
G
N
N
L
L
P
P
800
|
G
G
M
M
N
N
R
R
P
P
L
L
A
A
S
S
T
T
V
V
810
|
N
N
D
D
K
K
L
L
E
E
L
L
Q
Q
E
E
C
C
L
L
820
|
E
E
H
H
G
G
R
R
I
I
A
A
K
K
F
F
S
S
K
K
830
|
V
V
R
R
T
T
I
I
T
T
T
T
R
R
S
S
N
N
S
S
840
|
I
I
K
K
Q
Q
G
G
K
K
D
D
Q
Q
H
H
F
F
P
P
850
|
V
V
F
F
M
M
N
N
E
E
K
K
E
E
D
D
I
I
L
L
860
|
W
W
C
C
T
T
E
E
M
M
E
E
R
R
V
V
F
F
G
G
870
|
F
F
P
P
V
V
H
H
Y
Y
T
T
D
D
V
V
S
S
N
N
880
|
M
M
S
S
R
H
L
L
A
A
R
R
Q
Q
R
R
L
L
L
L
890
|
G
G
R
R
S
S
W
W
S
S
V
V
P
P
V
V
I
I
R
R
900
|
H
H
L
L
F
F
A
A
P
P
L
L
K
K
E
E
Y
Y
F
F
910
|
A
A
C
C
V
V
|
|||||||||||||
| Experimental Note | Identified from the Human Clinical Data | ||||||||||||
| Cell Pathway Regulation | ADAM9/EGFR signaling pathway | Inhibition | hsa01521 | ||||||||||
| AKT signaling pathway | Inhibition | hsa04151 | |||||||||||
| Experiment for Molecule Alteration |
Next-generation sequencing assay | ||||||||||||
| Mechanism Description | DNMT3A mutations are most common in AML. DNMT3A mutant AML has been linked to anthracycline resistance and poor prognosis in some studies. Many of these mutations occur in genes with established roles in the regulation and maintenance of DNA methylation and/or chromatin modifications in hematopoietic stem/progenitor cells. | ||||||||||||
| Drug Resistance Data Categorized by Their Corresponding Mechanisms | ||||
|
|
||||
| Disease Class: Mantle cell lymphoma [ICD-11: 2A85.0] | [4] | |||
| Metabolic Type | Mitochondrial metabolism | |||
| Resistant Disease | Mantle cell lymphoma [ICD-11: 2A85.0] | |||
| Resistant Drug | Ibrutinib | |||
| Molecule Alteration | Expression | Up-regulation |
||
| Experimental Note | Revealed Based on the Cell Line Data | |||
| In Vitro Model | Mino cells | Peripheral blood | Homo sapiens (Human) | CVCL_UW35 |
| Experiment for Molecule Alteration |
qRT-PCR; Western blot analysis | |||
| Experiment for Drug Resistance |
IC50 assay | |||
| Mechanism Description | We provide evidence that DNMT3A contributes to ibrutinib resistance in MCL by increasing mitochondrial biogenesis and OXPHOS. Recent clinical studies demonstrated the potential of BTKis as a first-line treatment option for MCL. | |||
| Disease Class: Mantle cell lymphoma [ICD-11: 2A85.0] | [4] | |||
| Metabolic Type | Mitochondrial metabolism | |||
| Resistant Disease | Mantle cell lymphoma [ICD-11: 2A85.0] | |||
| Resistant Drug | Ibrutinib | |||
| Molecule Alteration | Expression | Up-regulation |
||
| Experimental Note | Revealed Based on the Cell Line Data | |||
| In Vitro Model | Rec-1 cells | Lymph | Homo sapiens (Human) | CVCL_1884 |
| Experiment for Molecule Alteration |
qRT-PCR; Western blot analysis | |||
| Experiment for Drug Resistance |
IC50 assay | |||
| Mechanism Description | We provide evidence that DNMT4A contributes to ibrutinib resistance in MCL by increasing mitochondrial biogenesis and OXPHOS. Recent clinical studies demonstrated the potential of BTKis as a first-line treatment option for MCL. | |||
| Disease Class: Mantle cell lymphoma [ICD-11: 2A85.0] | [4] | |||
| Metabolic Type | Mitochondrial metabolism | |||
| Resistant Disease | Mantle cell lymphoma [ICD-11: 2A85.0] | |||
| Resistant Drug | Ibrutinib | |||
| Molecule Alteration | Expression | Up-regulation |
||
| Experimental Note | Revealed Based on the Cell Line Data | |||
| In Vitro Model | Jeko-1 cells | Blood | Homo sapiens (Human) | CVCL_1865 |
| Experiment for Molecule Alteration |
qRT-PCR; Western blot analysis | |||
| Experiment for Drug Resistance |
IC50 assay | |||
| Mechanism Description | We provide evidence that DNMT5A contributes to ibrutinib resistance in MCL by increasing mitochondrial biogenesis and OXPHOS. Recent clinical studies demonstrated the potential of BTKis as a first-line treatment option for MCL. | |||
| Disease Class: Mantle cell lymphoma [ICD-11: 2A85.0] | [4] | |||
| Metabolic Type | Mitochondrial metabolism | |||
| Resistant Disease | Mantle cell lymphoma [ICD-11: 2A85.0] | |||
| Resistant Drug | Ibrutinib | |||
| Molecule Alteration | Expression | Up-regulation |
||
| Experimental Note | Revealed Based on the Cell Line Data | |||
| In Vitro Model | Z138 cells | Peripheral blood | Homo sapiens (Human) | CVCL_B077 |
| Experiment for Molecule Alteration |
qRT-PCR; Western blot analysis | |||
| Experiment for Drug Resistance |
IC50 assay | |||
| Mechanism Description | We provide evidence that DNMT6A contributes to ibrutinib resistance in MCL by increasing mitochondrial biogenesis and OXPHOS. Recent clinical studies demonstrated the potential of BTKis as a first-line treatment option for MCL. | |||
| Disease Class: Mantle cell lymphoma [ICD-11: 2A85.0] | [4] | |||
| Metabolic Type | Mitochondrial metabolism | |||
| Resistant Disease | Mantle cell lymphoma [ICD-11: 2A85.0] | |||
| Resistant Drug | Ibrutinib | |||
| Molecule Alteration | Expression | Up-regulation |
||
| Experimental Note | Revealed Based on the Cell Line Data | |||
| In Vivo Model | Mouse, with tumor cells | Mice | ||
| Experiment for Molecule Alteration |
qRT-PCR; Western blot analysis | |||
| Experiment for Drug Resistance |
Tumor volume assay | |||
| Mechanism Description | We provide evidence that DNMT7A contributes to ibrutinib resistance in MCL by increasing mitochondrial biogenesis and OXPHOS. Recent clinical studies demonstrated the potential of BTKis as a first-line treatment option for MCL. | |||
| Drug Sensitivity Data Categorized by Their Corresponding Mechanisms | |||||||||||||
|
|
|||||||||||||
| Disease Class: Acute myeloid leukemia [ICD-11: 2A60.0] | [5] | ||||||||||||
| Sensitive Disease | Acute myeloid leukemia [ICD-11: 2A60.0] | ||||||||||||
| Sensitive Drug | Idarubicin | ||||||||||||
| Molecule Alteration | Missense mutation | p.R882H (c.2645G>A) |
|||||||||||
| Wild Type Structure | Method: X-ray diffraction | Resolution: 2.40 Å | |||||||||||
| Mutant Type Structure | Method: X-ray diffraction | Resolution: 2.44 Å | |||||||||||
| Download The Information of Sequence | Download The Structure File | ||||||||||||
-
A
A
E
E
630
|
K
K
R
R
K
K
P
P
I
I
R
R
V
V
L
L
S
S
L
L
640
|
F
F
D
D
G
G
I
I
A
A
T
T
G
G
L
L
L
L
V
V
650
|
L
L
K
K
D
D
L
L
G
G
I
I
Q
Q
V
V
D
D
R
R
660
|
Y
Y
I
I
A
A
S
S
E
E
V
V
C
C
E
E
D
D
S
S
670
|
I
I
T
T
V
V
G
G
M
M
V
V
R
R
H
H
Q
Q
G
G
680
|
K
K
I
I
M
M
Y
Y
V
V
G
G
D
D
V
V
R
R
S
S
690
|
V
V
T
T
Q
Q
K
K
H
H
I
I
Q
Q
E
E
W
W
G
G
700
|
P
P
F
F
D
D
L
L
V
V
I
I
G
G
G
G
S
S
P
P
710
|
C
C
N
N
D
D
L
L
S
S
I
I
V
V
N
N
P
P
A
A
720
|
R
R
K
K
G
G
L
L
Y
Y
E
E
G
G
T
T
G
G
R
R
730
|
L
L
F
F
F
F
E
E
F
F
Y
Y
R
R
L
L
L
L
H
H
740
|
D
D
A
A
R
R
P
P
K
K
E
E
G
G
D
D
D
D
R
R
750
|
P
P
F
F
F
F
W
W
L
L
F
F
E
E
N
N
V
V
V
V
760
|
A
A
M
M
G
G
V
V
S
S
D
D
K
K
R
R
D
D
I
I
770
|
S
S
R
R
F
F
L
L
E
E
S
S
N
N
P
P
V
V
M
M
780
|
I
I
D
D
A
A
K
K
E
E
V
V
S
S
A
A
A
A
H
H
790
|
R
R
A
A
R
R
Y
Y
F
F
W
W
G
G
N
N
L
L
P
P
800
|
G
G
M
M
N
N
R
R
P
P
L
L
A
A
S
S
T
T
V
V
810
|
N
N
D
D
K
K
L
L
E
E
L
L
Q
Q
E
E
C
C
L
L
820
|
E
E
H
H
G
G
R
R
I
I
A
A
K
K
F
F
S
S
K
K
830
|
V
V
R
R
T
T
I
I
T
T
T
T
R
R
S
S
N
N
S
S
840
|
I
I
K
K
Q
Q
G
G
K
K
D
D
Q
Q
H
H
F
F
P
P
850
|
V
V
F
F
M
M
N
N
E
E
K
K
E
E
D
D
I
I
L
L
860
|
W
W
C
C
T
T
E
E
M
M
E
E
R
R
V
V
F
F
G
G
870
|
F
F
P
P
V
V
H
H
Y
Y
T
T
D
D
V
V
S
S
N
N
880
|
M
M
S
S
R
H
L
L
A
A
R
R
Q
Q
R
R
L
L
L
L
890
|
G
G
R
R
S
S
W
W
S
S
V
V
P
P
V
V
I
I
R
R
900
|
H
H
L
L
F
F
A
A
P
P
L
L
K
K
E
E
Y
Y
F
F
910
|
A
A
C
C
V
V
|
|||||||||||||
| Experimental Note | Identified from the Human Clinical Data | ||||||||||||
| In Vitro Model | Bone marrow | N.A. | |||||||||||
| In Vivo Model | NOD/SCID mouse xenograft model | Mus musculus | |||||||||||
| Mechanism Description | The missense mutation p.R882H (c.2645G>A) in gene DNMT3A cause the sensitivity of Idarubicin by unusual activation of pro-survival pathway | ||||||||||||
| Drug Sensitivity Data Categorized by Their Corresponding Mechanisms | ||||
|
|
||||
| Disease Class: Chronic myelogenous Ph(+) leukemia [ICD-11: 2A20.1] | [2] | |||
| Sensitive Disease | Chronic myelogenous Ph(+) leukemia [ICD-11: 2A20.1] | |||
| Sensitive Drug | Nilotinib | |||
| Molecule Alteration | Expression | Down-regulation |
||
| Experimental Note | Identified from the Human Clinical Data | |||
| In Vitro Model | Bcr/Abl-expressing k562 cells | Blood | Homo sapiens (Human) | CVCL_0004 |
| K562DR cells | Blood | Homo sapiens (Human) | CVCL_4V59 | |
| K562NR cells | Blood | Homo sapiens (Human) | CVCL_4V63 | |
| In Vivo Model | BALB/c nude mouse xenograft model | Mus musculus | ||
| Experiment for Molecule Alteration |
Western blot analysis | |||
| Experiment for Drug Resistance |
MTT assay | |||
| Mechanism Description | Forced expression of miR-217 inhibited expression of DNMT3A through a miR-217-binding site within the 3'-untranslated region of DNMT3A and sensitized these cells to growth inhibition mediated by the TkI. long-term exposure of CML k562 cells to ABL TkI such as dasatinib and nilotinib decreased the levels of miR-217 and increased the levels of DNMT1 and DNMT3A, as well as resulting in acquisition of TkI resistance. | |||
Disease- and Tissue-specific Abundances of This Molecule
ICD Disease Classification 02

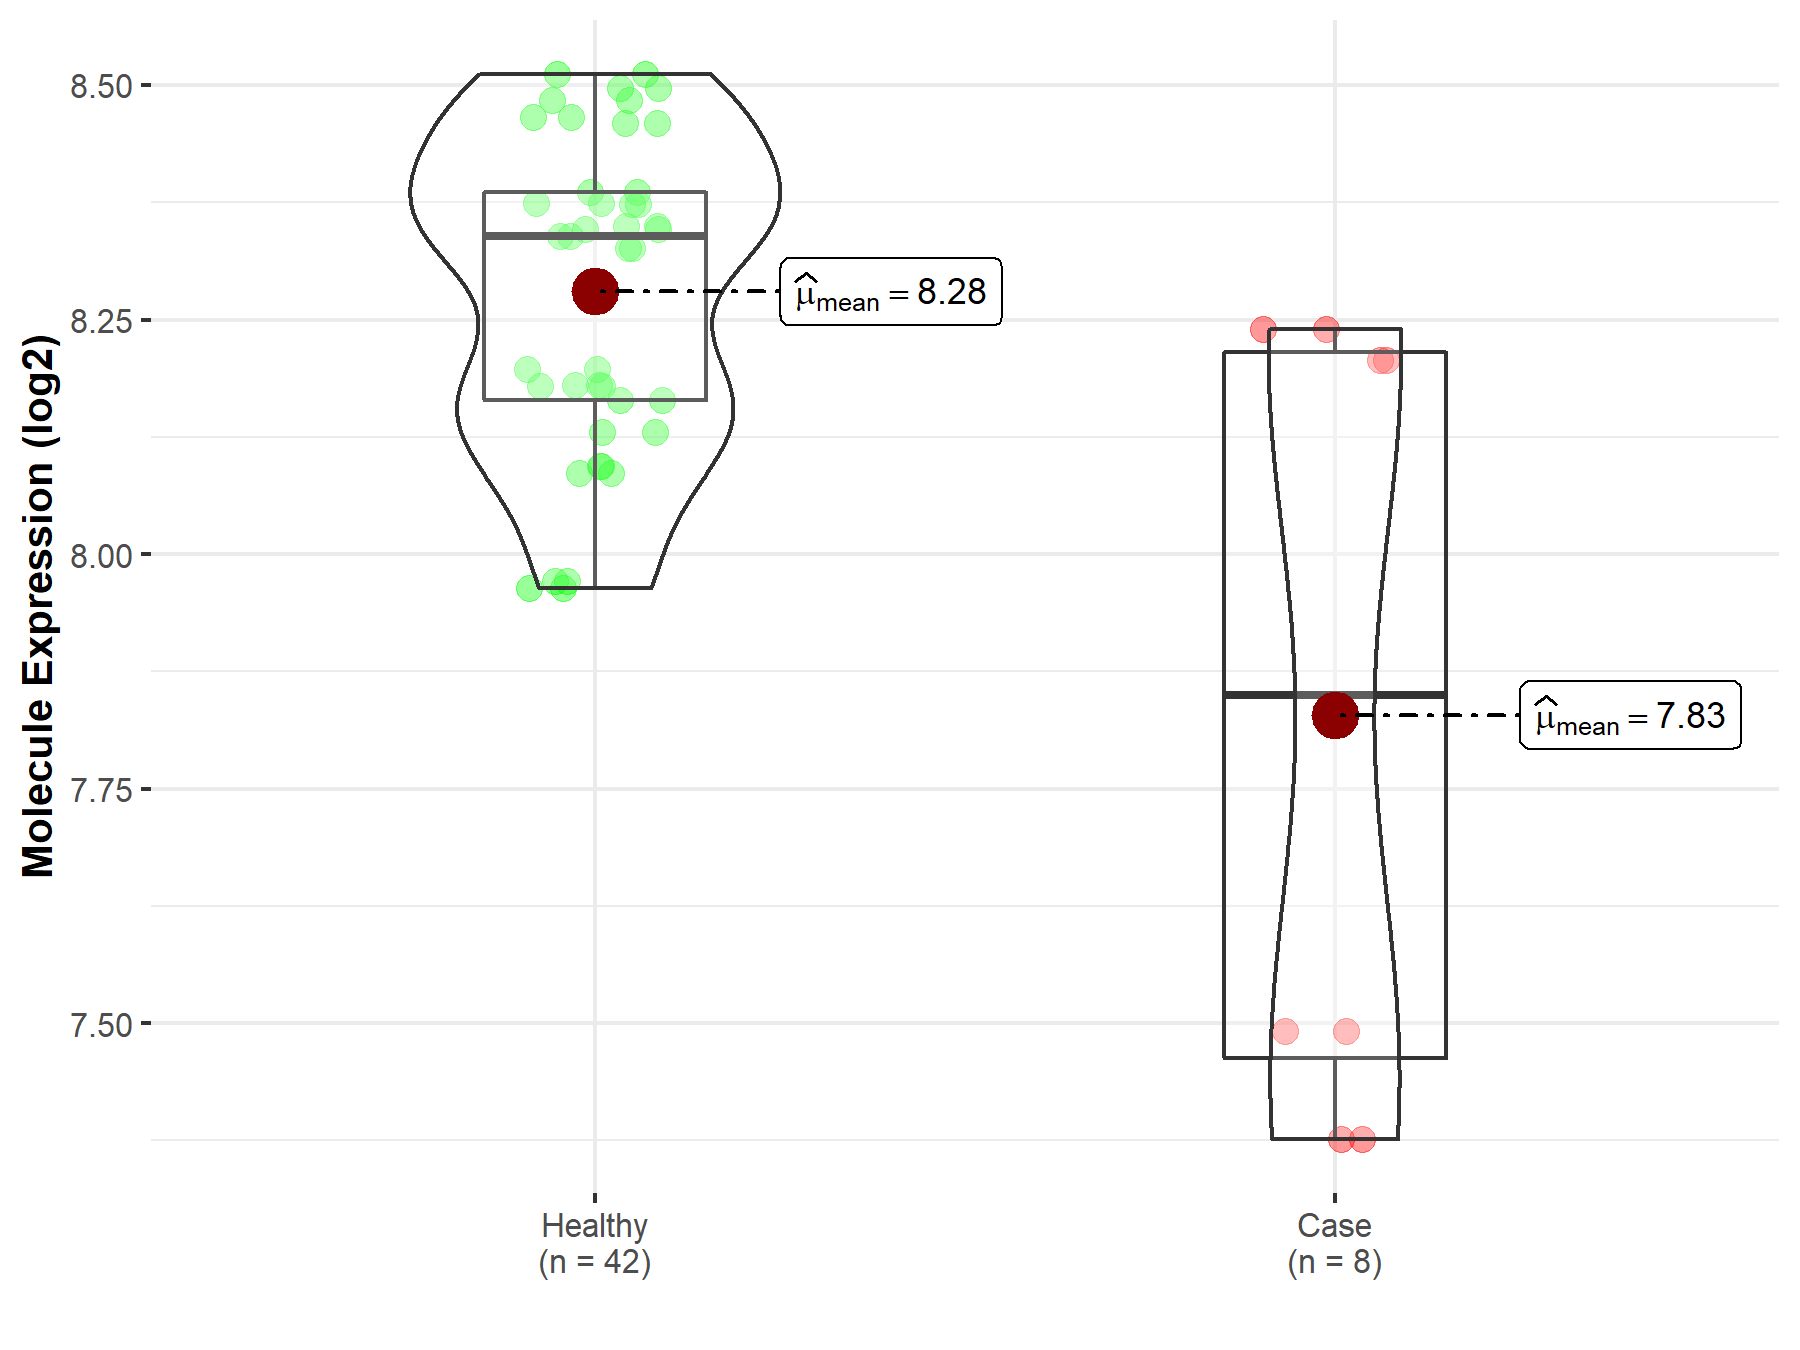
| Differential expression of molecule in resistant diseases | ||
| The Studied Tissue | Whole blood | |
| The Specified Disease | Myelofibrosis | |
| The Expression Level of Disease Section Compare with the Healthy Individual Tissue | p-value: 1.96E-02; Fold-change: -4.90E-01; Z-score: -2.90E+00 | |
|
Molecule expression in the diseased tissue of patients
Molecule expression in the normal tissue of healthy individuals
|
||
| Disease-specific Molecule Abundances |
|
Click to View the Clearer Original Diagram |
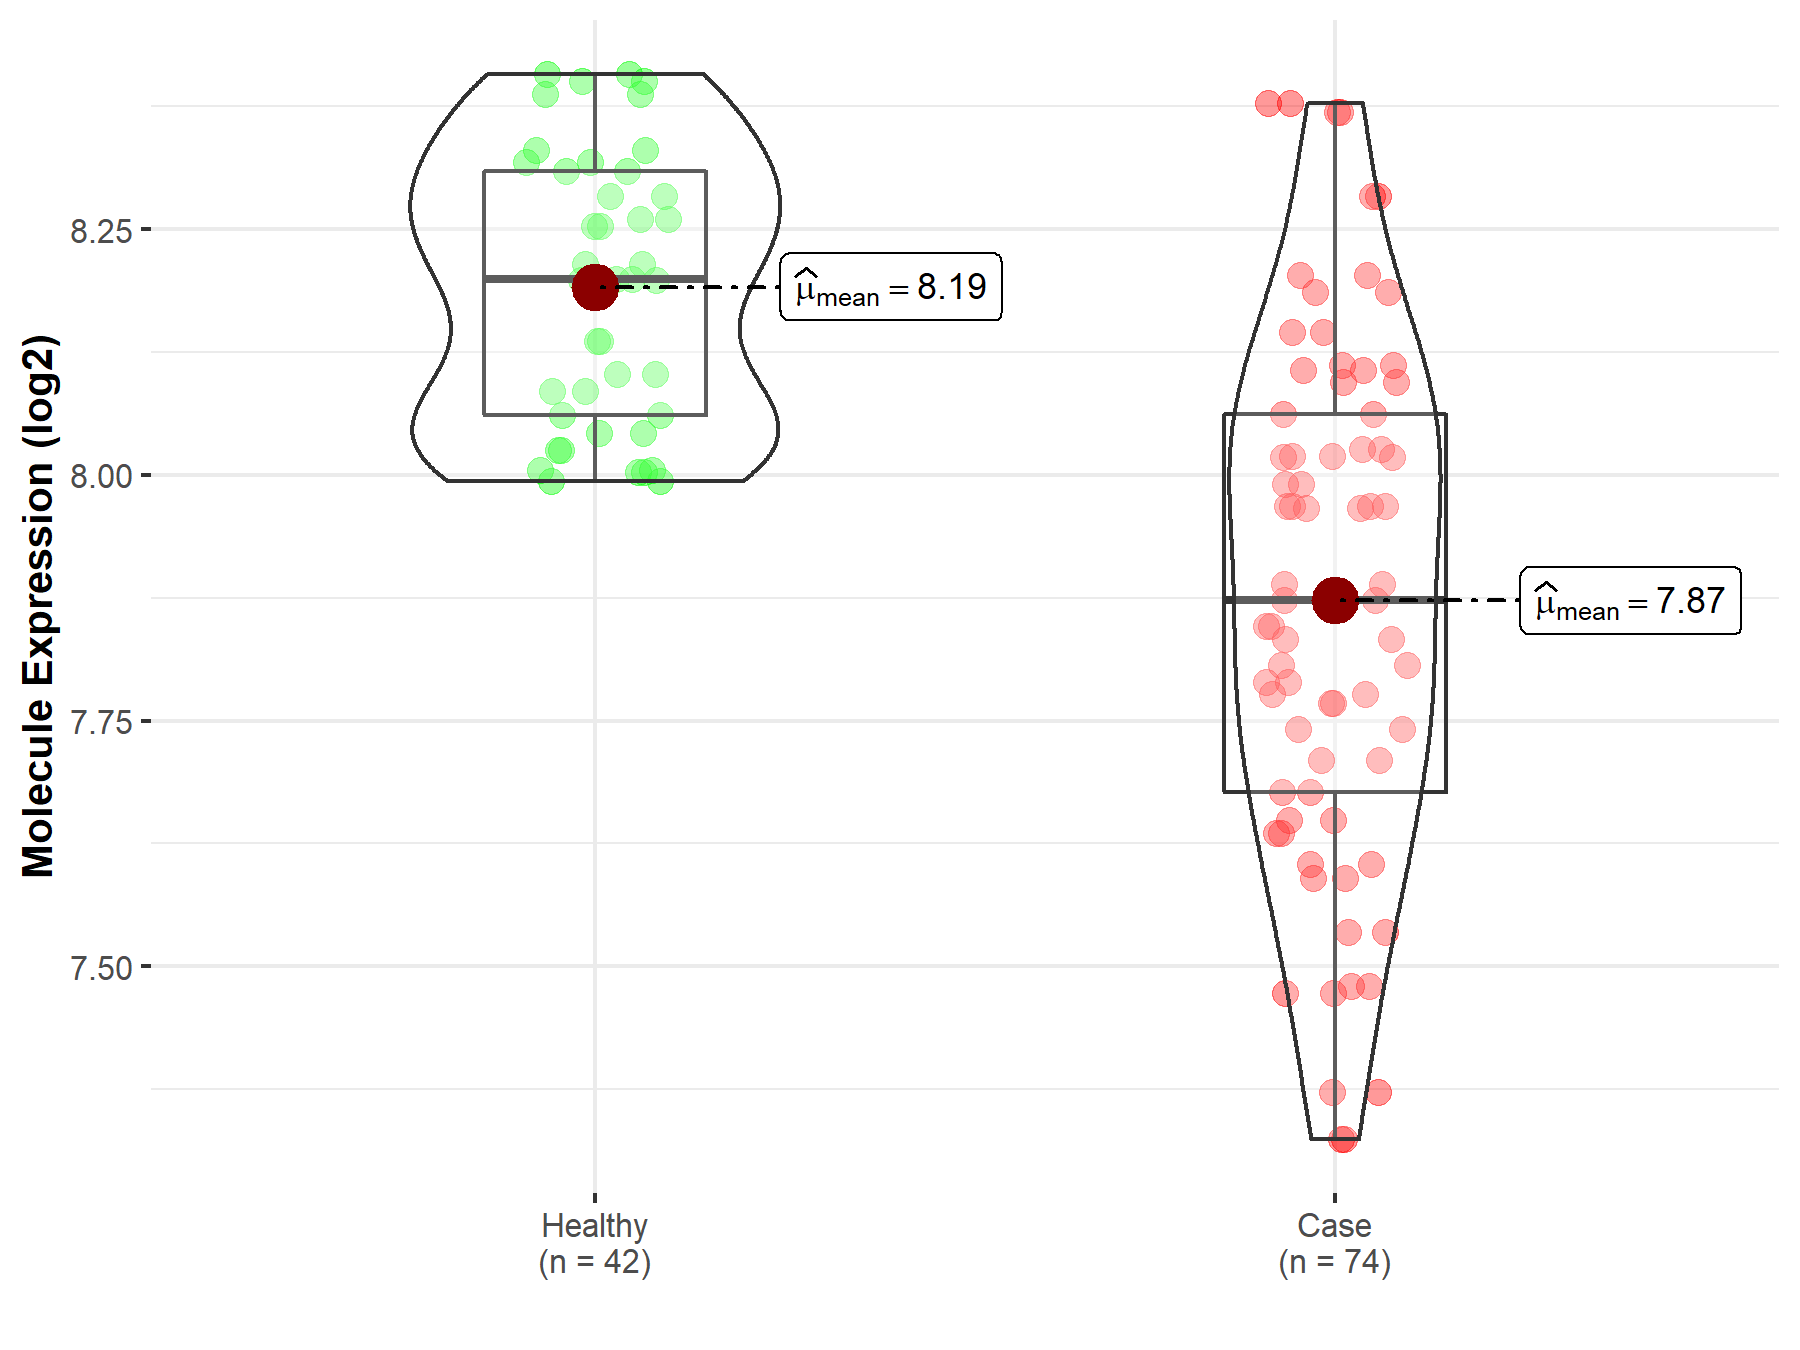
| The Studied Tissue | Whole blood | |
| The Specified Disease | Polycythemia vera | |
| The Expression Level of Disease Section Compare with the Healthy Individual Tissue | p-value: 1.09E-13; Fold-change: -3.27E-01; Z-score: -2.36E+00 | |
|
Molecule expression in the diseased tissue of patients
Molecule expression in the normal tissue of healthy individuals
|
||
| Disease-specific Molecule Abundances |
|
Click to View the Clearer Original Diagram |
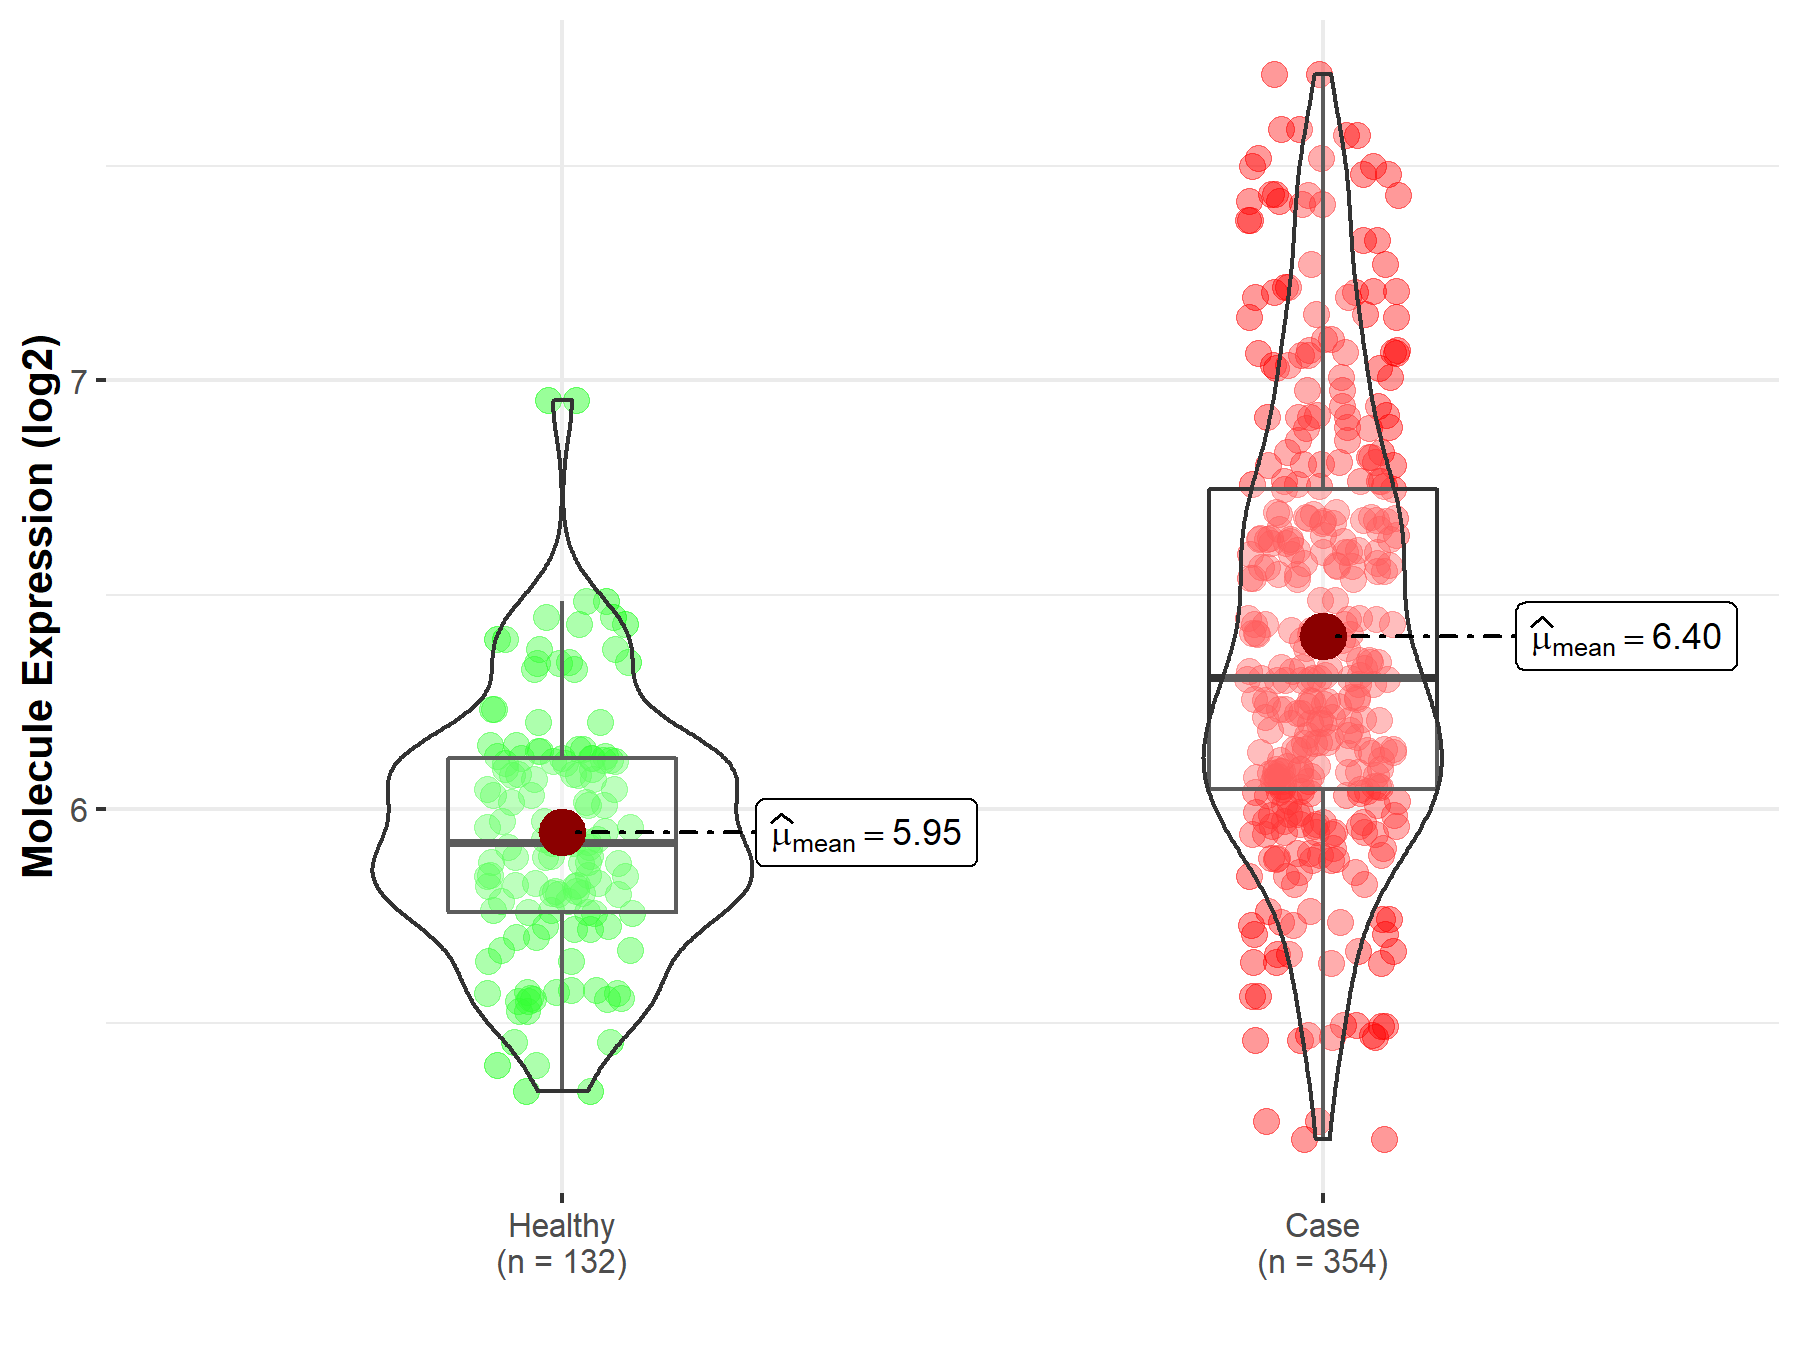
| Differential expression of molecule in resistant diseases | ||
| The Studied Tissue | Bone marrow | |
| The Specified Disease | Acute myeloid leukemia | |
| The Expression Level of Disease Section Compare with the Healthy Individual Tissue | p-value: 3.50E-29; Fold-change: 3.85E-01; Z-score: 1.30E+00 | |
|
Molecule expression in the diseased tissue of patients
Molecule expression in the normal tissue of healthy individuals
|
||
| Disease-specific Molecule Abundances |
|
Click to View the Clearer Original Diagram |
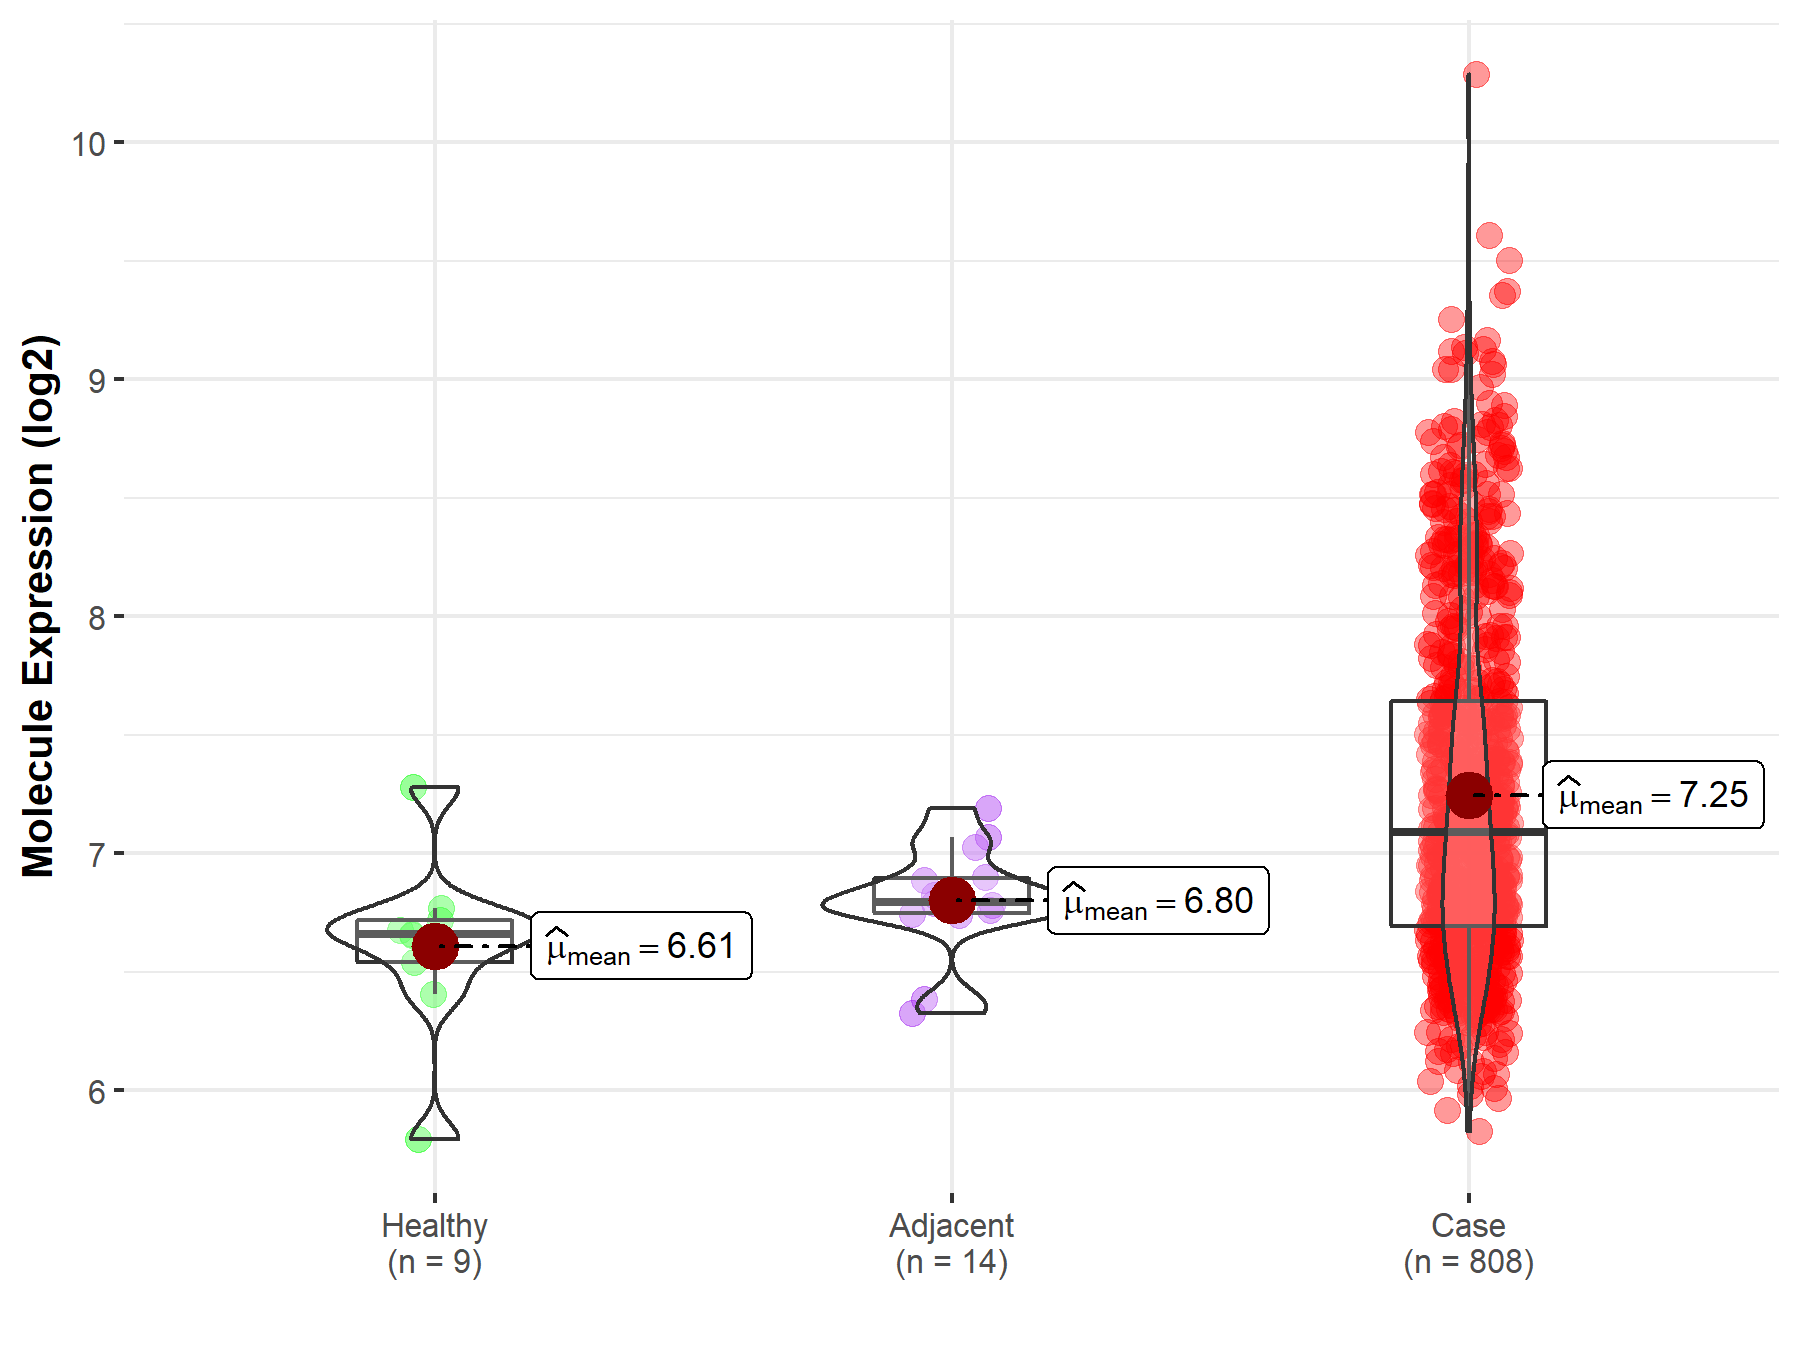
| Differential expression of molecule in resistant diseases | ||
| The Studied Tissue | Ovary | |
| The Specified Disease | Ovarian cancer | |
| The Expression Level of Disease Section Compare with the Healthy Individual Tissue | p-value: 1.06E-03; Fold-change: 4.32E-01; Z-score: 1.11E+00 | |
| The Expression Level of Disease Section Compare with the Adjacent Tissue | p-value: 3.39E-06; Fold-change: 2.94E-01; Z-score: 1.26E+00 | |
|
Molecule expression in the normal tissue adjacent to the diseased tissue of patients
Molecule expression in the diseased tissue of patients
Molecule expression in the normal tissue of healthy individuals
|
||
| Disease-specific Molecule Abundances |
|
Click to View the Clearer Original Diagram |
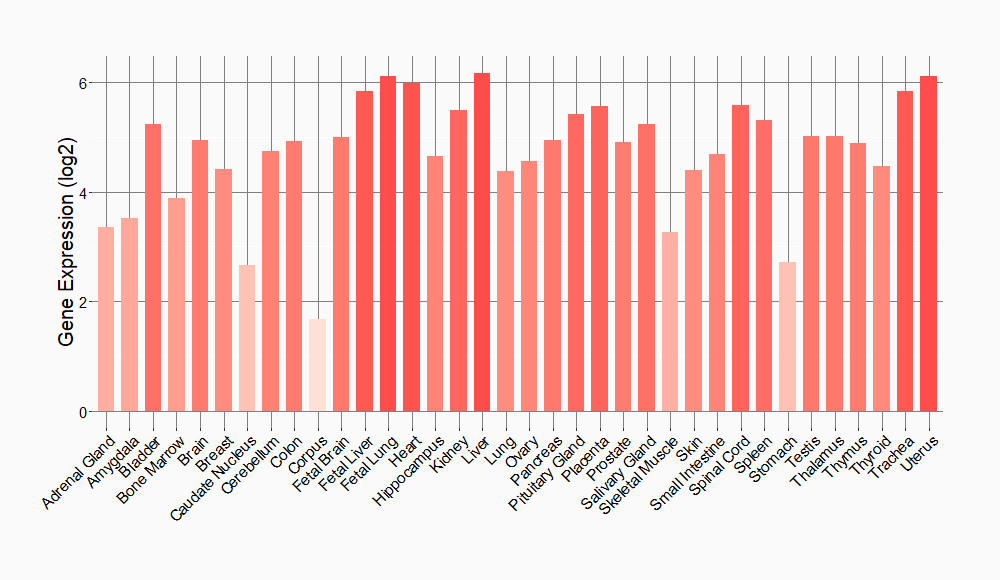
Tissue-specific Molecule Abundances in Healthy Individuals

|
||
References
If you find any error in data or bug in web service, please kindly report it to Dr. Sun and Dr. Yu.
