Molecule Information
General Information of the Molecule (ID: Mol00253)
| Name |
Endoplasmic reticulum chaperone BiP (HSPA5)
,Homo sapiens
|
||||
|---|---|---|---|---|---|
| Synonyms |
78 kDa glucose-regulated protein; GRP-78; Binding-immunoglobulin protein; BiP; Heat shock protein 70 family protein 5; HSP70 family protein 5; Heat shock protein family A member 5; Immunoglobulin heavy chain-binding protein; GRP78
Click to Show/Hide
|
||||
| Molecule Type |
Protein
|
||||
| Gene Name |
HSPA5
|
||||
| Gene ID | |||||
| Location |
chr9:125234853-125241382[-]
|
||||
| Sequence |
MKLSLVAAMLLLLSAARAEEEDKKEDVGTVVGIDLGTTYSCVGVFKNGRVEIIANDQGNR
ITPSYVAFTPEGERLIGDAAKNQLTSNPENTVFDAKRLIGRTWNDPSVQQDIKFLPFKVV EKKTKPYIQVDIGGGQTKTFAPEEISAMVLTKMKETAEAYLGKKVTHAVVTVPAYFNDAQ RQATKDAGTIAGLNVMRIINEPTAAAIAYGLDKREGEKNILVFDLGGGTFDVSLLTIDNG VFEVVATNGDTHLGGEDFDQRVMEHFIKLYKKKTGKDVRKDNRAVQKLRREVEKAKRALS SQHQARIEIESFYEGEDFSETLTRAKFEELNMDLFRSTMKPVQKVLEDSDLKKSDIDEIV LVGGSTRIPKIQQLVKEFFNGKEPSRGINPDEAVAYGAAVQAGVLSGDQDTGDLVLLDVC PLTLGIETVGGVMTKLIPRNTVVPTKKSQIFSTASDNQPTVTIKVYEGERPLTKDNHLLG TFDLTGIPPAPRGVPQIEVTFEIDVNGILRVTAEDKGTGNKNKITITNDQNRLTPEEIER MVNDAEKFAEEDKKLKERIDTRNELESYAYSLKNQIGDKEKLGGKLSSEDKETMEKAVEE KIEWLESHQDADIEDFKAKKKELEEIVQPIISKLYGSAGPPPTGEEDTAEKDEL Click to Show/Hide
|
||||
| 3D-structure |
|
||||
| Function |
Endoplasmic reticulum chaperone that plays a key role in protein folding and quality control in the endoplasmic reticulum lumen. Involved in the correct folding of proteins and degradation of misfolded proteins via its interaction with DNAJC10/ERdj5, probably to facilitate the release of DNAJC10/ERdj5 from its substrate. Acts as a key repressor of the ERN1/IRE1-mediated unfolded protein response (UPR). In the unstressed endoplasmic reticulum, recruited by DNAJB9/ERdj4 to the luminal region of ERN1/IRE1, leading to disrupt the dimerization of ERN1/IRE1, thereby inactivating ERN1/IRE1. Accumulation of misfolded protein in the endoplasmic reticulum causes release of HSPA5/BiP from ERN1/IRE1, allowing homodimerization and subsequent activation of ERN1/IRE1. Plays an auxiliary role in post-translational transport of small presecretory proteins across endoplasmic reticulum (ER). May function as an allosteric modulator for SEC61 channel-forming translocon complex, likely cooperating with SEC62 to enable the productive insertion of these precursors into SEC61 channel. Appears to specifically regulate translocation of precursors having inhibitory residues in their mature region that weaken channel gating. May also play a role in apoptosis and cell proliferation.
Click to Show/Hide
|
||||
| Uniprot ID | |||||
| Ensembl ID | |||||
| HGNC ID | |||||
| Click to Show/Hide the Complete Species Lineage | |||||
Type(s) of Resistant Mechanism of This Molecule
Drug Resistance Data Categorized by Drug
Clinical Trial Drug(s)
1 drug(s) in total
| Drug Resistance Data Categorized by Their Corresponding Mechanisms | ||||
|
|
||||
| Disease Class: Adult acute myeloid leukemia [ICD-11: 2A60.1] | [1] | |||
| Resistant Disease | Adult acute myeloid leukemia [ICD-11: 2A60.1] | |||
| Resistant Drug | Trichostatin A | |||
| Molecule Alteration | Expression | Up-regulation |
||
| Differential expression of the molecule in resistant disease | ||||
| Classification of Disease | Acute myeloid leukemia [ICD-11: 2A60] | |||
| The Specified Disease | Acute myelocytic leukemia | |||
| The Studied Tissue | Bone marrow | |||
| The Expression Level of Disease Section Compare with the Healthy Individual Tissue | p-value: 7.36E-14 Fold-change: 6.88E-02 Z-score: 7.87E+00 |
|||
| Experimental Note | Revealed Based on the Cell Line Data | |||
| Cell Pathway Regulation | Cell apoptosis | Inhibition | hsa04210 | |
| In Vitro Model | HL60 cells | Peripheral blood | Homo sapiens (Human) | CVCL_0002 |
| Experiment for Molecule Alteration |
Western blot analysis | |||
| Experiment for Drug Resistance |
Flow cytometry assay | |||
| Mechanism Description | GRP78 up-regulation is a major contributor to tumorigenesis and therapeutic resistance, miR-30d, miR-181a and miR-199a-5p regulate GRP78 and that their decreased expression in tumor cells results in increased GRP78 levels, which in turn promotes tumorigenesis and therapeutic resistance. | |||
| Disease Class: Bladder carcinoma [ICD-11: 2C94.1] | [1] | |||
| Resistant Disease | Bladder carcinoma [ICD-11: 2C94.1] | |||
| Resistant Drug | Trichostatin A | |||
| Molecule Alteration | Expression | Up-regulation |
||
| Differential expression of the molecule in resistant disease | ||||
| Classification of Disease | Bladder cancer [ICD-11: 2C94] | |||
| The Specified Disease | Bladder cancer | |||
| The Studied Tissue | Bladder tissue | |||
| The Expression Level of Disease Section Compare with the Healthy Individual Tissue | p-value: 9.58E-01 Fold-change: 6.66E-04 Z-score: 5.39E-02 |
|||
| Experimental Note | Revealed Based on the Cell Line Data | |||
| Cell Pathway Regulation | Cell apoptosis | Inhibition | hsa04210 | |
| In Vitro Model | J82 cells | Bladder | Homo sapiens (Human) | CVCL_0359 |
| UM-UC-3 cells | Bladder | Homo sapiens (Human) | CVCL_1783 | |
| Experiment for Molecule Alteration |
Western blot analysis | |||
| Experiment for Drug Resistance |
Flow cytometry assay | |||
| Mechanism Description | GRP78 up-regulation is a major contributor to tumorigenesis and therapeutic resistance, miR-30d, miR-181a and miR-199a-5p regulate GRP78 and that their decreased expression in tumor cells results in increased GRP78 levels, which in turn promotes tumorigenesis and therapeutic resistance. | |||
| Disease Class: Colon carcinoma [ICD-11: 2B90.2] | [1] | |||
| Resistant Disease | Colon carcinoma [ICD-11: 2B90.2] | |||
| Resistant Drug | Trichostatin A | |||
| Molecule Alteration | Expression | Up-regulation |
||
| Differential expression of the molecule in resistant disease | ||||
| Classification of Disease | Colon cancer [ICD-11: 2B90] | |||
| The Specified Disease | Colon cancer | |||
| The Studied Tissue | Colon tissue | |||
| The Expression Level of Disease Section Compare with the Healthy Individual Tissue | p-value: 2.94E-01 Fold-change: 5.33E-03 Z-score: 1.05E+00 |
|||
| Experimental Note | Revealed Based on the Cell Line Data | |||
| Cell Pathway Regulation | Cell apoptosis | Inhibition | hsa04210 | |
| In Vitro Model | HCT116 cells | Colon | Homo sapiens (Human) | CVCL_0291 |
| Experiment for Molecule Alteration |
Western blot analysis | |||
| Experiment for Drug Resistance |
Flow cytometry assay | |||
| Mechanism Description | GRP78 up-regulation is a major contributor to tumorigenesis and therapeutic resistance, miR-30d, miR-181a and miR-199a-5p regulate GRP78 and that their decreased expression in tumor cells results in increased GRP78 levels, which in turn promotes tumorigenesis and therapeutic resistance. | |||
| Disease Class: Gastric cancer [ICD-11: 2B72.1] | [1] | |||
| Resistant Disease | Gastric cancer [ICD-11: 2B72.1] | |||
| Resistant Drug | Trichostatin A | |||
| Molecule Alteration | Expression | Up-regulation |
||
| Differential expression of the molecule in resistant disease | ||||
| Classification of Disease | Gastric cancer [ICD-11: 2B72] | |||
| The Specified Disease | Gastric cancer | |||
| The Studied Tissue | Gastric tissue | |||
| The Expression Level of Disease Section Compare with the Healthy Individual Tissue | p-value: 5.07E-01 Fold-change: 4.51E-02 Z-score: 8.01E-01 |
|||
| Experimental Note | Revealed Based on the Cell Line Data | |||
| Cell Pathway Regulation | Cell apoptosis | Inhibition | hsa04210 | |
| In Vitro Model | BGC-823 cells | Gastric | Homo sapiens (Human) | CVCL_3360 |
| MGC-803 cells | Gastric | Homo sapiens (Human) | CVCL_5334 | |
| SGC7901 cells | Gastric | Homo sapiens (Human) | CVCL_0520 | |
| GES-1 cells | Gastric | Homo sapiens (Human) | CVCL_EQ22 | |
| MkN-45 cells | Gastric | Homo sapiens (Human) | CVCL_0434 | |
| Experiment for Molecule Alteration |
Western blot analysis | |||
| Experiment for Drug Resistance |
Flow cytometry assay | |||
| Mechanism Description | GRP78 up-regulation is a major contributor to tumorigenesis and therapeutic resistance, miR-30d, miR-181a and miR-199a-5p regulate GRP78 and that their decreased expression in tumor cells results in increased GRP78 levels, which in turn promotes tumorigenesis and therapeutic resistance. | |||
| Disease Class: Prostate cancer [ICD-11: 2C82.0] | [1] | |||
| Resistant Disease | Prostate cancer [ICD-11: 2C82.0] | |||
| Resistant Drug | Trichostatin A | |||
| Molecule Alteration | Expression | Up-regulation |
||
| Differential expression of the molecule in resistant disease | ||||
| Classification of Disease | Prostate cancer [ICD-11: 2C82] | |||
| The Specified Disease | Prostate cancer | |||
| The Studied Tissue | Prostate | |||
| The Expression Level of Disease Section Compare with the Healthy Individual Tissue | p-value: 3.92E-01 Fold-change: 1.27E-02 Z-score: 8.69E-01 |
|||
| Experimental Note | Revealed Based on the Cell Line Data | |||
| Cell Pathway Regulation | Cell apoptosis | Inhibition | hsa04210 | |
| In Vitro Model | C4-2B cells | Prostate | Homo sapiens (Human) | CVCL_4784 |
| Experiment for Molecule Alteration |
Western blot analysis | |||
| Experiment for Drug Resistance |
Flow cytometry assay | |||
| Mechanism Description | GRP78 up-regulation is a major contributor to tumorigenesis and therapeutic resistance, miR-30d, miR-181a and miR-199a-5p regulate GRP78 and that their decreased expression in tumor cells results in increased GRP78 levels, which in turn promotes tumorigenesis and therapeutic resistance. | |||
Approved Drug(s)
1 drug(s) in total
| Drug Resistance Data Categorized by Their Corresponding Mechanisms | ||||
|
|
||||
| Disease Class: Glioma [ICD-11: 2A00.1] | [2] | |||
| Resistant Disease | Glioma [ICD-11: 2A00.1] | |||
| Resistant Drug | Temozolomide | |||
| Molecule Alteration | Expression | Up-regulation |
||
| Differential expression of the molecule in resistant disease | ||||
| Classification of Disease | Brain cancer [ICD-11: 2A00] | |||
| The Specified Disease | Brain cancer | |||
| The Studied Tissue | Nervous tissue | |||
| The Expression Level of Disease Section Compare with the Healthy Individual Tissue | p-value: 2.68E-114 Fold-change: 1.16E-01 Z-score: 2.64E+01 |
|||
| Experimental Note | Identified from the Human Clinical Data | |||
| Cell Pathway Regulation | UPR signaling pathway | Activation | hsa0414) | |
| In Vitro Model | U87MG cells | Brain | Homo sapiens (Human) | CVCL_GP63 |
| In Vivo Model | BALB/c nu/nu athymic mice xenografts model | Mus musculus | ||
| Experiment for Molecule Alteration |
Northern blot analysis | |||
| Experiment for Drug Resistance |
Clonogenic assay | |||
| Mechanism Description | Transcripts for the ER chaperones GRP94 and GRP78 were upregulated in the U87MG and U87+EGFR gliomas, relative to normal mouse brain from healthy animals. Elevated levels of UPR transcription factors and ER chaperones correlated with poor patient prognosis; western blots of high grade gliomas and tissue microarray immunohistochemistry verified high expression of UPR players, especially GRP94, in high grade gliomas. Activation of the UPR signaling pathways is a prominent feature of glioma biology that leads to metabolic shifts and enhances chemoresistant features of gliomas. | |||
Investigative Drug(s)
1 drug(s) in total
| Drug Sensitivity Data Categorized by Their Corresponding Mechanisms | ||||
|
|
||||
| Disease Class: Type 2 diabetes mellitus [ICD-11: 5A11.0] | [3] | |||
| Sensitive Disease | Type 2 diabetes mellitus [ICD-11: 5A11.0] | |||
| Sensitive Drug | Apigenin | |||
| Molecule Alteration | Expression | Down-regulation |
||
| Experimental Note | Revealed Based on the Cell Line Data | |||
| Cell Pathway Regulation | ER stress signalling pathway | Regulation | N.A. | |
| In Vitro Model | HepG2 cells | Liver | Homo sapiens (Human) | CVCL_0027 |
| Experiment for Molecule Alteration |
Western blot assay | |||
| Experiment for Drug Resistance |
Glucose uptake assay | |||
| Mechanism Description | In the present study, we identified apigenin as an effective compound for ameliorating ER stress and insulin resistance. It attenuated ER stress-induced cell death and hepatic insulin resistance and improved abnormal glucose tolerance in a db/db diabetic model. The molecular mechanism of apigenin involved direct binding to beta-tubulin and improving tubulin stability, thereby recovering insulin resistance and developing diabetes. | |||
Disease- and Tissue-specific Abundances of This Molecule
ICD Disease Classification 02

| Differential expression of molecule in resistant diseases | ||
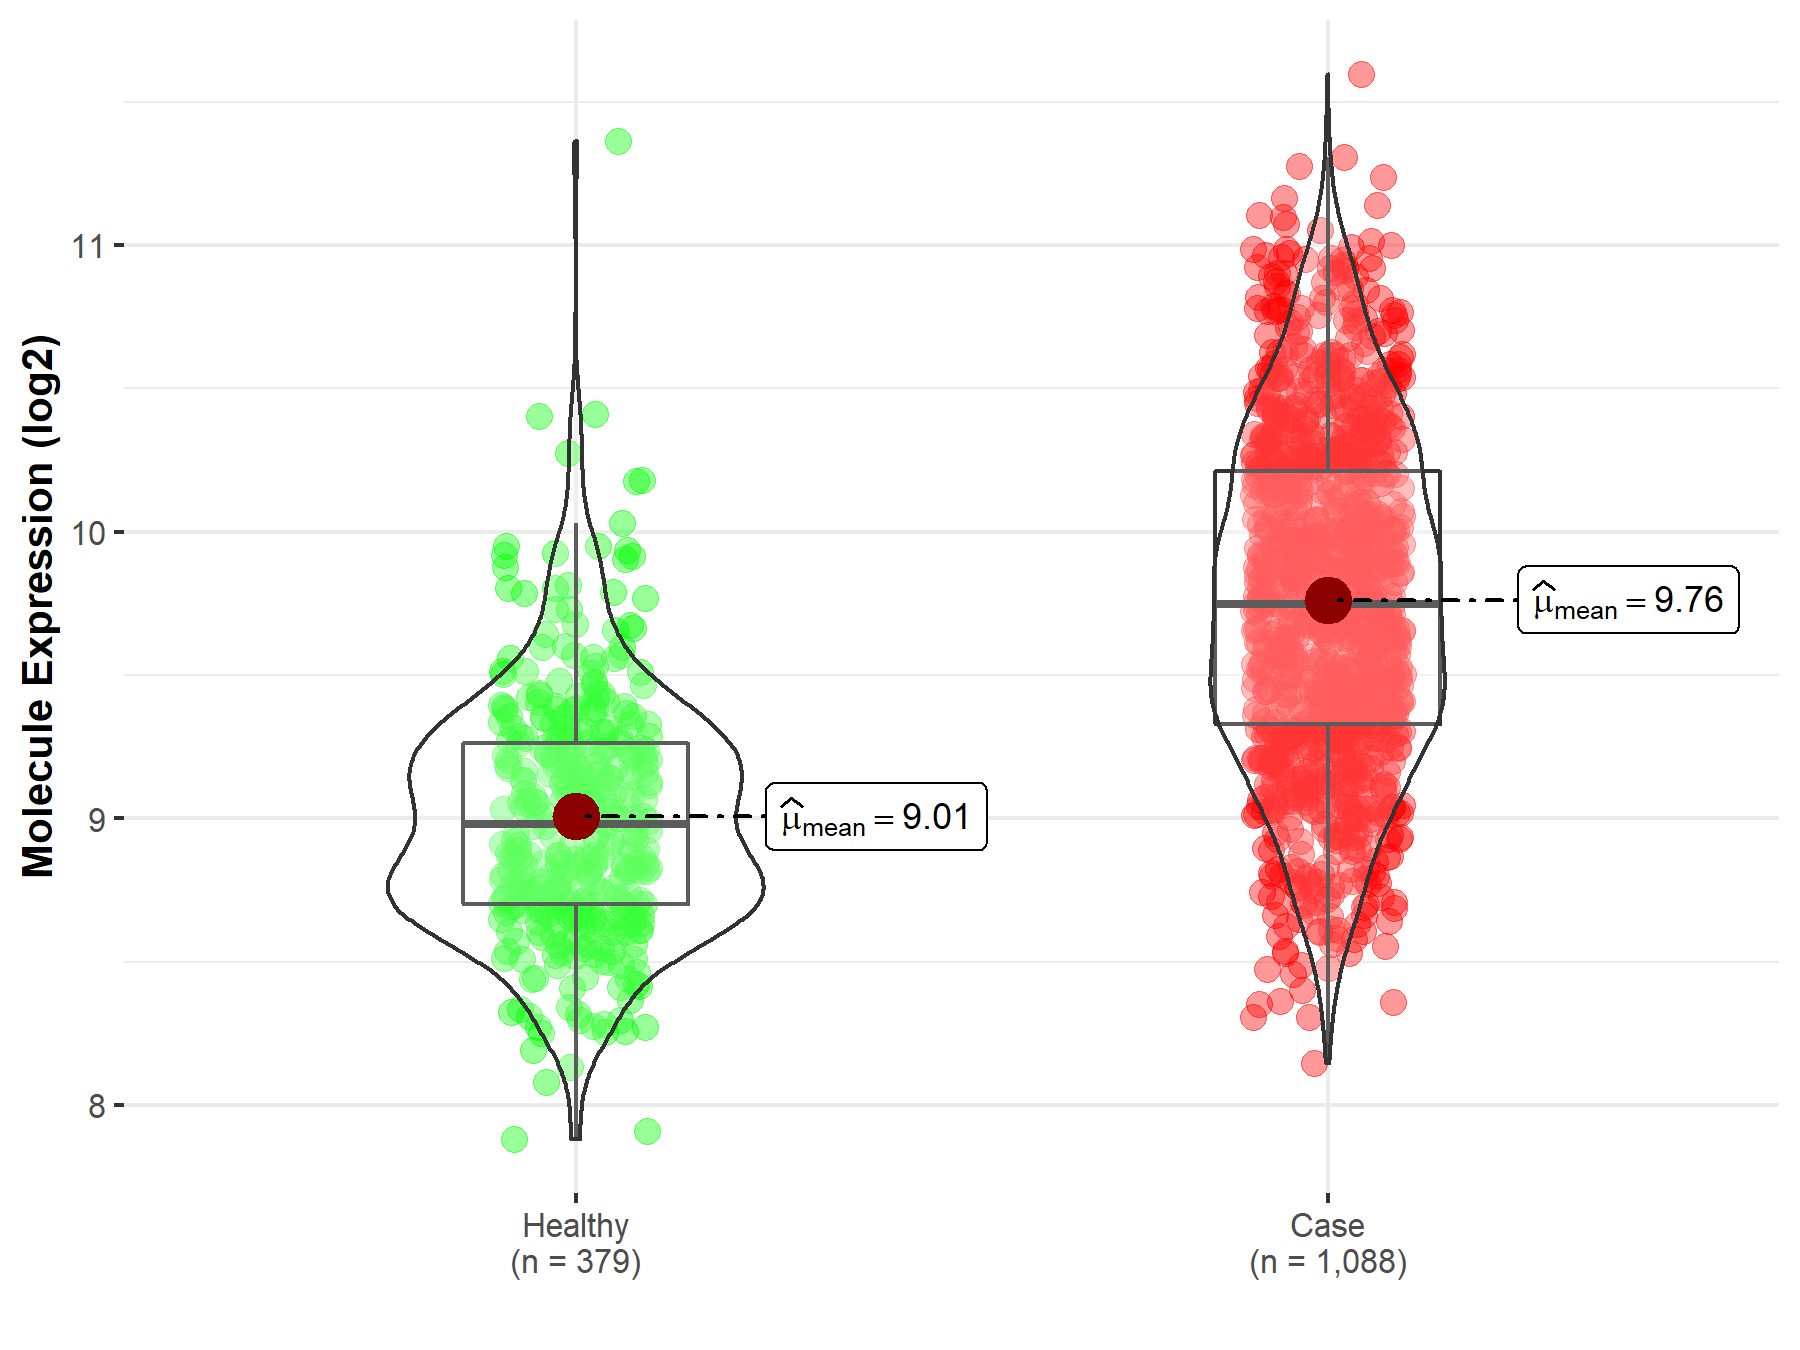
| The Studied Tissue | Nervous tissue | |
| The Specified Disease | Brain cancer | |
| The Expression Level of Disease Section Compare with the Healthy Individual Tissue | p-value: 2.68E-114; Fold-change: 7.68E-01; Z-score: 1.77E+00 | |
|
Molecule expression in the diseased tissue of patients
Molecule expression in the normal tissue of healthy individuals
|
||
| Disease-specific Molecule Abundances |
|
Click to View the Clearer Original Diagram |
| The Studied Tissue | Brainstem tissue | |
| The Specified Disease | Glioma | |
| The Expression Level of Disease Section Compare with the Healthy Individual Tissue | p-value: 5.08E-01; Fold-change: 3.56E-01; Z-score: 7.81E-01 | |
|
Molecule expression in the diseased tissue of patients
Molecule expression in the normal tissue of healthy individuals
|
||
| Disease-specific Molecule Abundances |

|
Click to View the Clearer Original Diagram |
| The Studied Tissue | White matter | |
| The Specified Disease | Glioma | |
| The Expression Level of Disease Section Compare with the Healthy Individual Tissue | p-value: 1.12E-05; Fold-change: 7.30E-01; Z-score: 2.15E+00 | |
|
Molecule expression in the diseased tissue of patients
Molecule expression in the normal tissue of healthy individuals
|
||
| Disease-specific Molecule Abundances |

|
Click to View the Clearer Original Diagram |
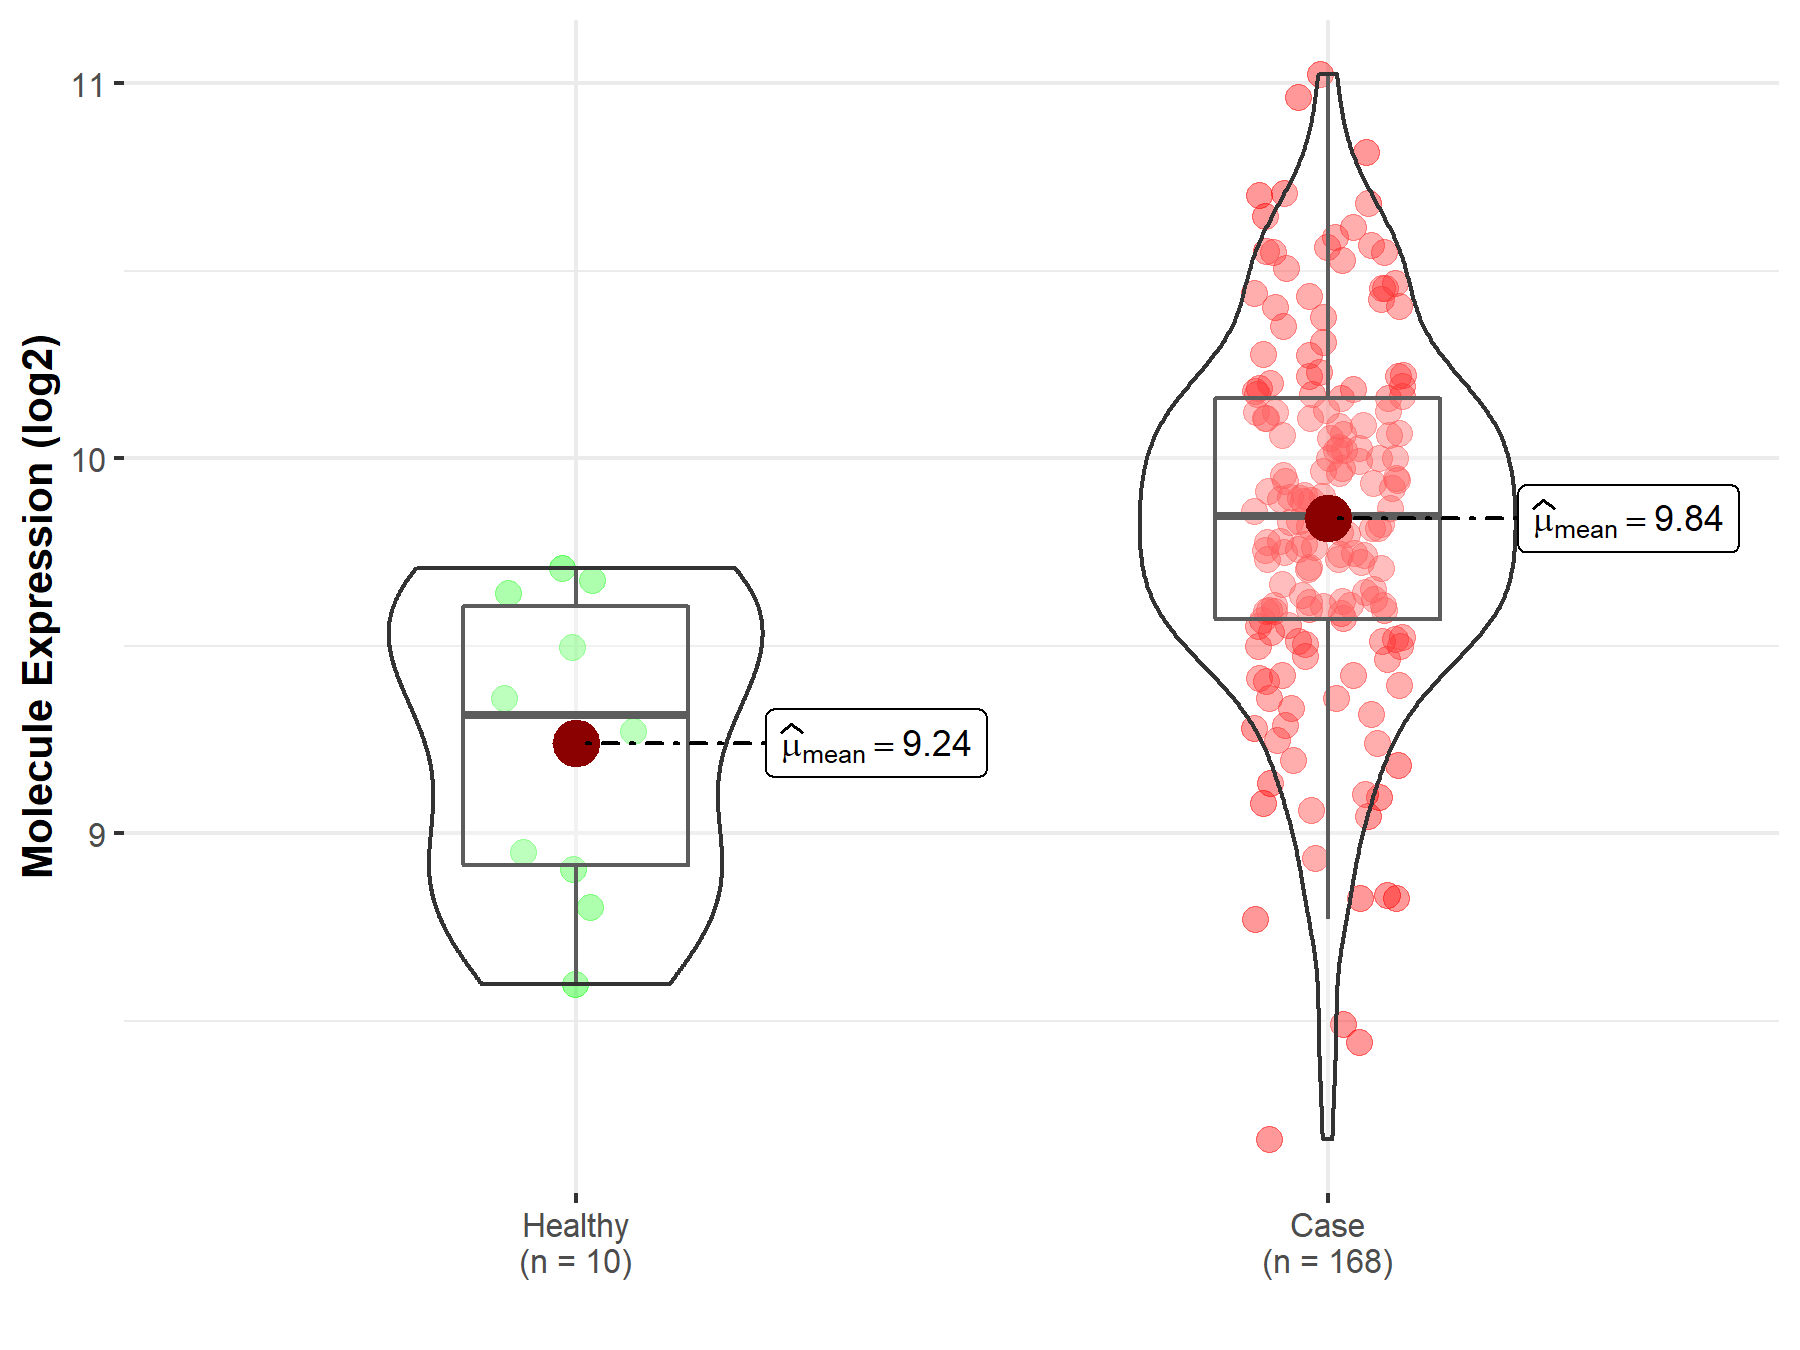
| The Studied Tissue | Brainstem tissue | |
| The Specified Disease | Neuroectodermal tumor | |
| The Expression Level of Disease Section Compare with the Healthy Individual Tissue | p-value: 9.41E-04; Fold-change: 5.31E-01; Z-score: 1.32E+00 | |
|
Molecule expression in the diseased tissue of patients
Molecule expression in the normal tissue of healthy individuals
|
||
| Disease-specific Molecule Abundances |
|
Click to View the Clearer Original Diagram |
| Differential expression of molecule in resistant diseases | ||
| The Studied Tissue | Bone marrow | |
| The Specified Disease | Acute myeloid leukemia | |
| The Expression Level of Disease Section Compare with the Healthy Individual Tissue | p-value: 7.36E-14; Fold-change: 5.04E-01; Z-score: 9.47E-01 | |
|
Molecule expression in the diseased tissue of patients
Molecule expression in the normal tissue of healthy individuals
|
||
| Disease-specific Molecule Abundances |

|
Click to View the Clearer Original Diagram |
| Differential expression of molecule in resistant diseases | ||
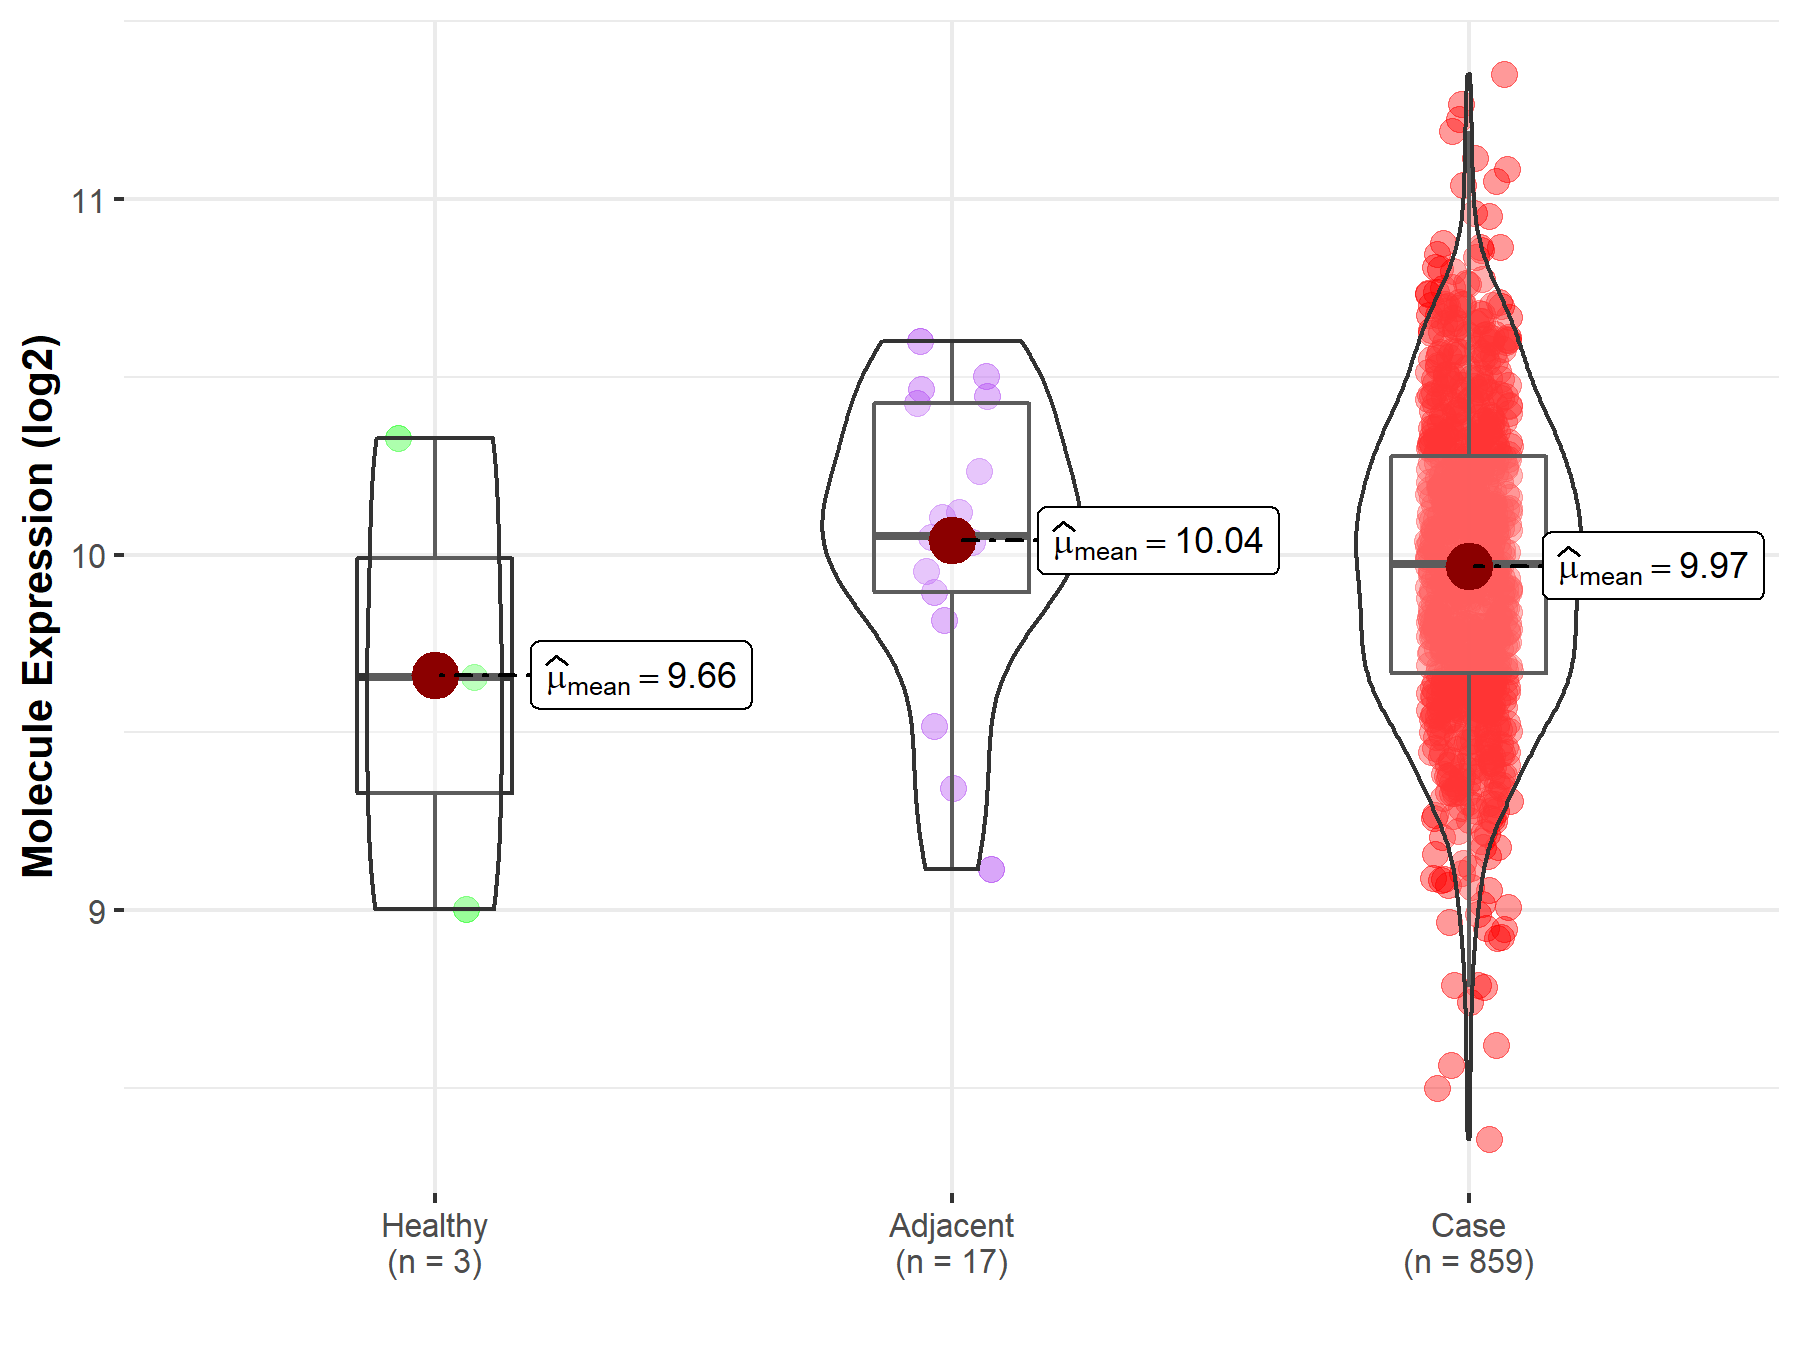
| The Studied Tissue | Gastric tissue | |
| The Specified Disease | Gastric cancer | |
| The Expression Level of Disease Section Compare with the Healthy Individual Tissue | p-value: 5.07E-01; Fold-change: 3.20E-01; Z-score: 4.82E-01 | |
| The Expression Level of Disease Section Compare with the Adjacent Tissue | p-value: 4.94E-01; Fold-change: -7.67E-02; Z-score: -1.85E-01 | |
|
Molecule expression in the normal tissue adjacent to the diseased tissue of patients
Molecule expression in the diseased tissue of patients
Molecule expression in the normal tissue of healthy individuals
|
||
| Disease-specific Molecule Abundances |
|
Click to View the Clearer Original Diagram |
| Differential expression of molecule in resistant diseases | ||
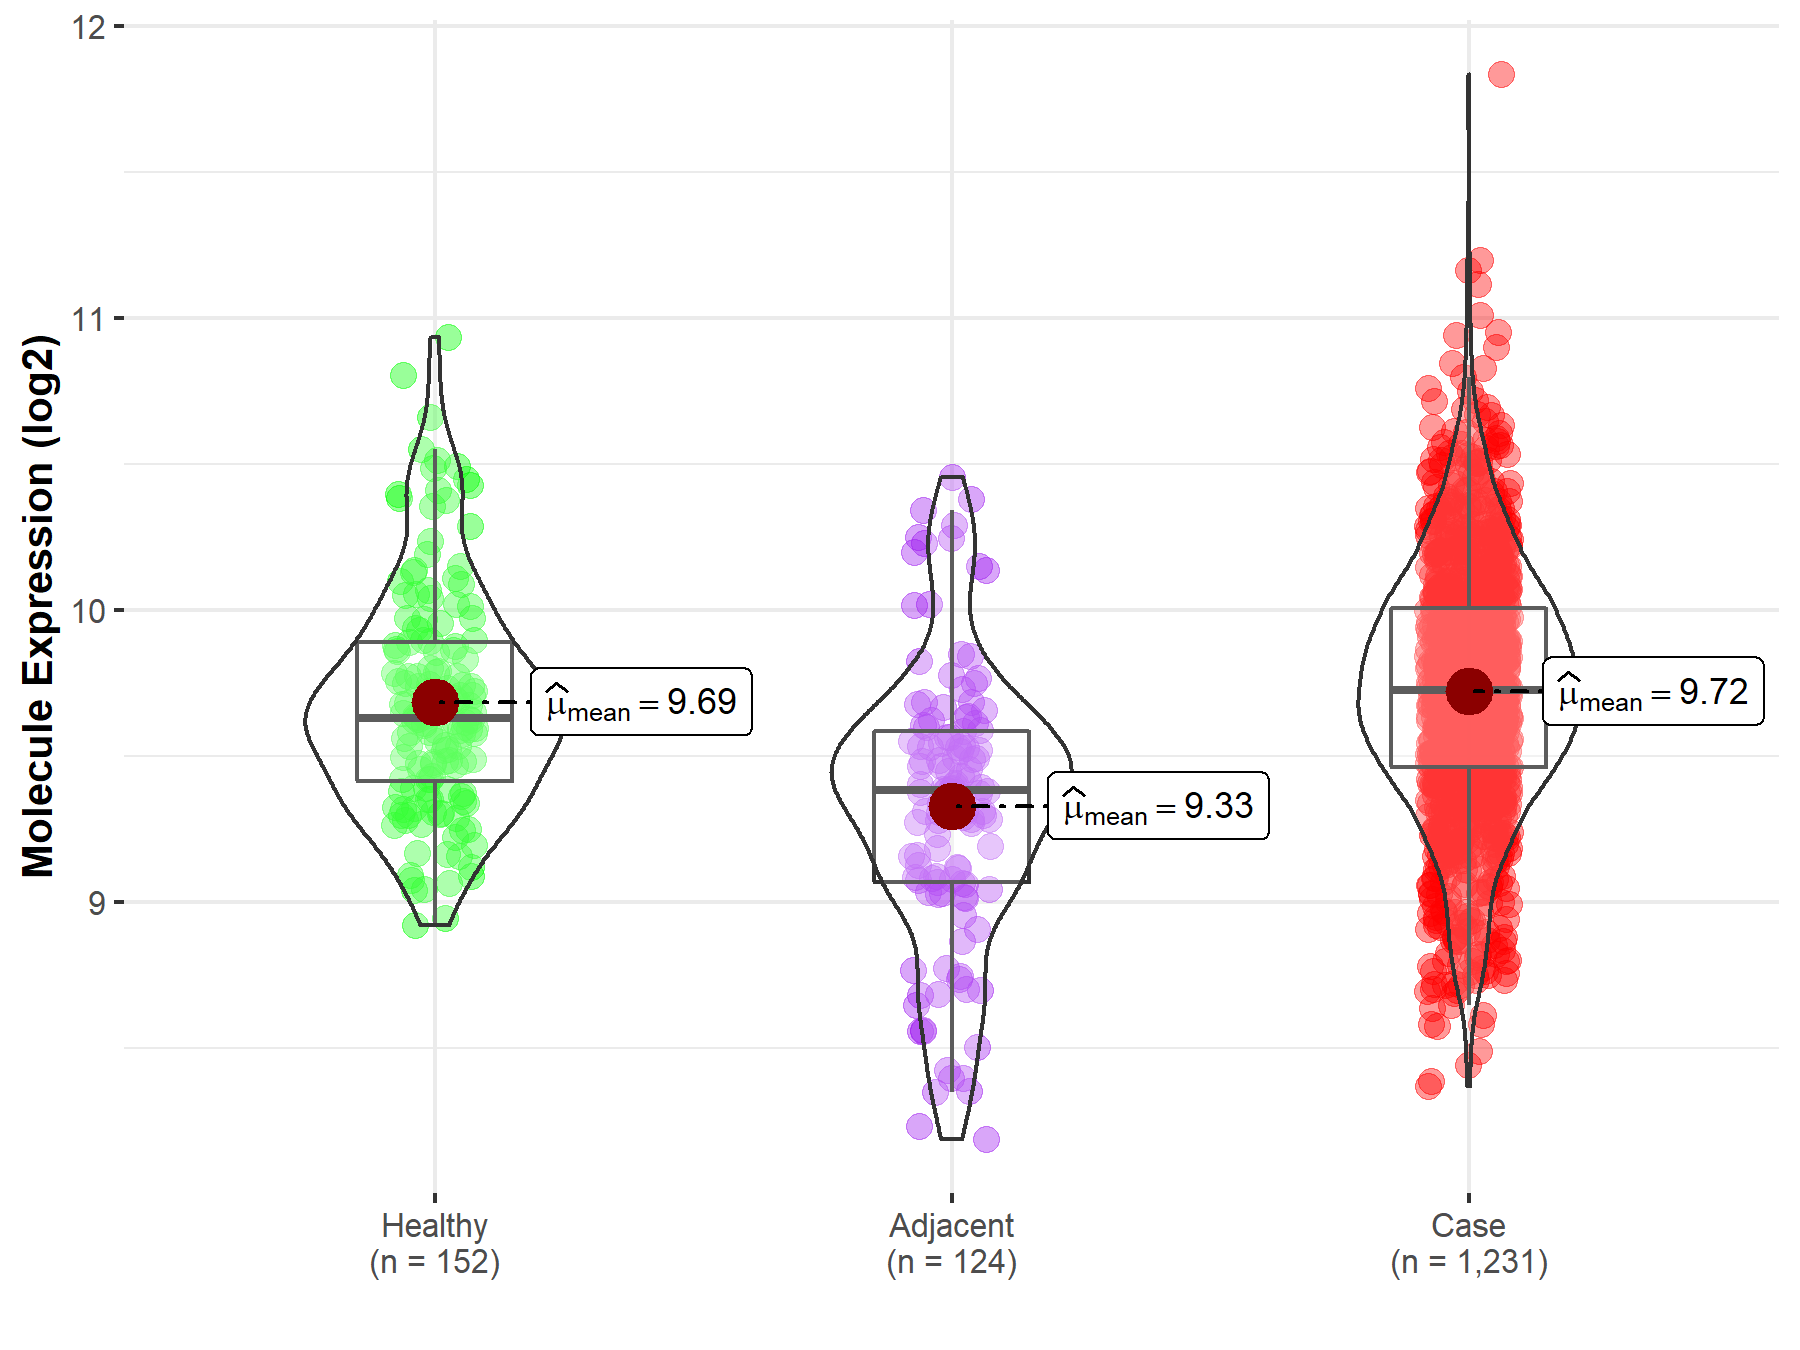
| The Studied Tissue | Colon | |
| The Specified Disease | Colon cancer | |
| The Expression Level of Disease Section Compare with the Healthy Individual Tissue | p-value: 2.94E-01; Fold-change: 9.59E-02; Z-score: 2.46E-01 | |
| The Expression Level of Disease Section Compare with the Adjacent Tissue | p-value: 4.15E-15; Fold-change: 3.42E-01; Z-score: 7.17E-01 | |
|
Molecule expression in the normal tissue adjacent to the diseased tissue of patients
Molecule expression in the diseased tissue of patients
Molecule expression in the normal tissue of healthy individuals
|
||
| Disease-specific Molecule Abundances |
|
Click to View the Clearer Original Diagram |
| Differential expression of molecule in resistant diseases | ||
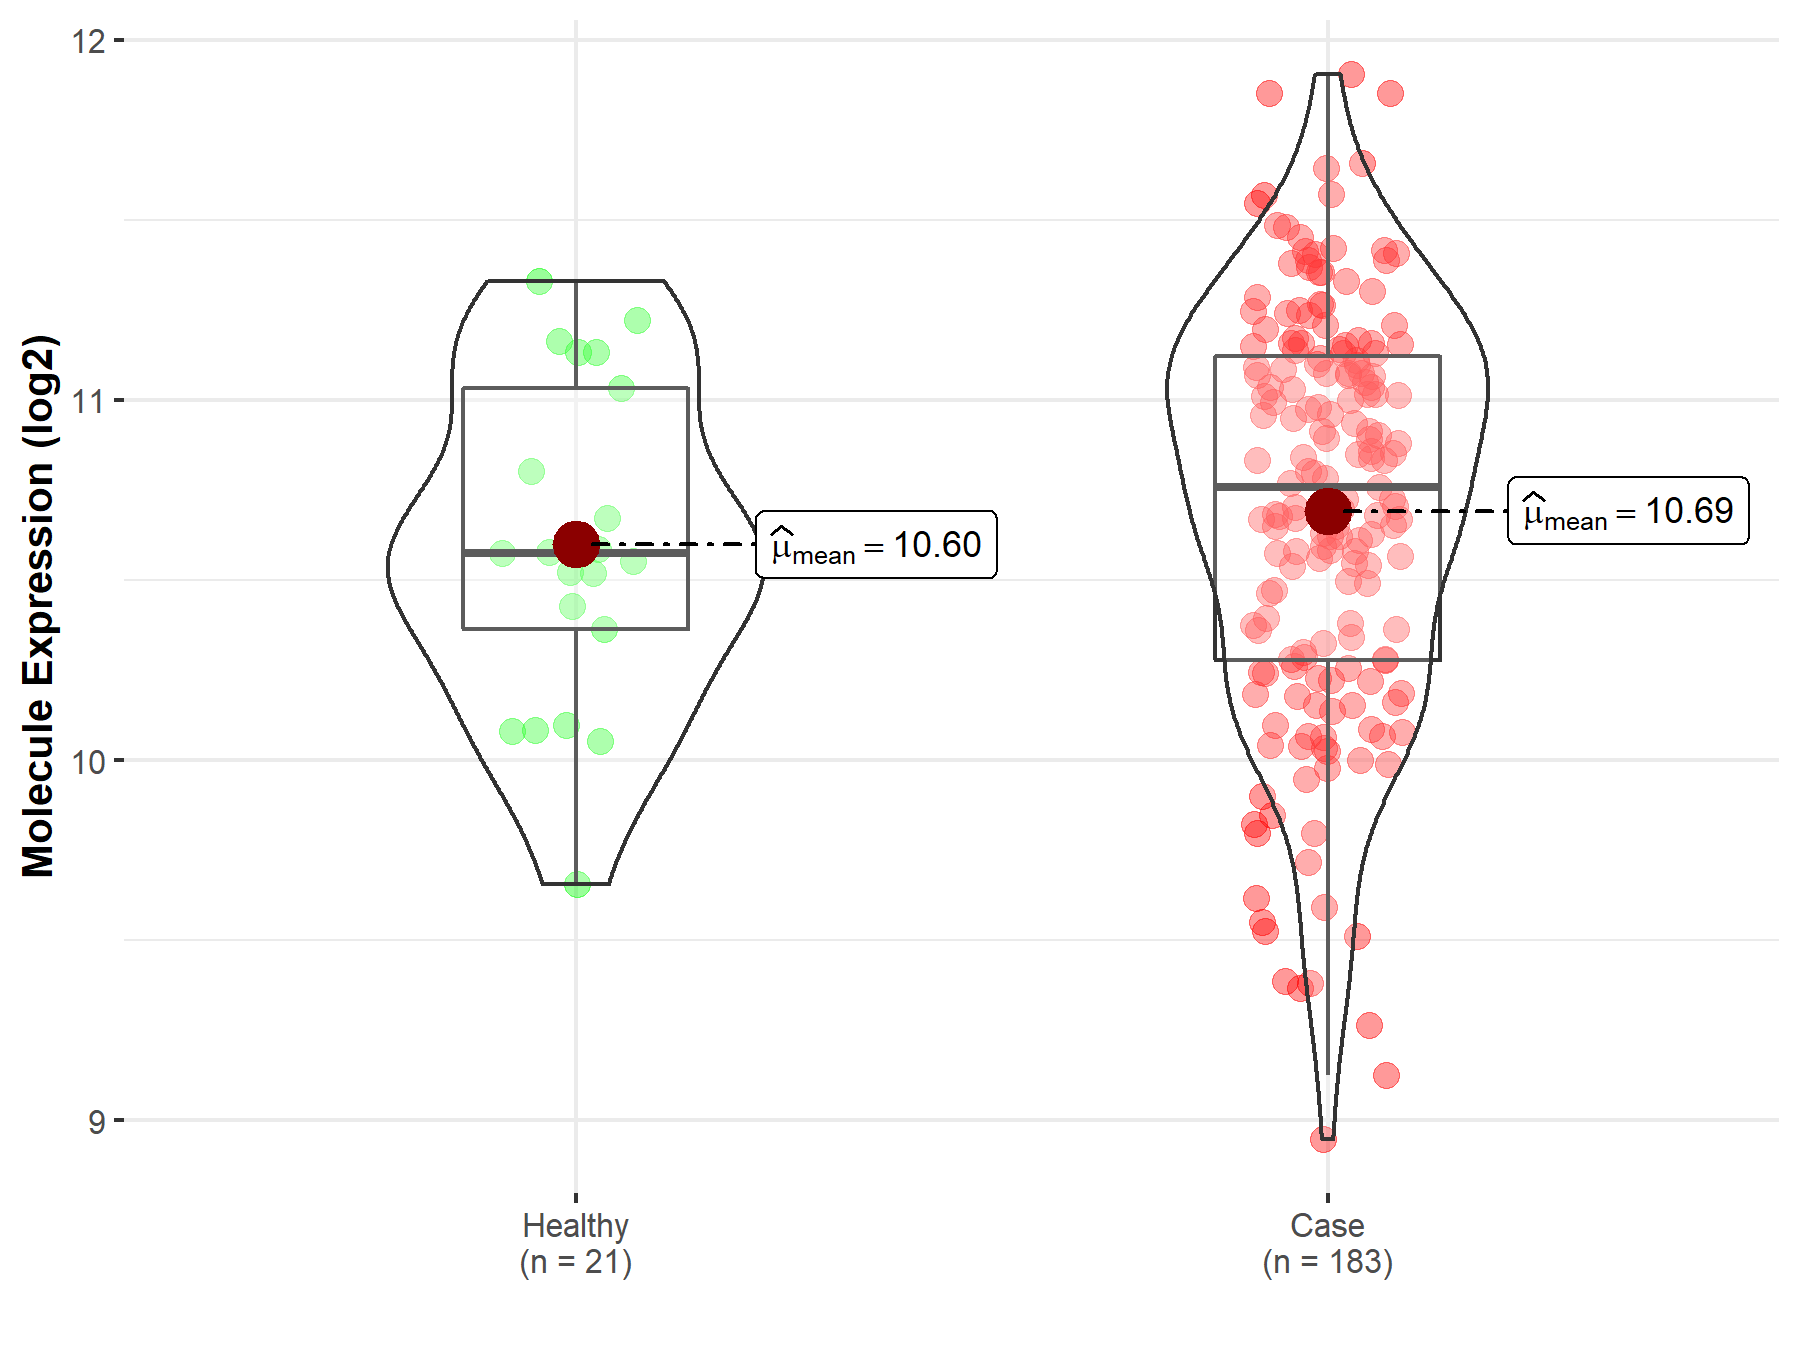
| The Studied Tissue | Prostate | |
| The Specified Disease | Prostate cancer | |
| The Expression Level of Disease Section Compare with the Healthy Individual Tissue | p-value: 3.92E-01; Fold-change: 1.82E-01; Z-score: 4.02E-01 | |
|
Molecule expression in the diseased tissue of patients
Molecule expression in the normal tissue of healthy individuals
|
||
| Disease-specific Molecule Abundances |
|
Click to View the Clearer Original Diagram |
| Differential expression of molecule in resistant diseases | ||
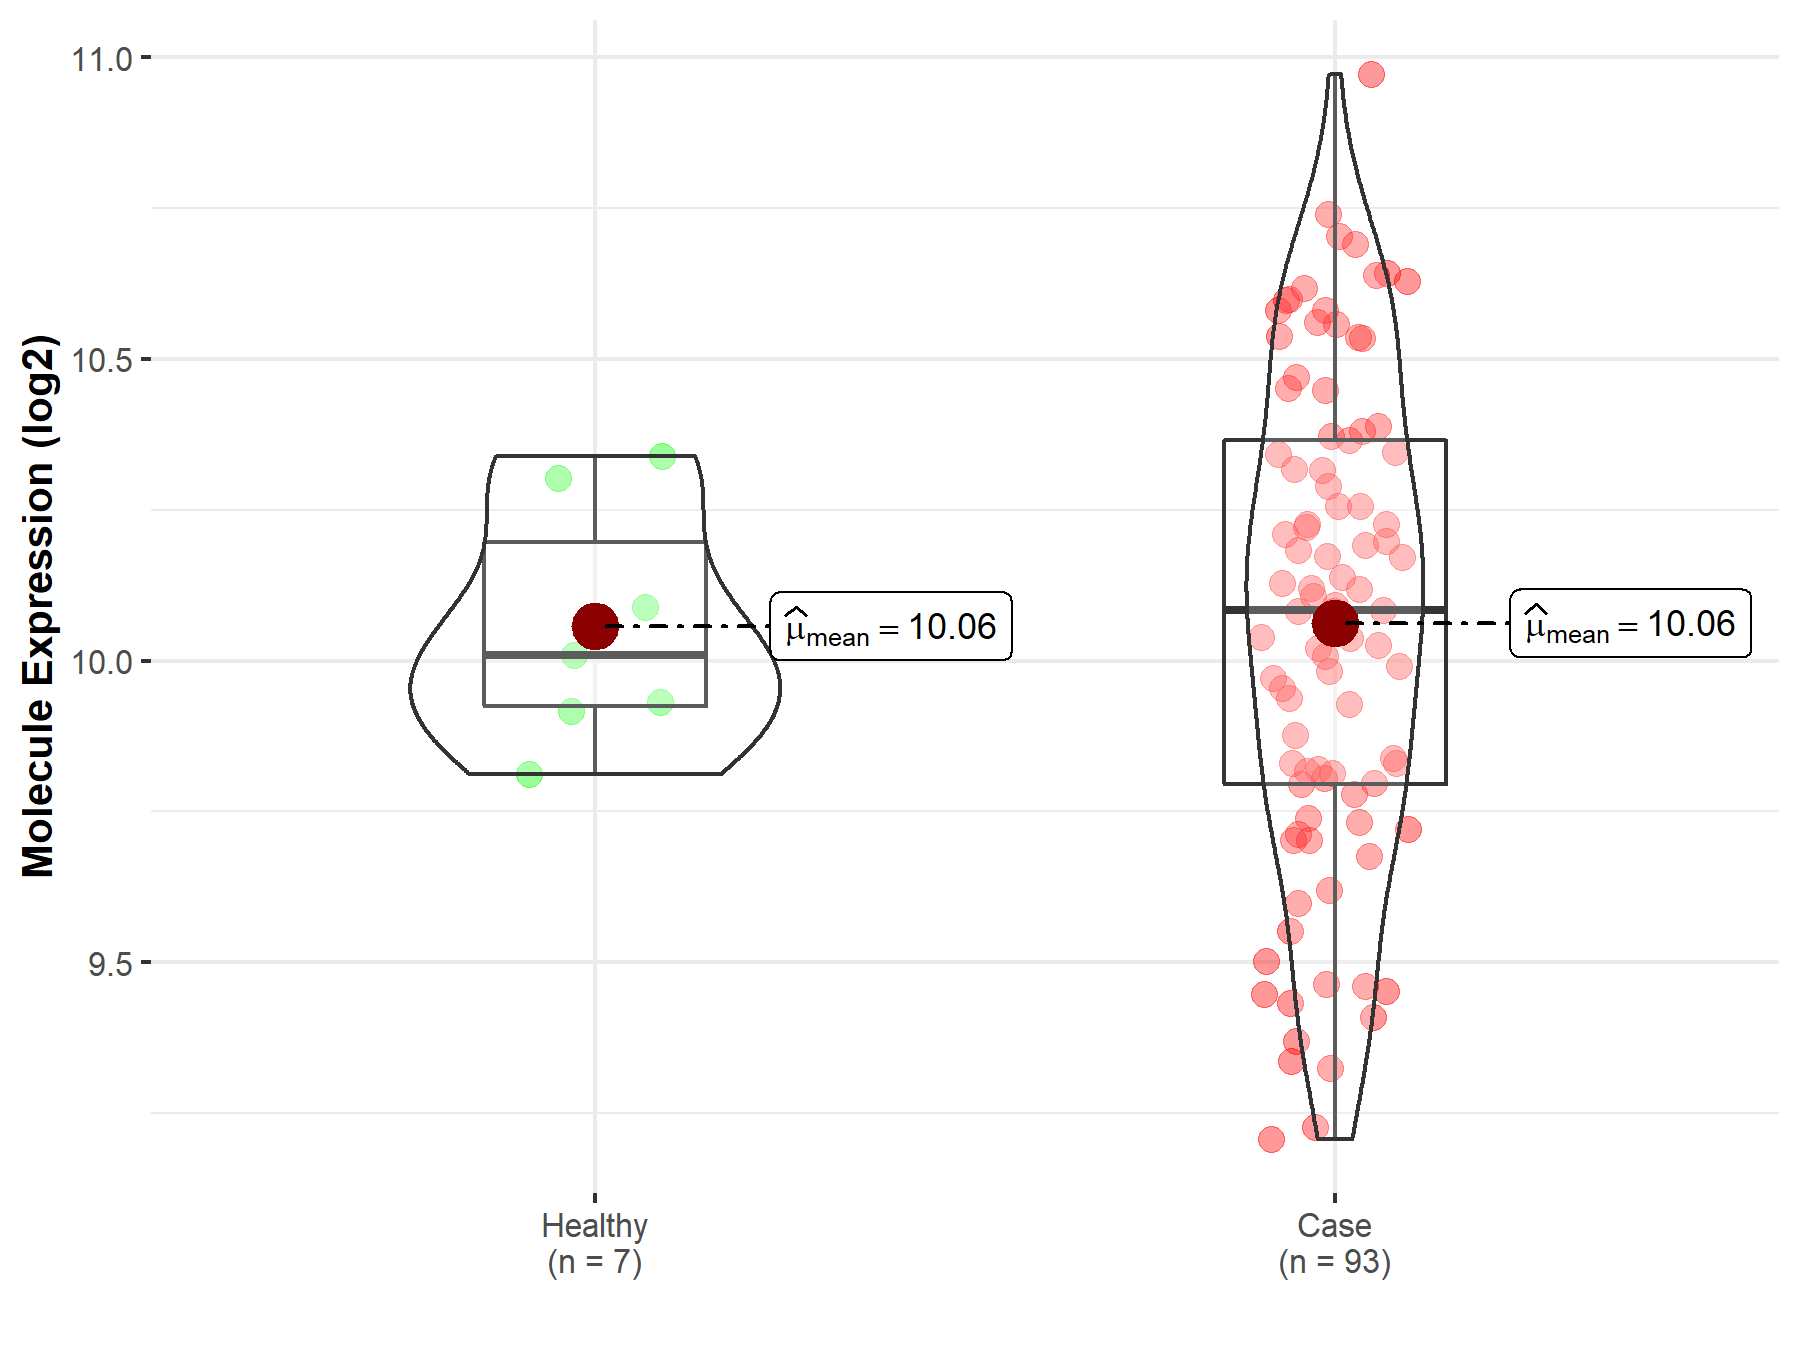
| The Studied Tissue | Bladder tissue | |
| The Specified Disease | Bladder cancer | |
| The Expression Level of Disease Section Compare with the Healthy Individual Tissue | p-value: 9.58E-01; Fold-change: 7.60E-02; Z-score: 3.81E-01 | |
|
Molecule expression in the diseased tissue of patients
Molecule expression in the normal tissue of healthy individuals
|
||
| Disease-specific Molecule Abundances |
|
Click to View the Clearer Original Diagram |
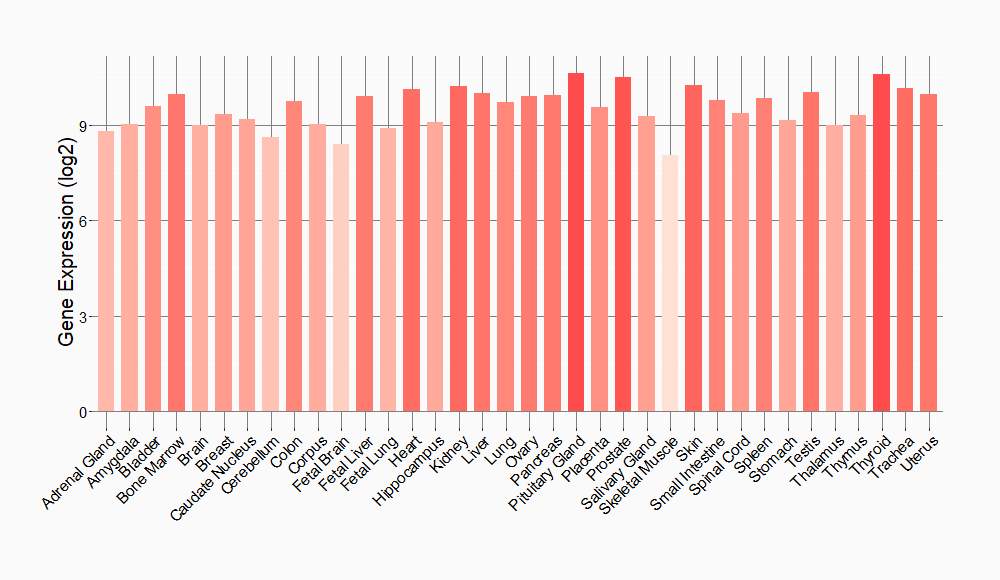
Tissue-specific Molecule Abundances in Healthy Individuals

|
||
References
If you find any error in data or bug in web service, please kindly report it to Dr. Sun and Dr. Yu.
