Molecule Information
General Information of the Molecule (ID: Mol00248)
| Name |
Bcl-2 homologous antagonist/killer (BAK1)
,Homo sapiens
|
||||
|---|---|---|---|---|---|
| Synonyms |
Apoptosis regulator BAK; Bcl-2-like protein 7; Bcl2-L-7; BAK; BCL2L7; CDN1
Click to Show/Hide
|
||||
| Molecule Type |
Protein
|
||||
| Gene Name |
BAK1
|
||||
| Gene ID | |||||
| Location |
chr6:33572547-33580293[-]
|
||||
| Sequence |
MASGQGPGPPRQECGEPALPSASEEQVAQDTEEVFRSYVFYRHQQEQEAEGVAAPADPEM
VTLPLQPSSTMGQVGRQLAIIGDDINRRYDSEFQTMLQHLQPTAENAYEYFTKIATSLFE SGINWGRVVALLGFGYRLALHVYQHGLTGFLGQVTRFVVDFMLHHCIARWIAQRGGWVAA LNLGNGPILNVLVVLGVVLLGQFVVRRFFKS Click to Show/Hide
|
||||
| 3D-structure |
|
||||
| Function |
Plays a role in the mitochondrial apoptosic process. Upon arrival of cell death signals, promotes mitochondrial outer membrane (MOM) permeabilization by oligomerizing to form pores within the MOM. This releases apoptogenic factors into the cytosol, including cytochrome c, promoting the activation of caspase 9 which in turn processes and activates the effector caspases.
Click to Show/Hide
|
||||
| Uniprot ID | |||||
| Ensembl ID | |||||
| HGNC ID | |||||
| Click to Show/Hide the Complete Species Lineage | |||||
Type(s) of Resistant Mechanism of This Molecule
Drug Resistance Data Categorized by Drug
Approved Drug(s)
5 drug(s) in total
| Drug Resistance Data Categorized by Their Corresponding Mechanisms | ||||
|
|
||||
| Disease Class: Primitive neuroectodermal tumor [ICD-11: 2A00.08] | [1] | |||
| Resistant Disease | Primitive neuroectodermal tumor [ICD-11: 2A00.08] | |||
| Resistant Drug | Doxorubicin | |||
| Molecule Alteration | Expression | Down-regulation |
||
| Differential expression of the molecule in resistant disease | ||||
| Classification of Disease | Brain cancer [ICD-11: 2A00] | |||
| The Specified Disease | Glioma | |||
| The Studied Tissue | Brainstem tissue | |||
| The Expression Level of Disease Section Compare with the Healthy Individual Tissue | p-value: 6.54E-01 Fold-change: -4.36E-02 Z-score: -5.89E-01 |
|||
| Experimental Note | Identified from the Human Clinical Data | |||
| Cell Pathway Regulation | Cell apoptosis | Inhibition | hsa04210 | |
| miR125b-p53/BAKT signaling pathway | Activation | hsa05206 | ||
| In Vitro Model | RD-ES cells | Bones | Homo sapiens (Human) | CVCL_2169 |
| Sk-ES cells | Bones | Homo sapiens (Human) | CVCL_0627 | |
| Sk-N-MC cells | Bones | Homo sapiens (Human) | CVCL_0530 | |
| TC-71 cells | Bones | Homo sapiens (Human) | CVCL_2213 | |
| VH-64 cells | Bones | Homo sapiens (Human) | CVCL_9672 | |
| WE-68 cells | Bones | Homo sapiens (Human) | CVCL_9717 | |
| Experiment for Molecule Alteration |
Western blot analysis | |||
| Experiment for Drug Resistance |
Celltiter-glo luminescent cell viability assay | |||
| Mechanism Description | miR-125b led to the development of chemoresistance by suppressing the expression of p53 and Bak, and repression of miR-125b sensitized EWS cells to apoptosis induced by treatment with various cytotoxic drugs. | |||
| Disease Class: Acute promyelocytic leukemia [ICD-11: 2A60.2] | [4] | |||
| Resistant Disease | Acute promyelocytic leukemia [ICD-11: 2A60.2] | |||
| Resistant Drug | Doxorubicin | |||
| Molecule Alteration | Expression | Down-regulation |
||
| Experimental Note | Identified from the Human Clinical Data | |||
| Cell Pathway Regulation | Cell apoptosis | Inhibition | hsa04210 | |
| Cell proliferation | Activation | hsa05200 | ||
| In Vitro Model | HL60 cells | Peripheral blood | Homo sapiens (Human) | CVCL_0002 |
| K562 cells | Blood | Homo sapiens (Human) | CVCL_0004 | |
| NB4 cells | Bone marrow | Homo sapiens (Human) | CVCL_0005 | |
| In Vivo Model | BALB/c nude mouse xenograft model | Mus musculus | ||
| Experiment for Molecule Alteration |
Western blot analysis | |||
| Experiment for Drug Resistance |
CCK8 assay | |||
| Mechanism Description | miR-125b could promote leukemic cell proliferation and inhibit cell apoptosis by regulating the expression of tumor suppressor BCL2-antagonist/killer 1 (Bak1). transfection of a miR-125b duplex into AML cells can increase their resistance to therapeutic drugs. | |||
| Drug Resistance Data Categorized by Their Corresponding Mechanisms | ||||
|
|
||||
| Disease Class: Ovarian cancer [ICD-11: 2C73.0] | [3] | |||
| Resistant Disease | Ovarian cancer [ICD-11: 2C73.0] | |||
| Resistant Drug | Cisplatin | |||
| Molecule Alteration | Expression | Down-regulation |
||
| Experimental Note | Revealed Based on the Cell Line Data | |||
| Cell Pathway Regulation | Cell apoptosis | Inhibition | hsa04210 | |
| In Vitro Model | OV2008 cells | Ovary | Homo sapiens (Human) | CVCL_0473 |
| Experiment for Molecule Alteration |
Western blot analysis | |||
| Experiment for Drug Resistance |
CCK8 assay | |||
| Mechanism Description | Bak1 was a direct target of miR-125b, and down-regulation of Bak1 suppressed cisplatin-induced apoptosis and led to an increased resistance to cisplatin. miR-125b has a sig-nificantly promoting effect on chemoresistance of C13* cells and up-regulation of miR-125b expression contributes to cisplatin resistance through suppression of Bak1 expression. | |||
| Drug Resistance Data Categorized by Their Corresponding Mechanisms | ||||
|
|
||||
| Disease Class: Primitive neuroectodermal tumor [ICD-11: 2A00.08] | [1] | |||
| Resistant Disease | Primitive neuroectodermal tumor [ICD-11: 2A00.08] | |||
| Resistant Drug | Etoposide | |||
| Molecule Alteration | Expression | Down-regulation |
||
| Experimental Note | Identified from the Human Clinical Data | |||
| Cell Pathway Regulation | Cell apoptosis | Inhibition | hsa04210 | |
| miR125b-p53/BAKT signaling pathway | Activation | hsa05206 | ||
| In Vitro Model | RD-ES cells | Bones | Homo sapiens (Human) | CVCL_2169 |
| Sk-ES cells | Bones | Homo sapiens (Human) | CVCL_0627 | |
| Sk-N-MC cells | Bones | Homo sapiens (Human) | CVCL_0530 | |
| TC-71 cells | Bones | Homo sapiens (Human) | CVCL_2213 | |
| VH-64 cells | Bones | Homo sapiens (Human) | CVCL_9672 | |
| WE-68 cells | Bones | Homo sapiens (Human) | CVCL_9717 | |
| Experiment for Molecule Alteration |
Western blot analysis | |||
| Experiment for Drug Resistance |
Celltiter-glo luminescent cell viability assay | |||
| Mechanism Description | miR-125b led to the development of chemoresistance by suppressing the expression of p53 and Bak, and repression of miR-125b sensitized EWS cells to apoptosis induced by treatment with various cytotoxic drugs. | |||
| Drug Resistance Data Categorized by Their Corresponding Mechanisms | ||||
|
|
||||
| Disease Class: Breast cancer [ICD-11: 2C60.3] | [5] | |||
| Resistant Disease | Breast cancer [ICD-11: 2C60.3] | |||
| Resistant Drug | Paclitaxel | |||
| Molecule Alteration | Expression | Down-regulation |
||
| Experimental Note | Revealed Based on the Cell Line Data | |||
| Cell Pathway Regulation | Cell apoptosis | Inhibition | hsa04210 | |
| In Vitro Model | MCF-7 cells | Breast | Homo sapiens (Human) | CVCL_0031 |
| SkBR3 cells | Breast | Homo sapiens (Human) | CVCL_0033 | |
| MDA-MB-231 cells | Breast | Homo sapiens (Human) | CVCL_0062 | |
| BT474 cells | Breast | Homo sapiens (Human) | CVCL_0179 | |
| MDA-MB-436 cells | Breast | Homo sapiens (Human) | CVCL_0623 | |
| MDA-MB-435 cells | Breast | Homo sapiens (Human) | CVCL_0417 | |
| Experiment for Molecule Alteration |
Western blot analysis | |||
| Experiment for Drug Resistance |
Celltiter 96 aqueous one solution cell proliferation assay | |||
| Mechanism Description | miR-125b was up-regulated in Taxol-resistant cells, causing a marked inhibition of Taxol-induced cytotoxicity and apoptosis and a subsequent increase in the resistance to Taxol in cancer cells. The pro-apoptotic Bcl-2 antagonist killer 1 (Bak1) is a direct target of miR-125b. Down-regulation of Bak1 suppressed Taxol-induced apoptosis and led to an increased resistance to Taxol. | |||
| Drug Resistance Data Categorized by Their Corresponding Mechanisms | ||||
|
|
||||
| Disease Class: Primitive neuroectodermal tumor [ICD-11: 2A00.08] | [1] | |||
| Resistant Disease | Primitive neuroectodermal tumor [ICD-11: 2A00.08] | |||
| Resistant Drug | Vincristine | |||
| Molecule Alteration | Expression | Down-regulation |
||
| Experimental Note | Identified from the Human Clinical Data | |||
| Cell Pathway Regulation | Cell apoptosis | Inhibition | hsa04210 | |
| miR125b-p53/BAKT signaling pathway | Activation | hsa05206 | ||
| In Vitro Model | RD-ES cells | Bones | Homo sapiens (Human) | CVCL_2169 |
| Sk-ES cells | Bones | Homo sapiens (Human) | CVCL_0627 | |
| Sk-N-MC cells | Bones | Homo sapiens (Human) | CVCL_0530 | |
| TC-71 cells | Bones | Homo sapiens (Human) | CVCL_2213 | |
| VH-64 cells | Bones | Homo sapiens (Human) | CVCL_9672 | |
| WE-68 cells | Bones | Homo sapiens (Human) | CVCL_9717 | |
| Experiment for Molecule Alteration |
Western blot analysis | |||
| Experiment for Drug Resistance |
Celltiter-glo luminescent cell viability assay | |||
| Mechanism Description | miR-125b led to the development of chemoresistance by suppressing the expression of p53 and Bak, and repression of miR-125b sensitized EWS cells to apoptosis induced by treatment with various cytotoxic drugs. | |||
Disease- and Tissue-specific Abundances of This Molecule
ICD Disease Classification 02

| Differential expression of molecule in resistant diseases | ||
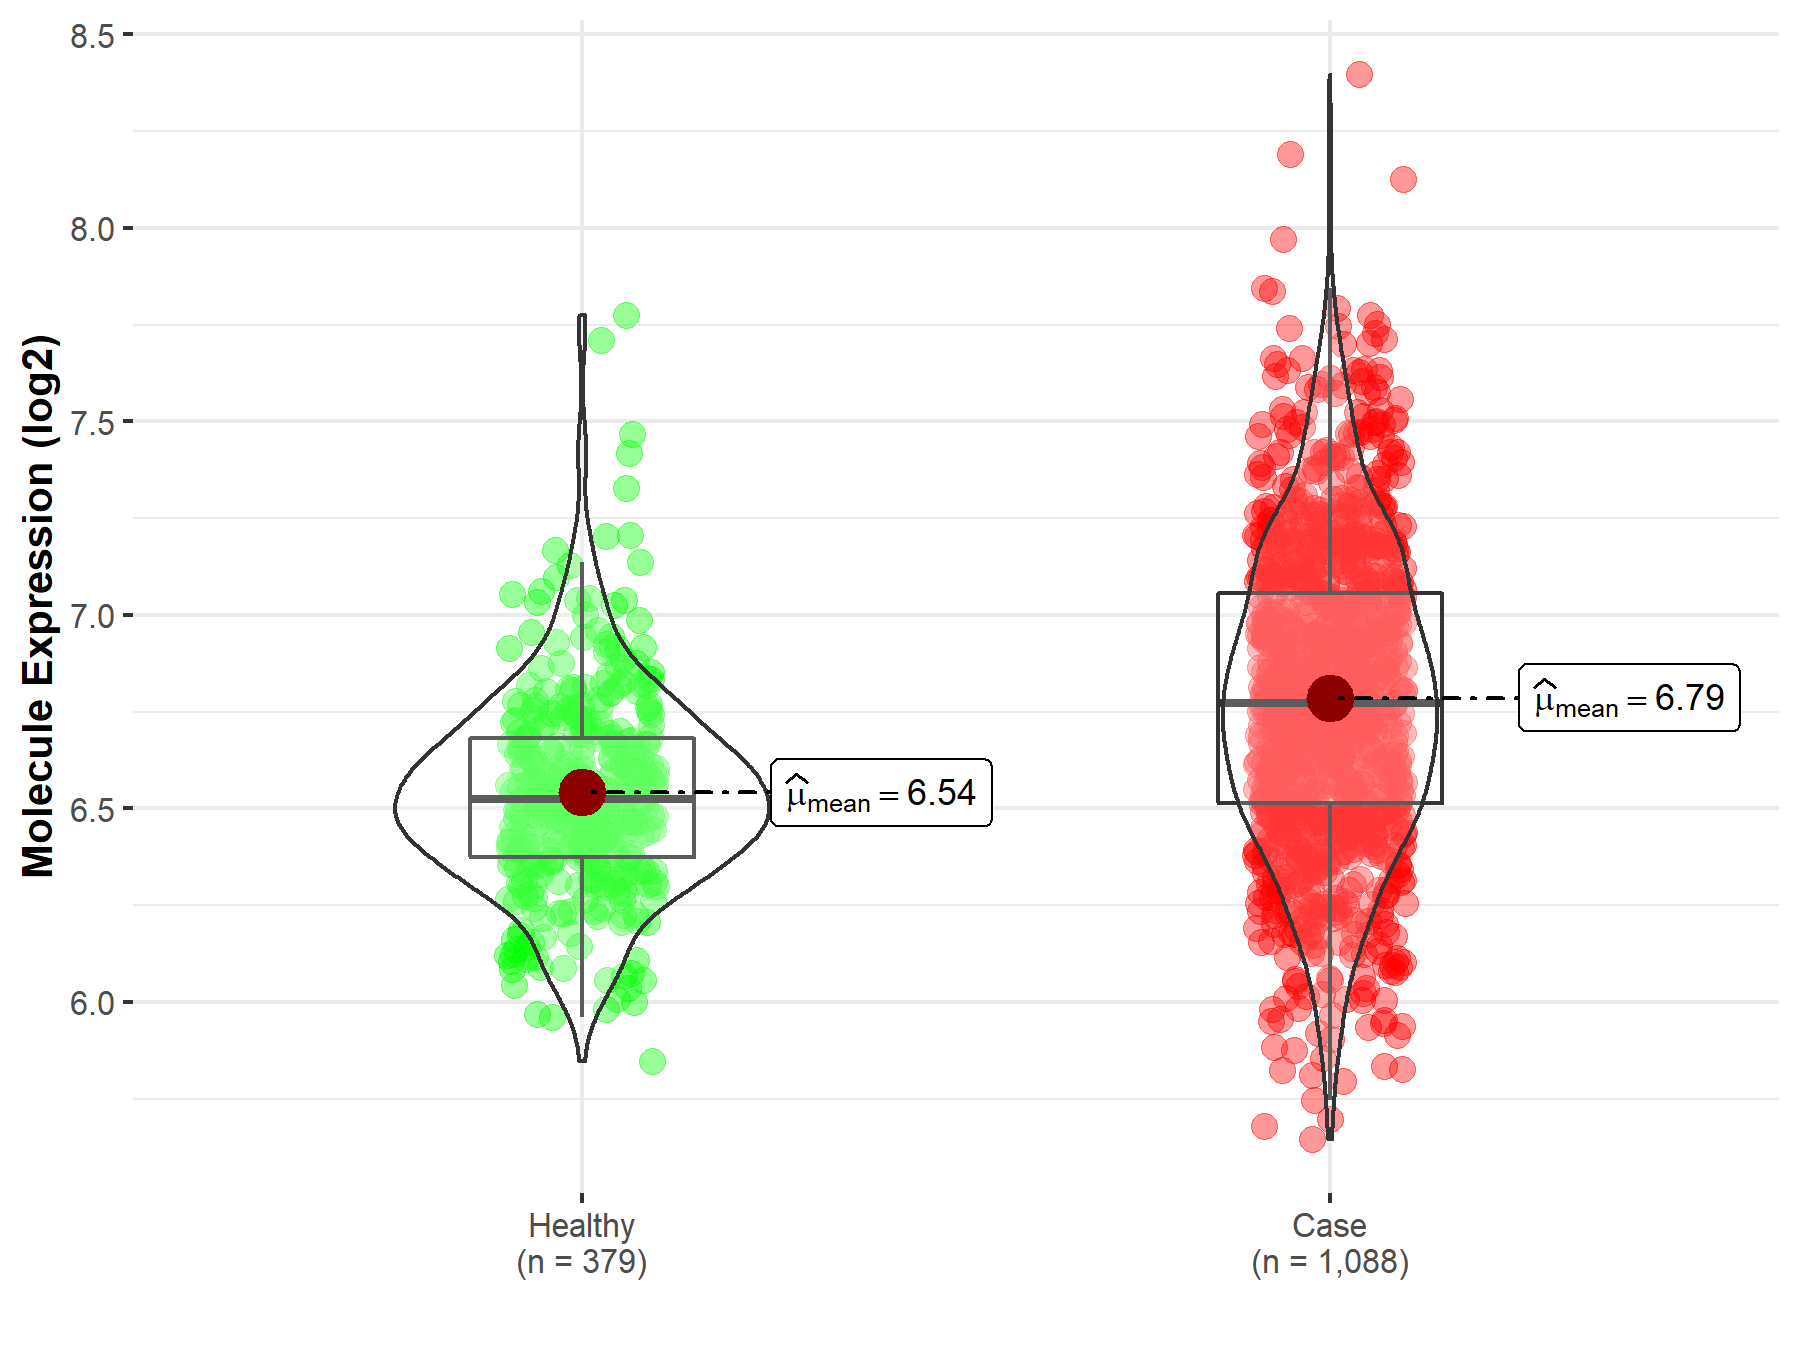
| The Studied Tissue | Nervous tissue | |
| The Specified Disease | Brain cancer | |
| The Expression Level of Disease Section Compare with the Healthy Individual Tissue | p-value: 6.62E-38; Fold-change: 2.48E-01; Z-score: 9.37E-01 | |
|
Molecule expression in the diseased tissue of patients
Molecule expression in the normal tissue of healthy individuals
|
||
| Disease-specific Molecule Abundances |

|
Click to View the Clearer Original Diagram |
| The Studied Tissue | Brainstem tissue | |
| The Specified Disease | Glioma | |
| The Expression Level of Disease Section Compare with the Healthy Individual Tissue | p-value: 6.54E-01; Fold-change: -2.48E-01; Z-score: -6.09E-01 | |
|
Molecule expression in the diseased tissue of patients
Molecule expression in the normal tissue of healthy individuals
|
||
| Disease-specific Molecule Abundances |

|
Click to View the Clearer Original Diagram |
| The Studied Tissue | White matter | |
| The Specified Disease | Glioma | |
| The Expression Level of Disease Section Compare with the Healthy Individual Tissue | p-value: 4.96E-01; Fold-change: 2.73E-01; Z-score: 4.14E-01 | |
|
Molecule expression in the diseased tissue of patients
Molecule expression in the normal tissue of healthy individuals
|
||
| Disease-specific Molecule Abundances |

|
Click to View the Clearer Original Diagram |
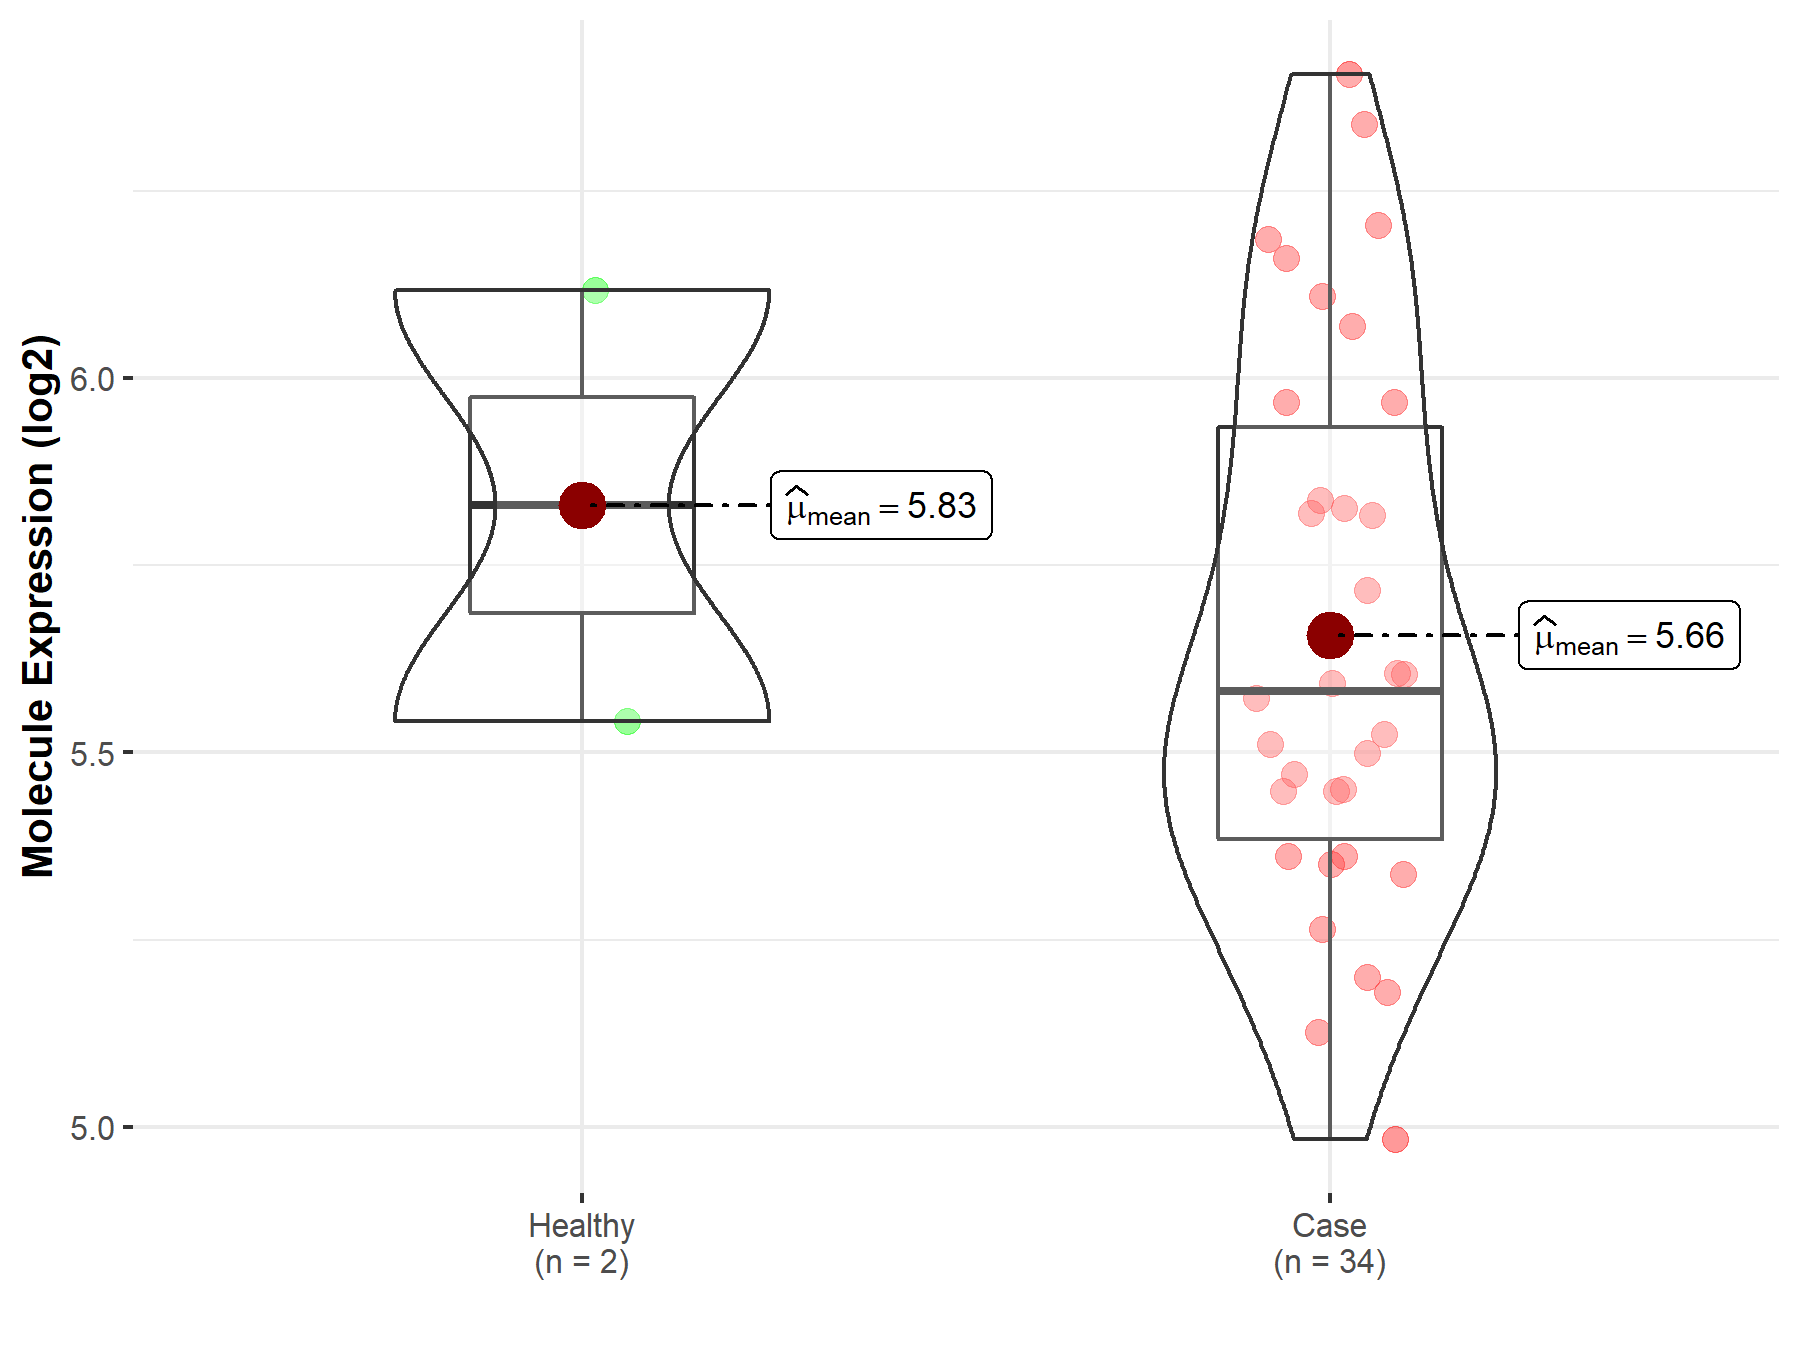
| The Studied Tissue | Brainstem tissue | |
| The Specified Disease | Neuroectodermal tumor | |
| The Expression Level of Disease Section Compare with the Healthy Individual Tissue | p-value: 5.91E-02; Fold-change: 1.52E-01; Z-score: 5.09E-01 | |
|
Molecule expression in the diseased tissue of patients
Molecule expression in the normal tissue of healthy individuals
|
||
| Disease-specific Molecule Abundances |

|
Click to View the Clearer Original Diagram |
| Differential expression of molecule in resistant diseases | ||
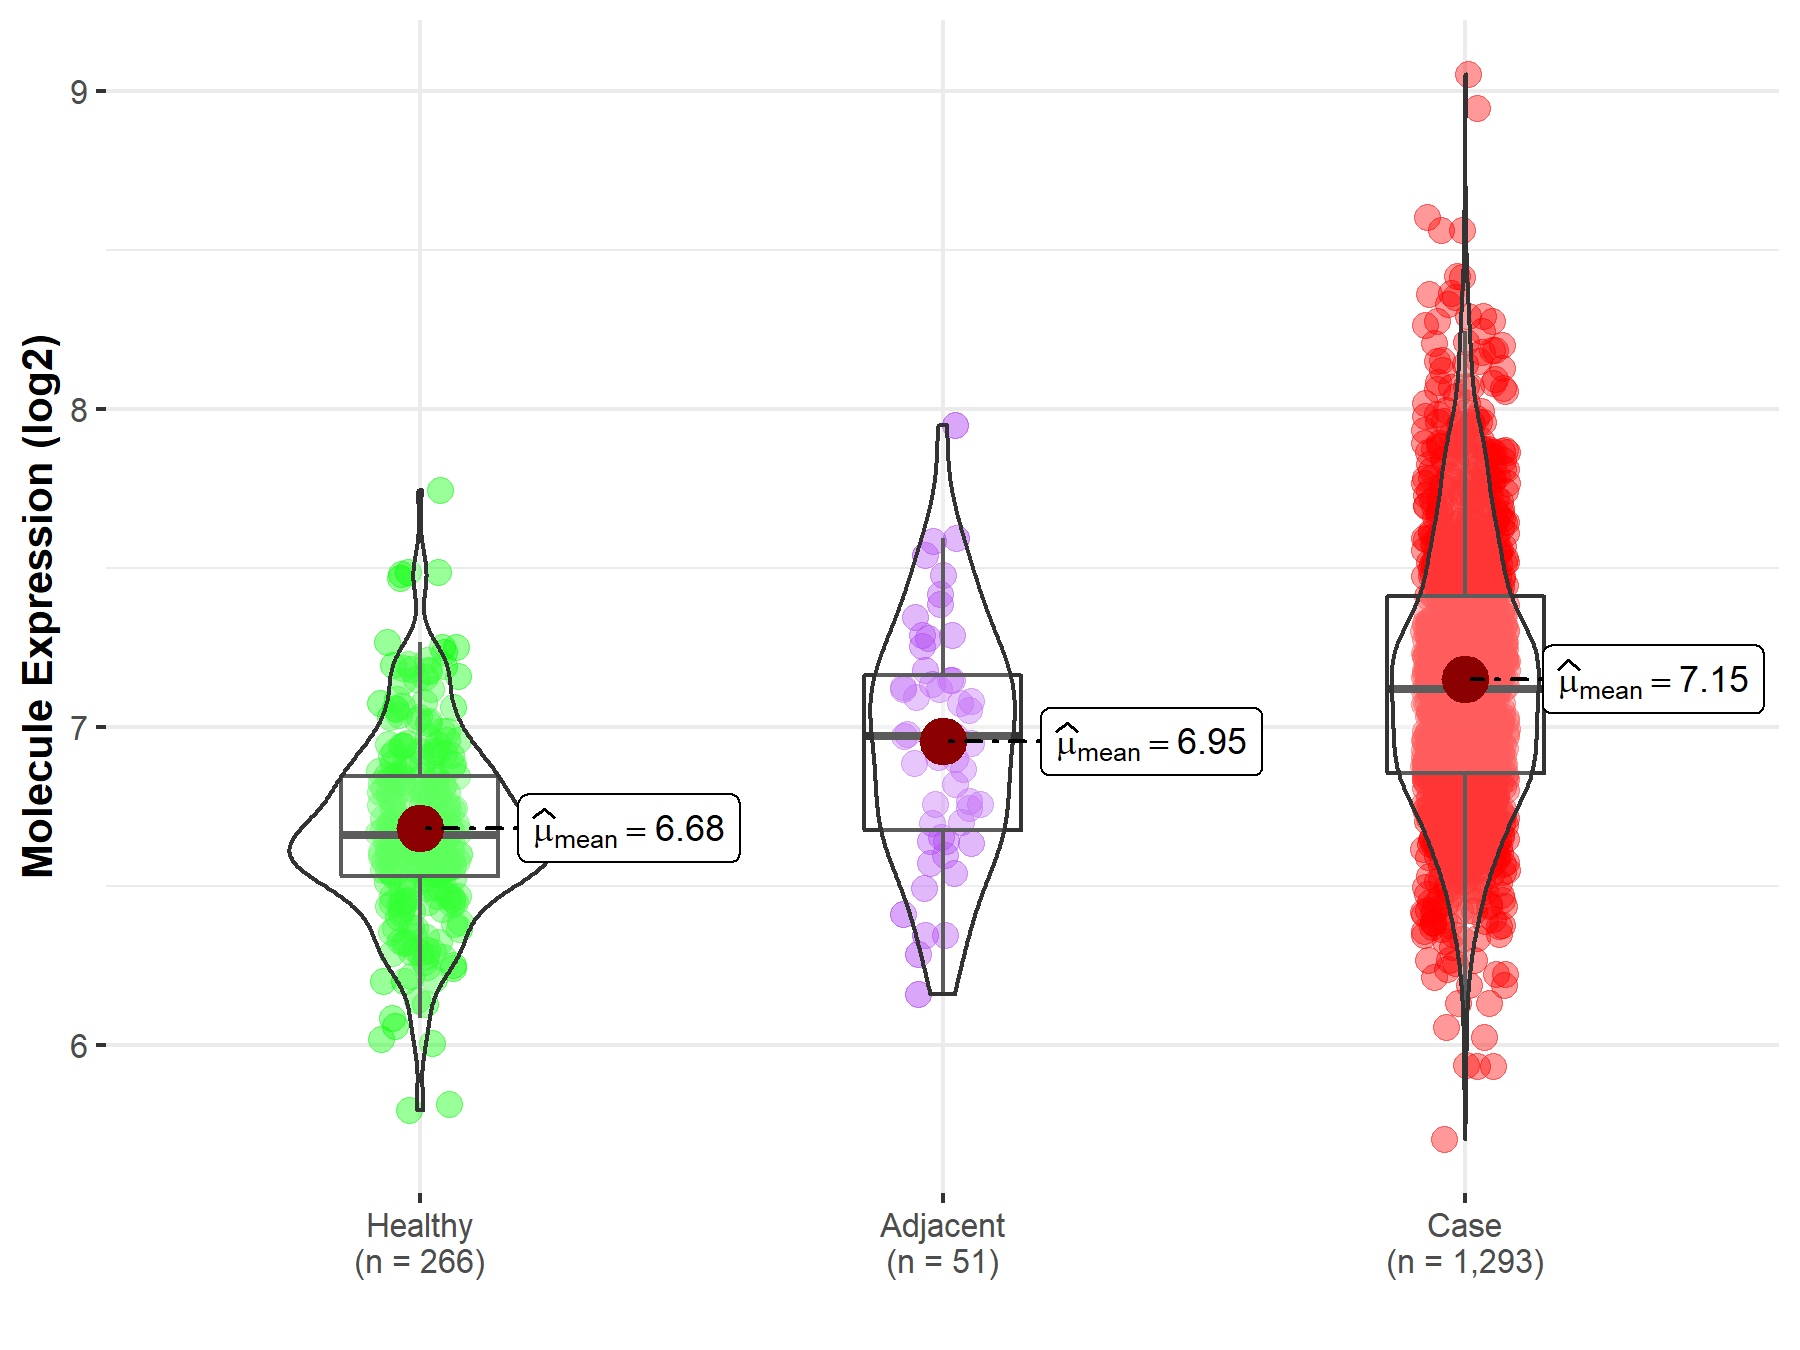
| The Studied Tissue | Breast tissue | |
| The Specified Disease | Breast cancer | |
| The Expression Level of Disease Section Compare with the Healthy Individual Tissue | p-value: 2.79E-76; Fold-change: 4.57E-01; Z-score: 1.58E+00 | |
| The Expression Level of Disease Section Compare with the Adjacent Tissue | p-value: 6.81E-04; Fold-change: 1.48E-01; Z-score: 3.92E-01 | |
|
Molecule expression in the normal tissue adjacent to the diseased tissue of patients
Molecule expression in the diseased tissue of patients
Molecule expression in the normal tissue of healthy individuals
|
||
| Disease-specific Molecule Abundances |

|
Click to View the Clearer Original Diagram |
| Differential expression of molecule in resistant diseases | ||
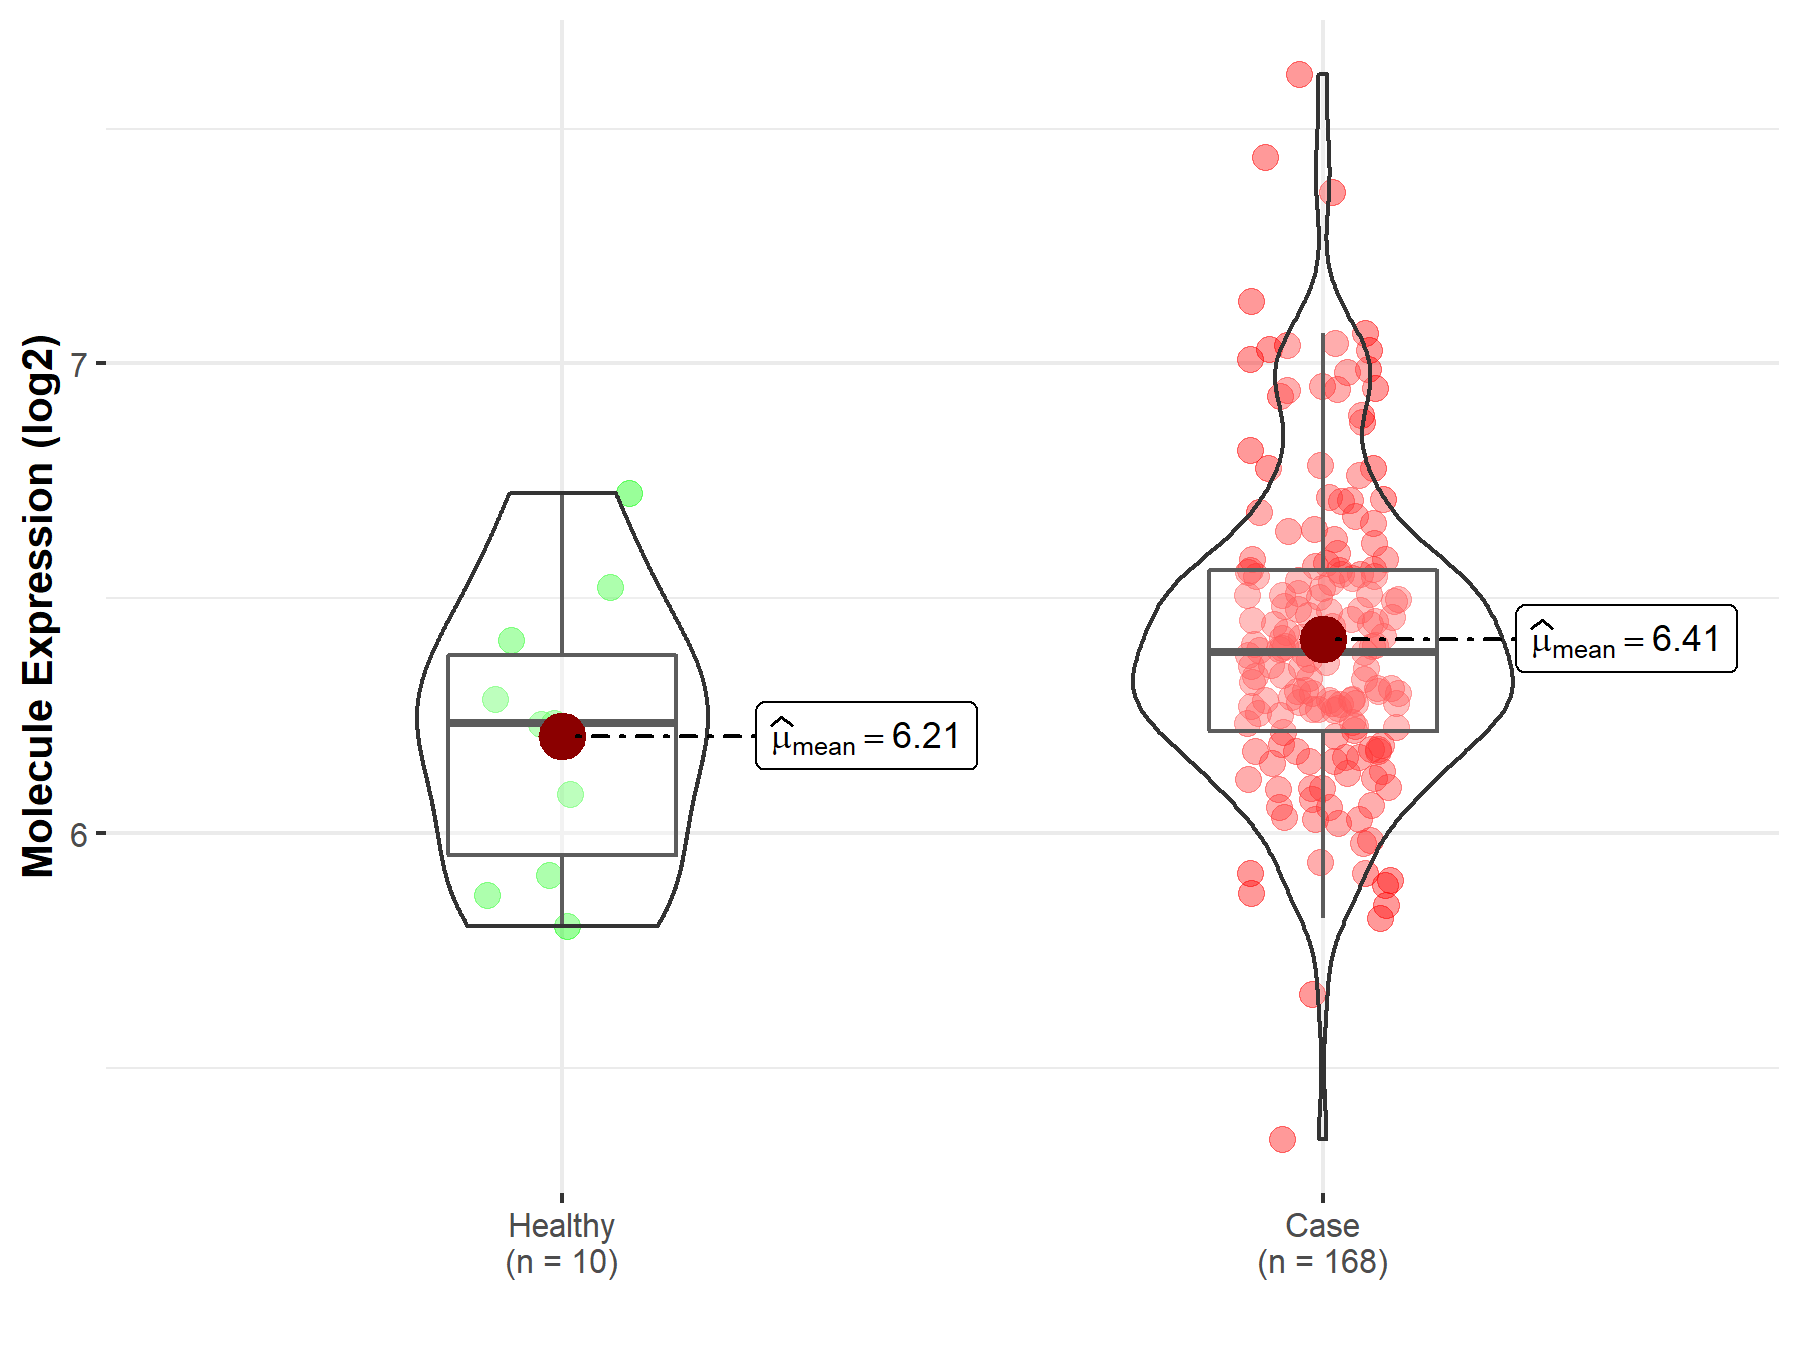
| The Studied Tissue | Ovary | |
| The Specified Disease | Ovarian cancer | |
| The Expression Level of Disease Section Compare with the Healthy Individual Tissue | p-value: 4.14E-05; Fold-change: 8.84E-01; Z-score: 2.67E+00 | |
| The Expression Level of Disease Section Compare with the Adjacent Tissue | p-value: 5.10E-03; Fold-change: 6.93E-01; Z-score: 1.13E+00 | |
|
Molecule expression in the normal tissue adjacent to the diseased tissue of patients
Molecule expression in the diseased tissue of patients
Molecule expression in the normal tissue of healthy individuals
|
||
| Disease-specific Molecule Abundances |

|
Click to View the Clearer Original Diagram |
Tissue-specific Molecule Abundances in Healthy Individuals


|
||
References
If you find any error in data or bug in web service, please kindly report it to Dr. Sun and Dr. Yu.
