Molecule Information
General Information of the Molecule (ID: Mol00127)
| Name |
DNA-binding factor KBF1 (p105) (NFKB1)
,Homo sapiens
|
||||
|---|---|---|---|---|---|
| Synonyms |
DNA-binding factor KBF1; EBP-1; Nuclear factor of kappa light polypeptide gene enhancer in B-cells 1
Click to Show/Hide
|
||||
| Molecule Type |
Protein
|
||||
| Gene Name |
NFKB1
|
||||
| Gene ID | |||||
| Location |
chr4:102501331-102617302[+]
|
||||
| Sequence |
MAEDDPYLGRPEQMFHLDPSLTHTIFNPEVFQPQMALPTDGPYLQILEQPKQRGFRFRYV
CEGPSHGGLPGASSEKNKKSYPQVKICNYVGPAKVIVQLVTNGKNIHLHAHSLVGKHCED GICTVTAGPKDMVVGFANLGILHVTKKKVFETLEARMTEACIRGYNPGLLVHPDLAYLQA EGGGDRQLGDREKELIRQAALQQTKEMDLSVVRLMFTAFLPDSTGSFTRRLEPVVSDAIY DSKAPNASNLKIVRMDRTAGCVTGGEEIYLLCDKVQKDDIQIRFYEEEENGGVWEGFGDF SPTDVHRQFAIVFKTPKYKDINITKPASVFVQLRRKSDLETSEPKPFLYYPEIKDKEEVQ RKRQKLMPNFSDSFGGGSGAGAGGGGMFGSGGGGGGTGSTGPGYSFPHYGFPTYGGITFH PGTTKSNAGMKHGTMDTESKKDPEGCDKSDDKNTVNLFGKVIETTEQDQEPSEATVGNGE VTLTYATGTKEESAGVQDNLFLEKAMQLAKRHANALFDYAVTGDVKMLLAVQRHLTAVQD ENGDSVLHLAIIHLHSQLVRDLLEVTSGLISDDIINMRNDLYQTPLHLAVITKQEDVVED LLRAGADLSLLDRLGNSVLHLAAKEGHDKVLSILLKHKKAALLLDHPNGDGLNAIHLAMM SNSLPCLLLLVAAGADVNAQEQKSGRTALHLAVEHDNISLAGCLLLEGDAHVDSTTYDGT TPLHIAAGRGSTRLAALLKAAGADPLVENFEPLYDLDDSWENAGEDEGVVPGTTPLDMAT SWQVFDILNGKPYEPEFTSDDLLAQGDMKQLAEDVKLQLYKLLEIPDPDKNWATLAQKLG LGILNNAFRLSPAPSKTLMDNYEVSGGTVRELVEALRQMGYTEAIEVIQAASSPVKTTSQ AHSLPLSPASTRQQIDELRDSDSVCDSGVETSFRKLSFTESLTSGASLLTLNKMPHDYGQ EGPLEGKI Click to Show/Hide
|
||||
| 3D-structure |
|
||||
| Function |
NF-kappa-B is a pleiotropic transcription factor present in almost all cell types and is the endpoint of a series of signal transduction events that are initiated by a vast array of stimuli related to many biological processes such as inflammation, immunity, differentiation, cell growth, tumorigenesis and apoptosis. NF-kappa-B is a homo- or heterodimeric complex formed by the Rel-like domain-containing proteins RELA/p65, RELB, NFKB1/p105, NFKB1/p50, REL and NFKB2/p52 and the heterodimeric p65-p50 complex appears to be most abundant one. The dimers bind at kappa-B sites in the DNA of their target genes and the individual dimers have distinct preferences for different kappa-B sites that they can bind with distinguishable affinity and specificity. Different dimer combinations act as transcriptional activators or repressors, respectively. NF-kappa-B is controlled by various mechanisms of post-translational modification and subcellular compartmentalization as well as by interactions with other cofactors or corepressors. NF-kappa-B complexes are held in the cytoplasm in an inactive state complexed with members of the NF-kappa-B inhibitor (I-kappa-B) family. In a conventional activation pathway, I-kappa-B is phosphorylated by I-kappa-B kinases (IKKs) in response to different activators, subsequently degraded thus liberating the active NF-kappa-B complex which translocates to the nucleus. NF-kappa-B heterodimeric p65-p50 and RelB-p50 complexes are transcriptional activators. The NF-kappa-B p50-p50 homodimer is a transcriptional repressor, but can act as a transcriptional activator when associated with BCL3. NFKB1 appears to have dual functions such as cytoplasmic retention of attached NF-kappa-B proteins by p105 and generation of p50 by a cotranslational processing. The proteasome-mediated process ensures the production of both p50 and p105 and preserves their independent function, although processing of NFKB1/p105 also appears to occur post-translationally. p50 binds to the kappa-B consensus sequence 5'-GGRNNYYCC-3', located in the enhancer region of genes involved in immune response and acute phase reactions. In a complex with MAP3K8, NFKB1/p105 represses MAP3K8-induced MAPK signaling; active MAP3K8 is released by proteasome-dependent degradation of NFKB1/p105.
Click to Show/Hide
|
||||
| Uniprot ID | |||||
| Ensembl ID | |||||
| HGNC ID | |||||
| Click to Show/Hide the Complete Species Lineage | |||||
Type(s) of Resistant Mechanism of This Molecule
Drug Resistance Data Categorized by Drug
Investigative Drug(s)
1 drug(s) in total
| Drug Resistance Data Categorized by Their Corresponding Mechanisms | ||||
|
|
||||
| Disease Class: Breast cancer [ICD-11: 2C60.3] | [1] | |||
| Resistant Disease | Breast cancer [ICD-11: 2C60.3] | |||
| Resistant Drug | Platinum | |||
| Molecule Alteration | Expression | Down-regulation |
||
| Differential expression of the molecule in resistant disease | ||||
| Classification of Disease | Breast cancer [ICD-11: 2C60] | |||
| The Specified Disease | Breast cancer | |||
| The Studied Tissue | Breast tissue | |||
| The Expression Level of Disease Section Compare with the Healthy Individual Tissue | p-value: 2.13E-01 Fold-change: -6.48E-03 Z-score: -1.25E+00 |
|||
| Experimental Note | Revealed Based on the Cell Line Data | |||
| In Vitro Model | MCF-7 cells | Breast | Homo sapiens (Human) | CVCL_0031 |
| MDA-MB-231 cells | Breast | Homo sapiens (Human) | CVCL_0062 | |
| SkBR3 cells | Breast | Homo sapiens (Human) | CVCL_0033 | |
| In Vivo Model | Nude mouse xenograft model | Mus musculus | ||
| Experiment for Molecule Alteration |
Luciferase reporter assay | |||
| Experiment for Drug Resistance |
Caspase 3/7 cleavage assays; Aldefluor assay; MTS assay; Flow cytometric analysis | |||
| Mechanism Description | Blocking the EZH2-interactiing domain of HOTAIR and disrupting the HOTAIR-EZH2 interaction resensitizes cancer cells to clinically relevant cytotoxic chemotherapies, reduces cell invasion and decreases NF-kB transcriptional activity and IL-6 and MMP-9 expression in vivo. NF-kB-mediated transcriptional regulation of HOTAIR induced epigenetic silencing of Ik-Balpha, resulting in a positive feedback loop that ultimately increased NF-kB activation in ovarian cancer. | |||
Approved Drug(s)
3 drug(s) in total
| Drug Resistance Data Categorized by Their Corresponding Mechanisms | ||||
|
|
||||
| Disease Class: Colon cancer [ICD-11: 2B90.1] | [2] | |||
| Resistant Disease | Colon cancer [ICD-11: 2B90.1] | |||
| Resistant Drug | Fluorouracil | |||
| Molecule Alteration | Expression | Down-regulation |
||
| Differential expression of the molecule in resistant disease | ||||
| Classification of Disease | Colon cancer [ICD-11: 2B90] | |||
| The Specified Disease | Colon cancer | |||
| The Studied Tissue | Colon tissue | |||
| The Expression Level of Disease Section Compare with the Healthy Individual Tissue | p-value: 3.70E-46 Fold-change: -7.40E-02 Z-score: -1.70E+01 |
|||
| Experimental Note | Revealed Based on the Cell Line Data | |||
| Cell Pathway Regulation | Cell apoptosis | Activation | hsa04210 | |
| NF-kappaB signaling pathway | Inhibition | hsa04064 | ||
| In Vitro Model | DLD1 cells | Colon | Homo sapiens (Human) | CVCL_0248 |
| SW620 cells | Colon | Homo sapiens (Human) | CVCL_0547 | |
| HCT116 cells | Colon | Homo sapiens (Human) | CVCL_0291 | |
| NCM460 cells | Colon | Homo sapiens (Human) | CVCL_0460 | |
| SW1116 cells | Colon | Homo sapiens (Human) | CVCL_0544 | |
| In Vivo Model | Nude mouse xenograft model | Mus musculus | ||
| Experiment for Molecule Alteration |
Western blot analysis; Dual-Luciferase Reporter Assay | |||
| Experiment for Drug Resistance |
CellTiter-Glo Luminescent Cell Viability Assay; CCK8 assay; Flow cytometric analysis | |||
| Mechanism Description | miR15b-5p resensitizes colon cancer cells to 5-fluorouracil by promoting apoptosis via the NF-kB/XIAP axis. miR15b-5p results in significant reductions in the levels of NF-kB1 and Ikk-alpha, two key modulators in inflammation and cell apoptosis. | |||
| Disease Class: Colorectal cancer [ICD-11: 2B91.1] | [3] | |||
| Resistant Disease | Colorectal cancer [ICD-11: 2B91.1] | |||
| Resistant Drug | Fluorouracil | |||
| Molecule Alteration | Expression | Up-regulation |
||
| Experimental Note | Revealed Based on the Cell Line Data | |||
| Cell Pathway Regulation | Cell metastasis | Activation | hsa05205 | |
| NF-kB signaling pathway | Activation | hsa04218 | ||
| In Vitro Model | HT29 Cells | Colon | Homo sapiens (Human) | CVCL_A8EZ |
| SW480 cells | Colon | Homo sapiens (Human) | CVCL_0546 | |
| Experiment for Molecule Alteration |
Western blot analysis; luciferase reporter assay;ChIP | |||
| Experiment for Drug Resistance |
CCK8 assay | |||
| Mechanism Description | HOTAIR contributes to 5FU resistance through suppressing miR-218 and activating NF-kB signaling in CRC. | |||
| Disease Class: Colorectal cancer [ICD-11: 2B91.1] | [3] | |||
| Resistant Disease | Colorectal cancer [ICD-11: 2B91.1] | |||
| Resistant Drug | Fluorouracil | |||
| Molecule Alteration | Phosphorylation | Up-regulation |
||
| Experimental Note | Identified from the Human Clinical Data | |||
| Cell Pathway Regulation | NF-kB signaling pathway | Activation | hsa04218 | |
| In Vitro Model | HT29 Cells | Colon | Homo sapiens (Human) | CVCL_A8EZ |
| SW480 cells | Colon | Homo sapiens (Human) | CVCL_0546 | |
| FHC cells | Colon | Homo sapiens (Human) | CVCL_3688 | |
| Experiment for Molecule Alteration |
Western blot analysis | |||
| Experiment for Drug Resistance |
CCK8 assay; Colony formation assays | |||
| Mechanism Description | LncRNA HOTAIR contributes to 5fu resistance through suppressing miR-218 and activating NF-kB/TS signaling in colorectal cancer. | |||
| Drug Sensitivity Data Categorized by Their Corresponding Mechanisms | ||||
|
|
||||
| Disease Class: Liver cancer [ICD-11: 2C12.6] | [4] | |||
| Sensitive Disease | Liver cancer [ICD-11: 2C12.6] | |||
| Sensitive Drug | Fluorouracil | |||
| Molecule Alteration | Phosphorylation | Down-regulation |
||
| Experimental Note | Revealed Based on the Cell Line Data | |||
| Cell Pathway Regulation | Cell apoptosis | Inhibition | hsa04210 | |
| Cell colony | Activation | hsa05200 | ||
| Cell viability | Activation | hsa05200 | ||
| In Vitro Model | Huh-7 cells | Liver | Homo sapiens (Human) | CVCL_0336 |
| BEL-7402 cells | Liver | Homo sapiens (Human) | CVCL_5492 | |
| HepG2 cells | Liver | Homo sapiens (Human) | CVCL_0027 | |
| HCCLM3 cells | Liver | Homo sapiens (Human) | CVCL_6832 | |
| Hep3B cells | Liver | Homo sapiens (Human) | CVCL_0326 | |
| SMMC7721 cells | Uterus | Homo sapiens (Human) | CVCL_0534 | |
| MHCC97-L cells | Liver | Homo sapiens (Human) | CVCL_4973 | |
| In Vivo Model | Nude mouse xenograft model | Mus musculus | ||
| Experiment for Molecule Alteration |
Western blot analysis | |||
| Experiment for Drug Resistance |
CCK8 analysis; EdU analysis; Boyden chamber assay; Transwell assay; Flow cytometry assay | |||
| Mechanism Description | MALAT1 deficiency related increase in sensitivity of liver cancer cells was associated with regulation of NF-kB. | |||
| Drug Resistance Data Categorized by Their Corresponding Mechanisms | ||||
|
|
||||
| Disease Class: Endometriosis [ICD-11: GA10.0] | [5] | |||
| Resistant Disease | Endometriosis [ICD-11: GA10.0] | |||
| Resistant Drug | Fotemustine | |||
| Molecule Alteration | Expression | Up-regulation |
||
| Experimental Note | Discovered Using In-vivo Testing Model | |||
| Cell Pathway Regulation | MAPK signaling pathway | Activation | hsa04010 | |
| In Vivo Model | Female Sprague-Dawley rats model | Rattus norvegicus | ||
| Experiment for Molecule Alteration |
Western blot analysis | |||
| Mechanism Description | Fotemustine and dexamethasone administration had anti-apoptotic activity, restoring the impaired mechanism (TUNEL assay and Western blot analysis of Bax and Bcl-2). Moreover, no gastric disfunction was detected (histological analysis of stomachs). Thus, our data showed that the combined therapy of fotemustine and dexamethasone reduced endometriosis-induced inflammation, hyperproliferation and apoptosis resistance. | |||
| Drug Resistance Data Categorized by Their Corresponding Mechanisms | ||||
|
|
||||
| Disease Class: Lung cancer [ICD-11: 2C25.5] | [6] | |||
| Resistant Disease | Lung cancer [ICD-11: 2C25.5] | |||
| Resistant Drug | Gefitinib | |||
| Molecule Alteration | Missense mutation | p.G489V |
||
| Experimental Note | Identified from the Human Clinical Data | |||
| Cell Pathway Regulation | Angiogenic potential | Inhibition | hsa04370 | |
| In Vitro Model | Plasma | Blood | Homo sapiens (Human) | N.A. |
| Experiment for Molecule Alteration |
Circulating-free DNA assay; Whole exome sequencing assay | |||
| Mechanism Description | Quantification of allele fractions in plasma identified increased representation of mutant alleles in association with emergence of therapy resistance. | |||
| Disease Class: Lung cancer [ICD-11: 2C25.5] | [6] | |||
| Resistant Disease | Lung cancer [ICD-11: 2C25.5] | |||
| Resistant Drug | Gefitinib | |||
| Molecule Alteration | Missense mutation | p.G489V |
||
| Experimental Note | Identified from the Human Clinical Data | |||
| Experiment for Molecule Alteration |
Circulating-free DNA assay; Whole exome sequencing assay | |||
| Mechanism Description | Quantification of allele fractions in plasma identified increased representation of mutant alleles in association with emergence of therapy resistance. | |||
Disease- and Tissue-specific Abundances of This Molecule
ICD Disease Classification 02

| Differential expression of molecule in resistant diseases | ||
| The Studied Tissue | Colon | |
| The Specified Disease | Colon cancer | |
| The Expression Level of Disease Section Compare with the Healthy Individual Tissue | p-value: 3.70E-46; Fold-change: -4.44E-01; Z-score: -1.65E+00 | |
| The Expression Level of Disease Section Compare with the Adjacent Tissue | p-value: 9.76E-01; Fold-change: 1.15E-01; Z-score: 2.32E-01 | |
|
Molecule expression in the normal tissue adjacent to the diseased tissue of patients
Molecule expression in the diseased tissue of patients
Molecule expression in the normal tissue of healthy individuals
|
||
| Disease-specific Molecule Abundances |
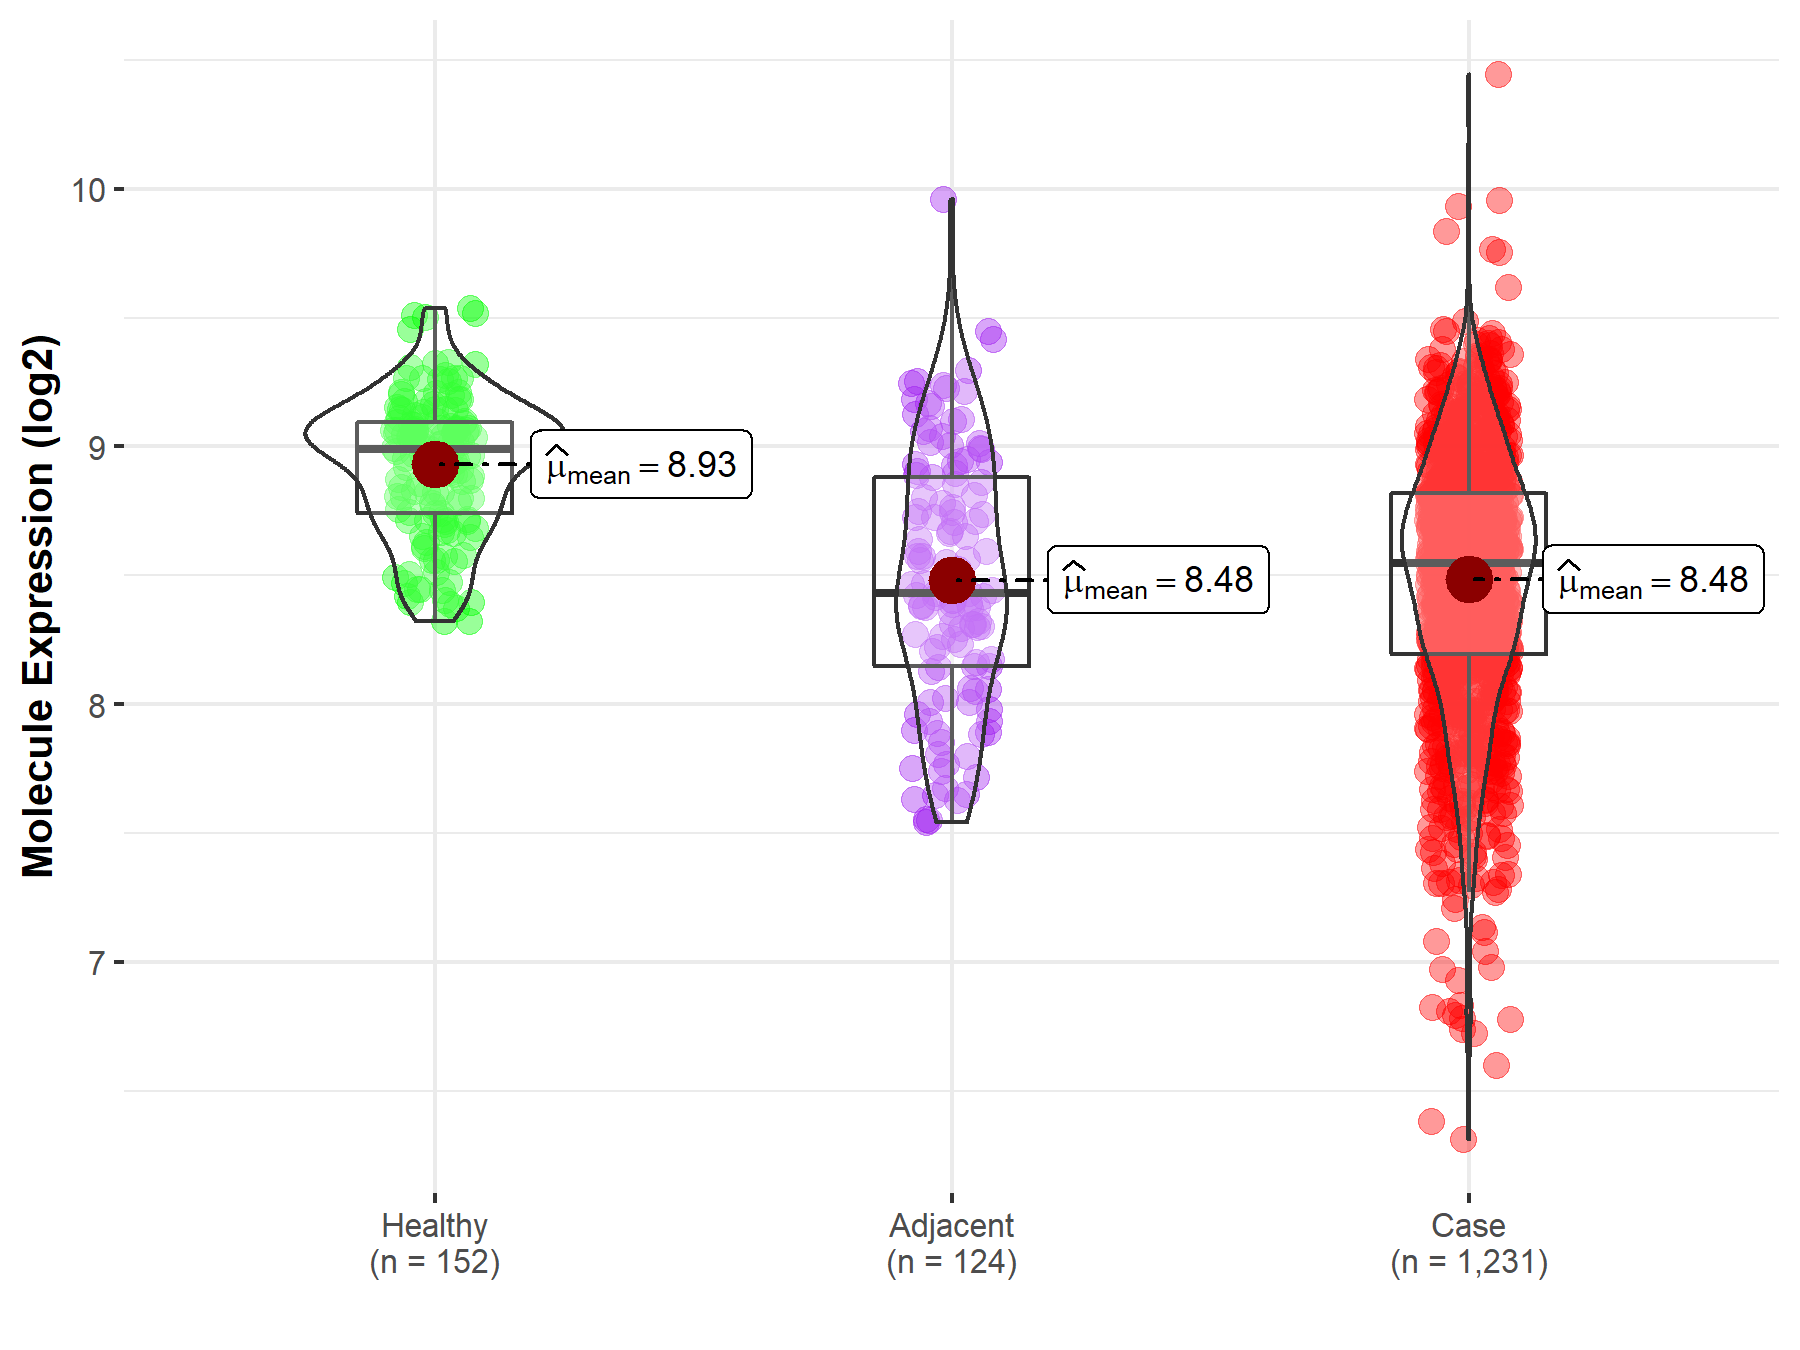
|
Click to View the Clearer Original Diagram |
| Differential expression of molecule in resistant diseases | ||
| The Studied Tissue | Liver | |
| The Specified Disease | Liver cancer | |
| The Expression Level of Disease Section Compare with the Healthy Individual Tissue | p-value: 7.59E-02; Fold-change: -1.07E-01; Z-score: -2.90E-01 | |
| The Expression Level of Disease Section Compare with the Adjacent Tissue | p-value: 8.25E-07; Fold-change: -1.80E-01; Z-score: -4.68E-01 | |
| The Expression Level of Disease Section Compare with the Other Disease Section | p-value: 3.92E-01; Fold-change: -2.77E-01; Z-score: -5.27E-01 | |
|
Molecule expression in the normal tissue adjacent to the diseased tissue of patients
Molecule expression in the diseased tissue of patients
Molecule expression in the normal tissue of healthy individuals
Molecule expression in tissue other than the diseased tissue of patients
|
||
| Disease-specific Molecule Abundances |
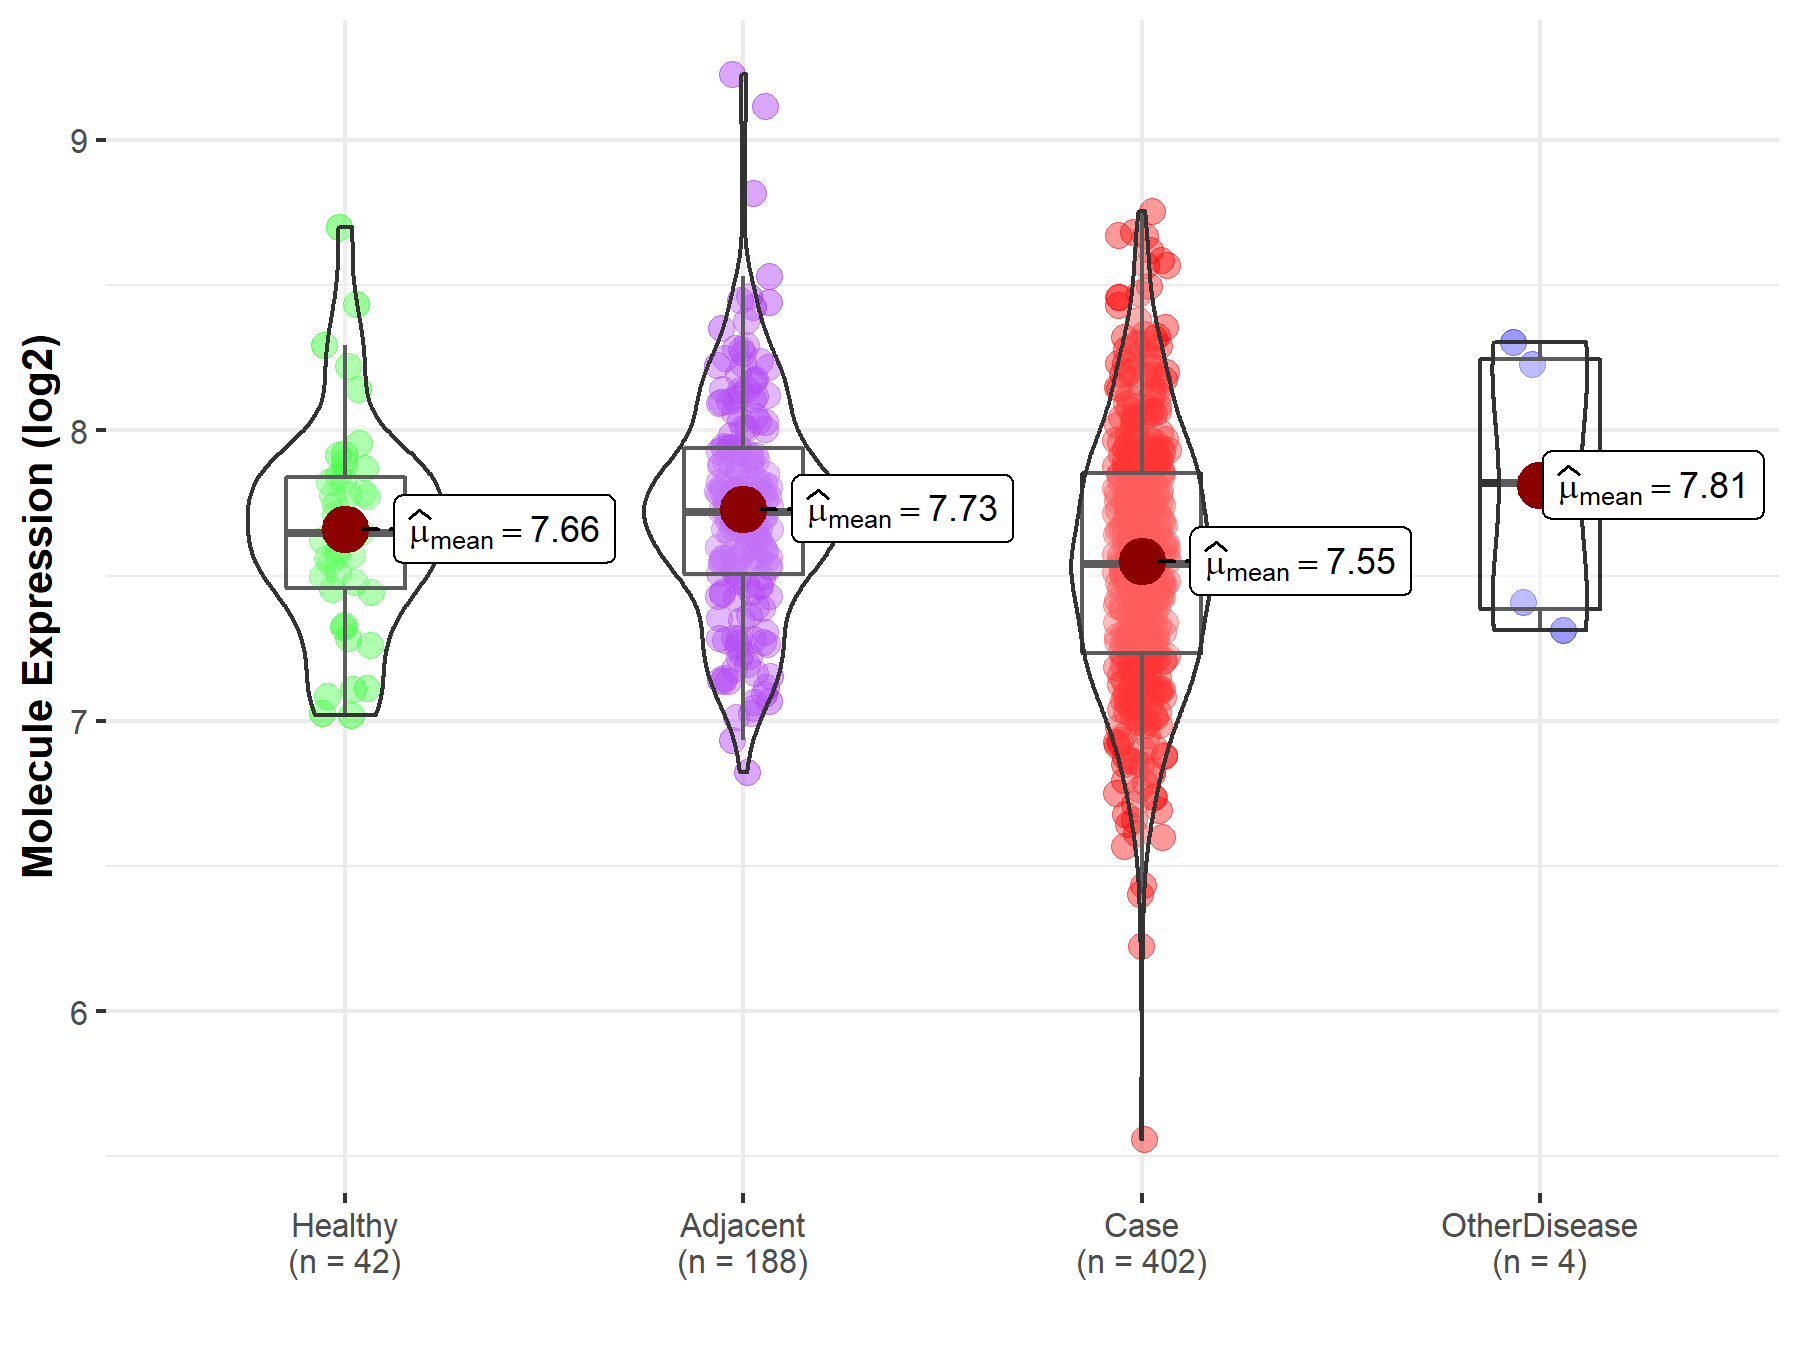
|
Click to View the Clearer Original Diagram |
| Differential expression of molecule in resistant diseases | ||
| The Studied Tissue | Lung | |
| The Specified Disease | Lung cancer | |
| The Expression Level of Disease Section Compare with the Healthy Individual Tissue | p-value: 2.38E-26; Fold-change: -3.22E-01; Z-score: -6.41E-01 | |
| The Expression Level of Disease Section Compare with the Adjacent Tissue | p-value: 4.15E-22; Fold-change: -4.14E-01; Z-score: -7.88E-01 | |
|
Molecule expression in the normal tissue adjacent to the diseased tissue of patients
Molecule expression in the diseased tissue of patients
Molecule expression in the normal tissue of healthy individuals
|
||
| Disease-specific Molecule Abundances |
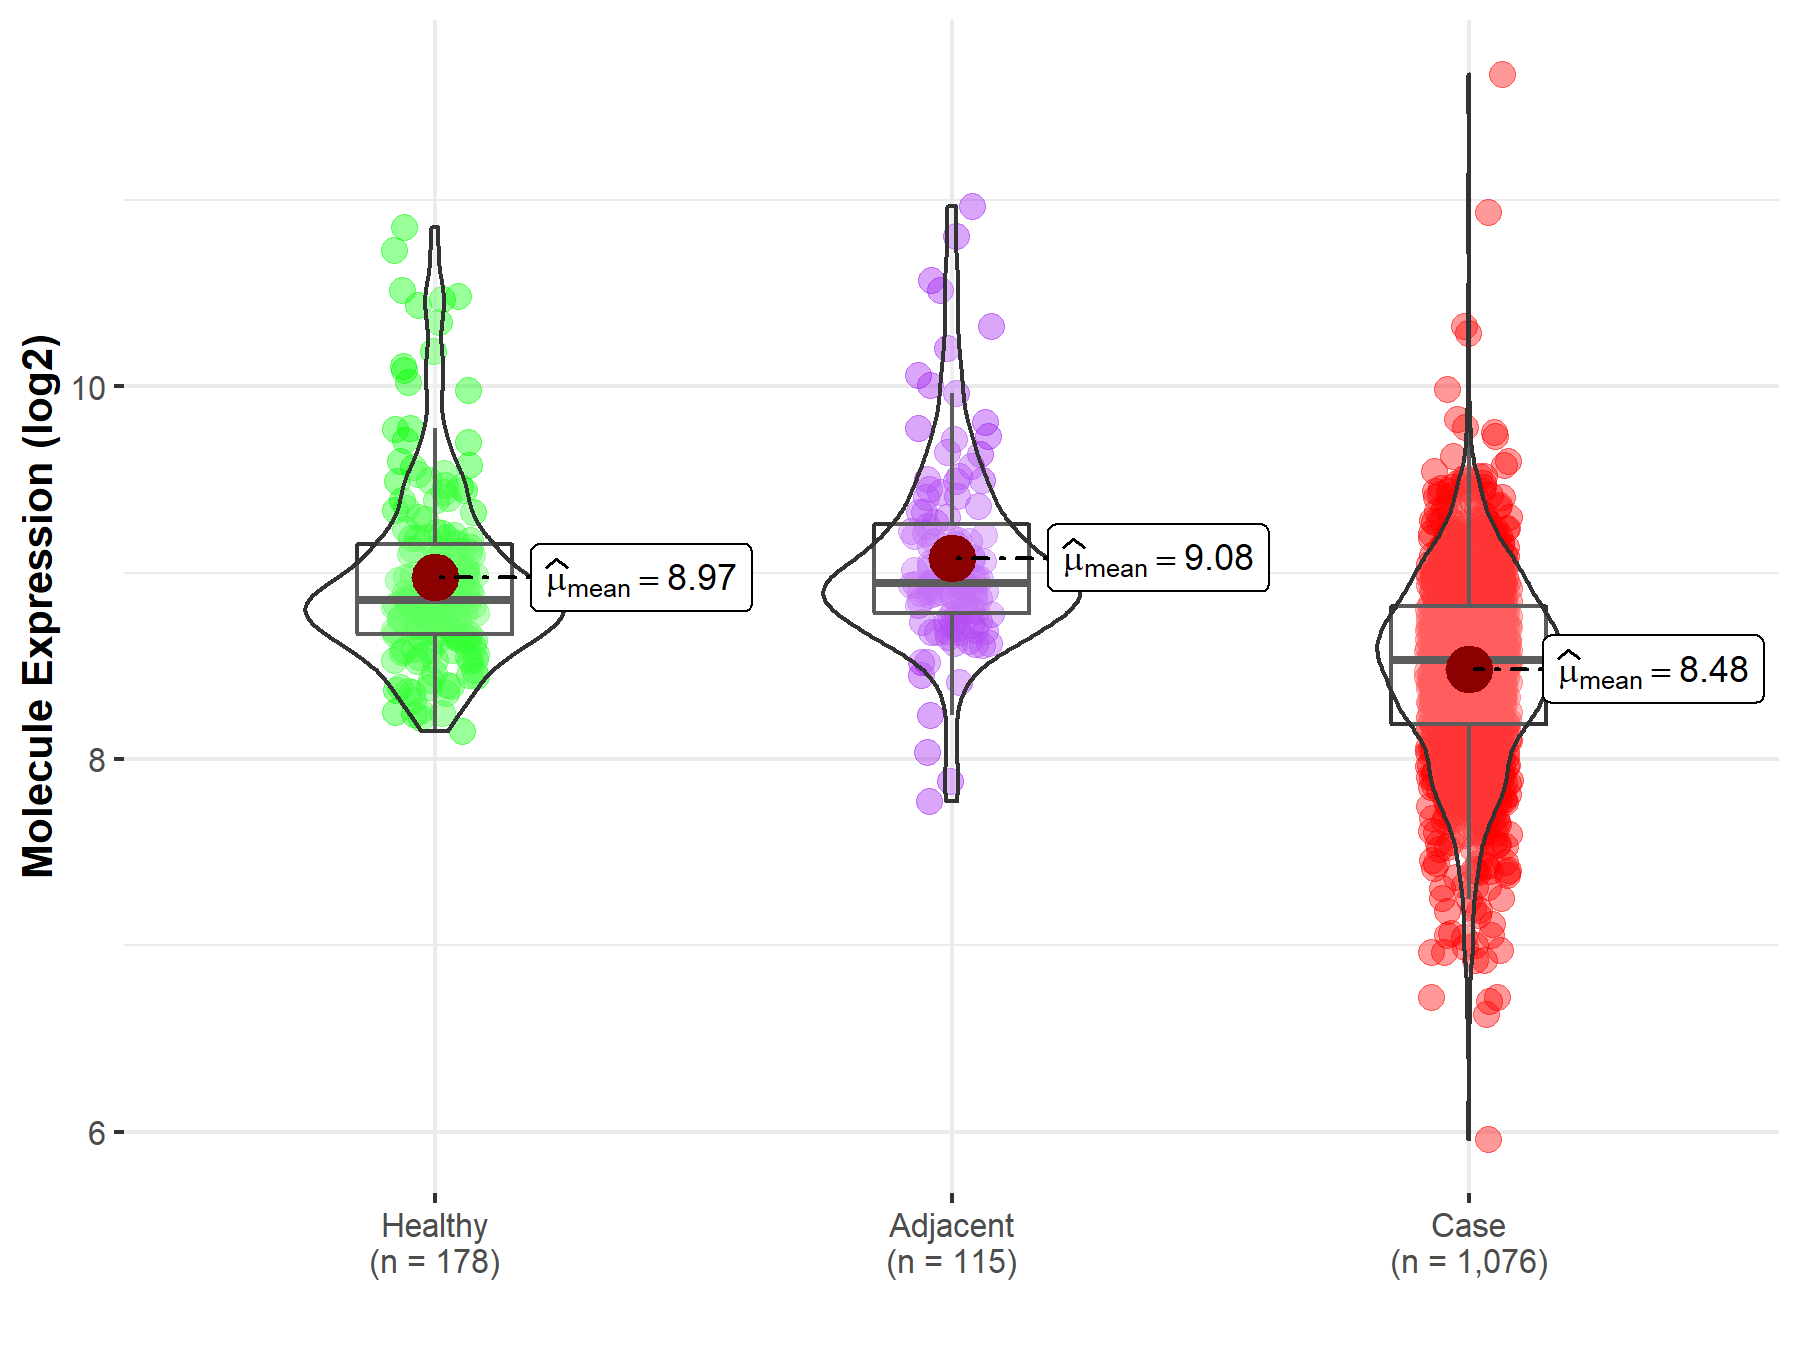
|
Click to View the Clearer Original Diagram |
| Differential expression of molecule in resistant diseases | ||
| The Studied Tissue | Breast tissue | |
| The Specified Disease | Breast cancer | |
| The Expression Level of Disease Section Compare with the Healthy Individual Tissue | p-value: 2.13E-01; Fold-change: -7.31E-02; Z-score: -1.72E-01 | |
| The Expression Level of Disease Section Compare with the Adjacent Tissue | p-value: 2.02E-01; Fold-change: -9.12E-02; Z-score: -2.17E-01 | |
|
Molecule expression in the normal tissue adjacent to the diseased tissue of patients
Molecule expression in the diseased tissue of patients
Molecule expression in the normal tissue of healthy individuals
|
||
| Disease-specific Molecule Abundances |

|
Click to View the Clearer Original Diagram |
ICD Disease Classification 16

| Differential expression of molecule in resistant diseases | ||
| The Studied Tissue | Endometrium | |
| The Specified Disease | Endometriosis | |
| The Expression Level of Disease Section Compare with the Healthy Individual Tissue | p-value: 2.55E-01; Fold-change: -6.41E-03; Z-score: -1.31E-02 | |
|
Molecule expression in the diseased tissue of patients
Molecule expression in the normal tissue of healthy individuals
|
||
| Disease-specific Molecule Abundances |
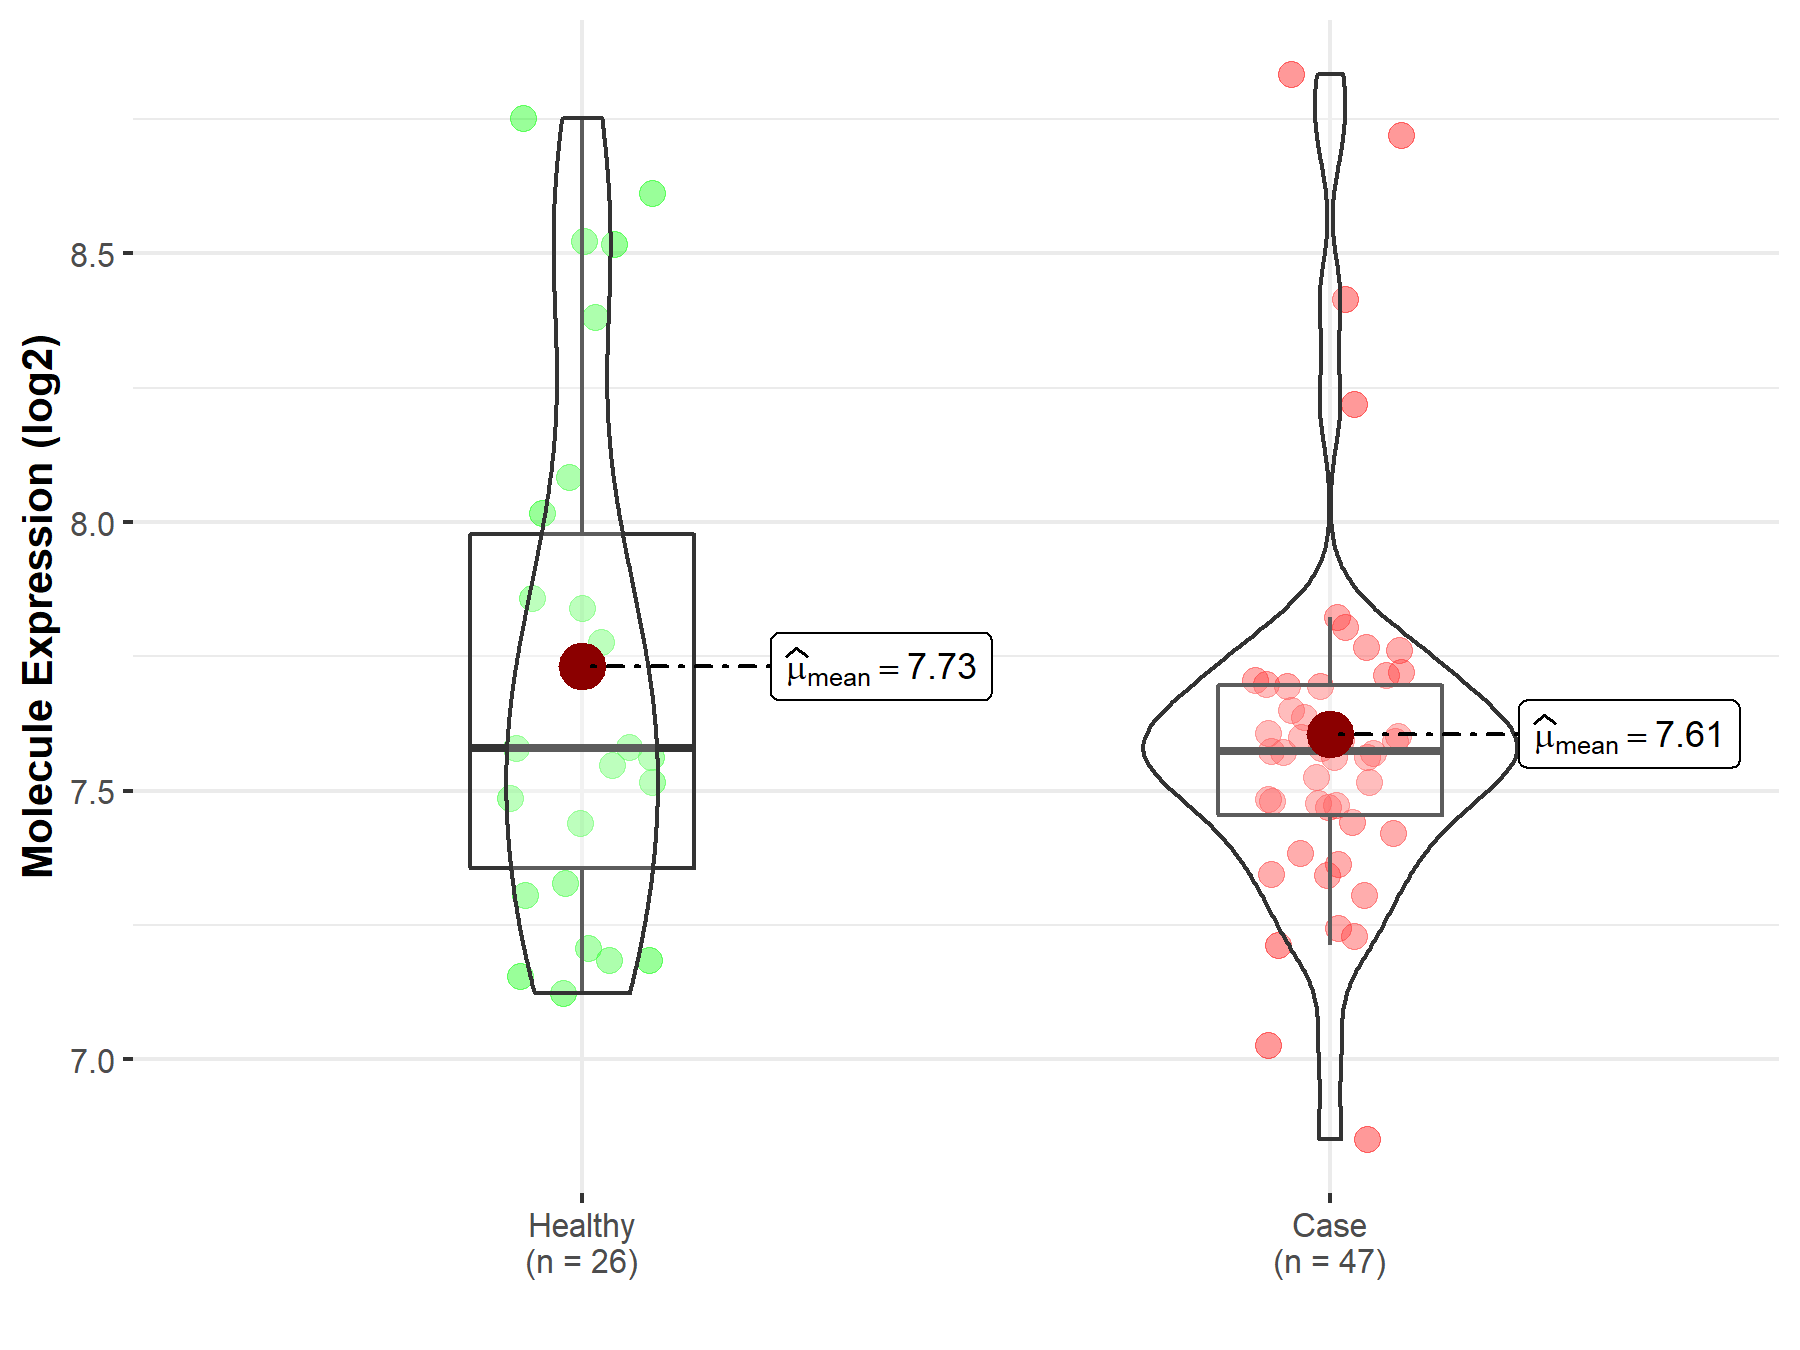
|
Click to View the Clearer Original Diagram |
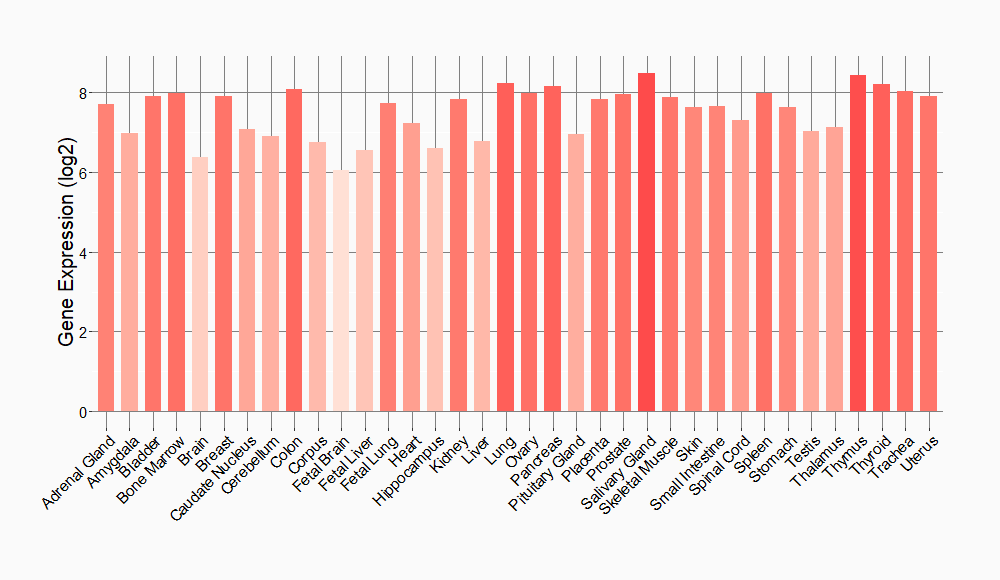
Tissue-specific Molecule Abundances in Healthy Individuals

|
||
References
If you find any error in data or bug in web service, please kindly report it to Dr. Sun and Dr. Yu.
