Molecule Information
General Information of the Molecule (ID: Mol00122)
| Name |
Serine/threonine-protein kinase mTOR (mTOR)
,Homo sapiens
|
||||
|---|---|---|---|---|---|
| Synonyms |
FK506-binding protein 12-rapamycin complex-associated protein 1; FKBP12-rapamycin complex-associated protein; Mammalian target of rapamycin; mTOR; Mechanistic target of rapamycin; Rapamycin and FKBP12 target 1; Rapamycin target protein 1; FRAP; FRAP1; FRAP2; RAFT1; RAPT1
Click to Show/Hide
|
||||
| Molecule Type |
Protein
|
||||
| Gene Name |
MTOR
|
||||
| Gene ID | |||||
| Location |
chr1:11106535-11262551[-]
|
||||
| Sequence |
MLGTGPAAATTAATTSSNVSVLQQFASGLKSRNEETRAKAAKELQHYVTMELREMSQEES
TRFYDQLNHHIFELVSSSDANERKGGILAIASLIGVEGGNATRIGRFANYLRNLLPSNDP VVMEMASKAIGRLAMAGDTFTAEYVEFEVKRALEWLGADRNEGRRHAAVLVLRELAISVP TFFFQQVQPFFDNIFVAVWDPKQAIREGAVAALRACLILTTQREPKEMQKPQWYRHTFEE AEKGFDETLAKEKGMNRDDRIHGALLILNELVRISSMEGERLREEMEEITQQQLVHDKYC KDLMGFGTKPRHITPFTSFQAVQPQQSNALVGLLGYSSHQGLMGFGTSPSPAKSTLVESR CCRDLMEEKFDQVCQWVLKCRNSKNSLIQMTILNLLPRLAAFRPSAFTDTQYLQDTMNHV LSCVKKEKERTAAFQALGLLSVAVRSEFKVYLPRVLDIIRAALPPKDFAHKRQKAMQVDA TVFTCISMLARAMGPGIQQDIKELLEPMLAVGLSPALTAVLYDLSRQIPQLKKDIQDGLL KMLSLVLMHKPLRHPGMPKGLAHQLASPGLTTLPEASDVGSITLALRTLGSFEFEGHSLT QFVRHCADHFLNSEHKEIRMEAARTCSRLLTPSIHLISGHAHVVSQTAVQVVADVLSKLL VVGITDPDPDIRYCVLASLDERFDAHLAQAENLQALFVALNDQVFEIRELAICTVGRLSS MNPAFVMPFLRKMLIQILTELEHSGIGRIKEQSARMLGHLVSNAPRLIRPYMEPILKALI LKLKDPDPDPNPGVINNVLATIGELAQVSGLEMRKWVDELFIIIMDMLQDSSLLAKRQVA LWTLGQLVASTGYVVEPYRKYPTLLEVLLNFLKTEQNQGTRREAIRVLGLLGALDPYKHK VNIGMIDQSRDASAVSLSESKSSQDSSDYSTSEMLVNMGNLPLDEFYPAVSMVALMRIFR DQSLSHHHTMVVQAITFIFKSLGLKCVQFLPQVMPTFLNVIRVCDGAIREFLFQQLGMLV SFVKSHIRPYMDEIVTLMREFWVMNTSIQSTIILLIEQIVVALGGEFKLYLPQLIPHMLR VFMHDNSPGRIVSIKLLAAIQLFGANLDDYLHLLLPPIVKLFDAPEAPLPSRKAALETVD RLTESLDFTDYASRIIHPIVRTLDQSPELRSTAMDTLSSLVFQLGKKYQIFIPMVNKVLV RHRINHQRYDVLICRIVKGYTLADEEEDPLIYQHRMLRSGQGDALASGPVETGPMKKLHV STINLQKAWGAARRVSKDDWLEWLRRLSLELLKDSSSPSLRSCWALAQAYNPMARDLFNA AFVSCWSELNEDQQDELIRSIELALTSQDIAEVTQTLLNLAEFMEHSDKGPLPLRDDNGI VLLGERAAKCRAYAKALHYKELEFQKGPTPAILESLISINNKLQQPEAAAGVLEYAMKHF GELEIQATWYEKLHEWEDALVAYDKKMDTNKDDPELMLGRMRCLEALGEWGQLHQQCCEK WTLVNDETQAKMARMAAAAAWGLGQWDSMEEYTCMIPRDTHDGAFYRAVLALHQDLFSLA QQCIDKARDLLDAELTAMAGESYSRAYGAMVSCHMLSELEEVIQYKLVPERREIIRQIWW ERLQGCQRIVEDWQKILMVRSLVVSPHEDMRTWLKYASLCGKSGRLALAHKTLVLLLGVD PSRQLDHPLPTVHPQVTYAYMKNMWKSARKIDAFQHMQHFVQTMQQQAQHAIATEDQQHK QELHKLMARCFLKLGEWQLNLQGINESTIPKVLQYYSAATEHDRSWYKAWHAWAVMNFEA VLHYKHQNQARDEKKKLRHASGANITNATTAATTAATATTTASTEGSNSESEAESTENSP TPSPLQKKVTEDLSKTLLMYTVPAVQGFFRSISLSRGNNLQDTLRVLTLWFDYGHWPDVN EALVEGVKAIQIDTWLQVIPQLIARIDTPRPLVGRLIHQLLTDIGRYHPQALIYPLTVAS KSTTTARHNAANKILKNMCEHSNTLVQQAMMVSEELIRVAILWHEMWHEGLEEASRLYFG ERNVKGMFEVLEPLHAMMERGPQTLKETSFNQAYGRDLMEAQEWCRKYMKSGNVKDLTQA WDLYYHVFRRISKQLPQLTSLELQYVSPKLLMCRDLELAVPGTYDPNQPIIRIQSIAPSL QVITSKQRPRKLTLMGSNGHEFVFLLKGHEDLRQDERVMQLFGLVNTLLANDPTSLRKNL SIQRYAVIPLSTNSGLIGWVPHCDTLHALIRDYREKKKILLNIEHRIMLRMAPDYDHLTL MQKVEVFEHAVNNTAGDDLAKLLWLKSPSSEVWFDRRTNYTRSLAVMSMVGYILGLGDRH PSNLMLDRLSGKILHIDFGDCFEVAMTREKFPEKIPFRLTRMLTNAMEVTGLDGNYRITC HTVMEVLREHKDSVMAVLEAFVYDPLLNWRLMDTNTKGNKRSRTRTDSYSAGQSVEILDG VELGEPAHKKTGTTVPESIHSFIGDGLVKPEALNKKAIQIINRVRDKLTGRDFSHDDTLD VPTQVELLIKQATSHENLCQCYIGWCPFW Click to Show/Hide
|
||||
| Function |
Serine/threonine protein kinase which is a central regulator of cellular metabolism, growth and survival in response to hormones, growth factors, nutrients, energy and stress signals. MTOR directly or indirectly regulates the phosphorylation of at least 800 proteins. Functions as part of 2 structurally and functionally distinct signaling complexes mTORC1 and mTORC2 (mTOR complex 1 and 2). Activated mTORC1 up-regulates protein synthesis by phosphorylating key regulators of mRNA translation and ribosome synthesis. This includes phosphorylation of EIF4EBP1 and release of its inhibition toward the elongation initiation factor 4E (eiF4E). Moreover, phosphorylates and activates RPS6KB1 and RPS6KB2 that promote protein synthesis by modulating the activity of their downstream targets including ribosomal protein S6, eukaryotic translation initiation factor EIF4B, and the inhibitor of translation initiation PDCD4. This also includes mTORC1 signaling cascade controlling the MiT/TFE factors TFEB and TFE3: in the presence of nutrients, mediates phosphorylation of TFEB and TFE3, promoting their cytosolic retention and inactivation. Upon starvation or lysosomal stress, inhibition of mTORC1 induces dephosphorylation and nuclear translocation of TFEB and TFE3, promoting their transcription factor activity. Stimulates the pyrimidine biosynthesis pathway, both by acute regulation through RPS6KB1-mediated phosphorylation of the biosynthetic enzyme CAD, and delayed regulation, through transcriptional enhancement of the pentose phosphate pathway which produces 5-phosphoribosyl-1-pyrophosphate (PRPP), an allosteric activator of CAD at a later step in synthesis, this function is dependent on the mTORC1 complex. Regulates ribosome synthesis by activating RNA polymerase III-dependent transcription through phosphorylation and inhibition of MAF1 an RNA polymerase III-repressor. In parallel to protein synthesis, also regulates lipid synthesis through SREBF1/SREBP1 and LPIN1. To maintain energy homeostasis mTORC1 may also regulate mitochondrial biogenesis through regulation of PPARGC1A. mTORC1 also negatively regulates autophagy through phosphorylation of ULK1. Under nutrient sufficiency, phosphorylates ULK1 at 'Ser-758', disrupting the interaction with AMPK and preventing activation of ULK1. Also prevents autophagy through phosphorylation of the autophagy inhibitor DAP. Also prevents autophagy by phosphorylating RUBCNL/Pacer under nutrient-rich conditions. Prevents autophagy by mediating phosphorylation of AMBRA1, thereby inhibiting AMBRA1 ability to mediate ubiquitination of ULK1 and interaction between AMBRA1 and PPP2CA. mTORC1 exerts a feedback control on upstream growth factor signaling that includes phosphorylation and activation of GRB10 a INSR-dependent signaling suppressor. Among other potential targets mTORC1 may phosphorylate CLIP1 and regulate microtubules. As part of the mTORC2 complex MTOR may regulate other cellular processes including survival and organization of the cytoskeleton. Plays a critical role in the phosphorylation at 'Ser-473' of AKT1, a pro-survival effector of phosphoinositide 3-kinase, facilitating its activation by PDK1. mTORC2 may regulate the actin cytoskeleton, through phosphorylation of PRKCA, PXN and activation of the Rho-type guanine nucleotide exchange factors RHOA and RAC1A or RAC1B. mTORC2 also regulates the phosphorylation of SGK1 at 'Ser-422'. Regulates osteoclastogenesis by adjusting the expression of CEBPB isoforms. Plays an important regulatory role in the circadian clock function; regulates period length and rhythm amplitude of the suprachiasmatic nucleus (SCN) and liver clocks. Phosphorylates SQSTM1, promoting interaction between SQSTM1 and KEAP1 and subsequent inactivation of the BCR(KEAP1) complex.
Click to Show/Hide
|
||||
| Uniprot ID | |||||
| Ensembl ID | |||||
| HGNC ID | |||||
| Click to Show/Hide the Complete Species Lineage | |||||
Type(s) of Resistant Mechanism of This Molecule
Drug Resistance Data Categorized by Drug
Approved Drug(s)
11 drug(s) in total
| Drug Sensitivity Data Categorized by Their Corresponding Mechanisms | ||||
|
|
||||
| Disease Class: Breast cancer [ICD-11: 2C60.3] | [1] | |||
| Sensitive Disease | Breast cancer [ICD-11: 2C60.3] | |||
| Sensitive Drug | Paclitaxel | |||
| Molecule Alteration | Expression | Up-regulation |
||
| Differential expression of the molecule in resistant disease | ||||
| Classification of Disease | Breast cancer [ICD-11: 2C60] | |||
| The Specified Disease | Breast cancer | |||
| The Studied Tissue | Breast tissue | |||
| The Expression Level of Disease Section Compare with the Healthy Individual Tissue | p-value: 1.52E-01 Fold-change: 4.68E-03 Z-score: 1.44E+00 |
|||
| Experimental Note | Revealed Based on the Cell Line Data | |||
| Cell Pathway Regulation | Cell apoptosis | Activation | hsa04210 | |
| Cell invasion | Activation | hsa05200 | ||
| Cell migration | Activation | hsa04670 | ||
| Cell proliferation | Inhibition | hsa05200 | ||
| In Vitro Model | MCF-7 cells | Breast | Homo sapiens (Human) | CVCL_0031 |
| MDA-MB-231 cells | Breast | Homo sapiens (Human) | CVCL_0062 | |
| T47D cells | Breast | Homo sapiens (Human) | CVCL_0553 | |
| ZR75-1 cells | Breast | Homo sapiens (Human) | CVCL_0588 | |
| BT549 cells | Breast | Homo sapiens (Human) | CVCL_1092 | |
| Hs-578T cells | Breast | Homo sapiens (Human) | CVCL_0332 | |
| Experiment for Molecule Alteration |
Western blot analysis | |||
| Experiment for Drug Resistance |
CCK8 assay | |||
| Mechanism Description | miR-100 expression was significantly downregulated in breast cancer, and the downregulation was more extensive in luminal A breast cancers and was associated with worse patient survival. Ectopic expression of miR-100 sensitized, while inhibition of miR-100 expression desensitized, breast cancer cells to the effect of paclitaxel on cell cycle arrest, multinucleation, apoptosis and tumorigenesis. Expression of genes that are part of a known signature of paclitaxel sensitivity in breast cancer significantly correlated with miR-100 expression. Mechanistically, targeting mTOR appeared to mediate miR-100's function in sensitizing breast cancer cells to paclitaxel, but other mechanisms also seem to be involved, including targeting other molecules such as PLk1. | |||
| Drug Resistance Data Categorized by Their Corresponding Mechanisms | ||||
|
|
||||
| Disease Class: Ovarian cancer [ICD-11: 2C73.0] | [23] | |||
| Resistant Disease | Ovarian cancer [ICD-11: 2C73.0] | |||
| Resistant Drug | Paclitaxel | |||
| Molecule Alteration | Missense mutation | p.K1655N |
||
| Experimental Note | Identified from the Human Clinical Data | |||
| Cell Pathway Regulation | AXLK signaling pathway | Activation | hsa01521 | |
| In Vitro Model | Plasma | Blood | Homo sapiens (Human) | N.A. |
| Experiment for Molecule Alteration |
Circulating-free DNA assay; Whole exome sequencing assay | |||
| Mechanism Description | Quantification of allele fractions in plasma identified increased representation of mutant alleles in association with emergence of therapy resistance. | |||
| Disease Class: Ovarian serous carcinoma [ICD-11: 2C73.2] | [23] | |||
| Resistant Disease | Ovarian serous carcinoma [ICD-11: 2C73.2] | |||
| Resistant Drug | Paclitaxel | |||
| Molecule Alteration | Missense mutation | p.K1655N |
||
| Experimental Note | Identified from the Human Clinical Data | |||
| Experiment for Molecule Alteration |
Circulating-free DNA assay; Whole exome sequencing assay | |||
| Mechanism Description | Quantification of allele fractions in plasma identified increased representation of mutant alleles in association with emergence of therapy resistance. | |||
| Drug Resistance Data Categorized by Their Corresponding Mechanisms | ||||
|
|
||||
| Disease Class: Lung cancer [ICD-11: 2C25.5] | [2] | |||
| Resistant Disease | Lung cancer [ICD-11: 2C25.5] | |||
| Resistant Drug | Cisplatin | |||
| Molecule Alteration | Expression | Up-regulation |
||
| Differential expression of the molecule in resistant disease | ||||
| Classification of Disease | Lung cancer [ICD-11: 2C25] | |||
| The Specified Disease | Lung cancer | |||
| The Studied Tissue | Lung tissue | |||
| The Expression Level of Disease Section Compare with the Healthy Individual Tissue | p-value: 3.07E-13 Fold-change: 3.82E-02 Z-score: 7.71E+00 |
|||
| Experimental Note | Revealed Based on the Cell Line Data | |||
| In Vitro Model | A549 cells | Lung | Homo sapiens (Human) | CVCL_0023 |
| In Vivo Model | Nude mouse xenograft model | Mus musculus | ||
| Experiment for Molecule Alteration |
Western blot analysis; qRT-PCR; Luciferase reporter assay | |||
| Experiment for Drug Resistance |
CCK8 assay; Flow cytometric analysis | |||
| Mechanism Description | Cisplatin-resistant lung cancer cell-derived exosomes increase cisplatin resistance of recipient cells in exosomal miR100-5p-dependent manner, and mTOR acts as a target gene of miR100-5p. | |||
|
|
||||
| Disease Class: Gastric cancer [ICD-11: 2B72.1] | [3] | |||
| Resistant Disease | Gastric cancer [ICD-11: 2B72.1] | |||
| Resistant Drug | Cisplatin | |||
| Molecule Alteration | Expression | Up-regulation |
||
| Differential expression of the molecule in resistant disease | ||||
| Classification of Disease | Gastric cancer [ICD-11: 2B72] | |||
| The Specified Disease | Gastric cancer | |||
| The Studied Tissue | Gastric tissue | |||
| The Expression Level of Disease Section Compare with the Healthy Individual Tissue | p-value: 3.80E-01 Fold-change: 2.28E-02 Z-score: 1.11E+00 |
|||
| Experimental Note | Identified from the Human Clinical Data | |||
| Cell Pathway Regulation | Cell apoptosis | Inhibition | hsa04210 | |
| mTOR/HIF-1alpha /P-gp/MRP1 signaling pathway | Regulation | N.A. | ||
| In Vitro Model | SGC7901 cells | Gastric | Homo sapiens (Human) | CVCL_0520 |
| BGC823 cells | Gastric | Homo sapiens (Human) | CVCL_3360 | |
| Experiment for Molecule Alteration |
Western blot analysis | |||
| Experiment for Drug Resistance |
CCK8 assay; Flow cytometry assay | |||
| Mechanism Description | Overexpression of long non-coding RNA PVT1 in gastric cancer cells promotes the development of multidrug resistance.PVT-1 was highly expressed in gastric cancer tissues of cisplatin-resistant patients and cisplatin-resistant cells. While, PVT1 overexpression exhibit the anti-apoptotic property in BGC823 and SGC7901 cells transfected with LV-PVT1-GFP and treated with cisplatin. Moreover, qRT-PCR and western blotting revealed that PVT1 up-regulation increased the expression of MDR1, MRP, mTOR and HIF-1alpha. Overexpression of LncRNA PVT1 in gastric carcinoma promotes the development of MDR, suggesting an efficacious target for reversing MDR in gastric cancer therapy. | |||
| Disease Class: Colorectal cancer [ICD-11: 2B91.1] | [6] | |||
| Resistant Disease | Colorectal cancer [ICD-11: 2B91.1] | |||
| Resistant Drug | Cisplatin | |||
| Molecule Alteration | Expression | Up-regulation |
||
| Experimental Note | Identified from the Human Clinical Data | |||
| Cell Pathway Regulation | Cell apoptosis | Inhibition | hsa04210 | |
| In Vitro Model | SW480 cells | Colon | Homo sapiens (Human) | CVCL_0546 |
| Experiment for Molecule Alteration |
Western blot analysis; RT-qPCR | |||
| Experiment for Drug Resistance |
CCK8 assay; Flow cytometry assay | |||
| Mechanism Description | miR-1271 enhances the sensitivity of colorectal cancer cells to cisplatin via downregulating mTOP. | |||
| Disease Class: Epithelial ovarian cancer [ICD-11: 2B5D.0] | [7] | |||
| Resistant Disease | Epithelial ovarian cancer [ICD-11: 2B5D.0] | |||
| Resistant Drug | Cisplatin | |||
| Molecule Alteration | Expression | Up-regulation |
||
| Experimental Note | Revealed Based on the Cell Line Data | |||
| Cell Pathway Regulation | Cell apoptosis | Activation | hsa04210 | |
| Cell proliferation | Inhibition | hsa05200 | ||
| In Vitro Model | SkOV3 cells | Ovary | Homo sapiens (Human) | CVCL_0532 |
| SkOV3/DDP cells | Ovary | Homo sapiens (Human) | CVCL_0532 | |
| In Vivo Model | Nude mouse xenograft model | Mus musculus | ||
| Experiment for Molecule Alteration |
Western blot analysis | |||
| Experiment for Drug Resistance |
CCK8 assay; Crystal violet staining assay | |||
| Mechanism Description | miR100 resensitizes resistant epithelial ovarian cancer to cisplatin probably by inhibiting cell proliferation, inducing apoptosis and arresting cell cycle and by targeted downregulation of mTOR and PLk1 expression. | |||
| Drug Sensitivity Data Categorized by Their Corresponding Mechanisms | ||||
|
|
||||
| Disease Class: Cholangiocarcinoma [ICD-11: 2C12.0] | [8] | |||
| Sensitive Disease | Cholangiocarcinoma [ICD-11: 2C12.0] | |||
| Sensitive Drug | Cisplatin | |||
| Molecule Alteration | Expression | Down-regulation |
||
| Experimental Note | Revealed Based on the Cell Line Data | |||
| Cell Pathway Regulation | mTOR signaling pathway | Inhibition | hsa04150 | |
| In Vitro Model | GBC-SD cells | Gallbladder | Homo sapiens (Human) | CVCL_6903 |
| RBE cells | Liver | Homo sapiens (Human) | CVCL_4896 | |
| Experiment for Molecule Alteration |
Western blot analysis | |||
| Experiment for Drug Resistance |
CCK8 assay; Flow cytometric analysis | |||
| Mechanism Description | miR199a-3p enhances cisplatin sensitivity of cholangiocarcinoma cells by inhibiting mTOR signaling pathway and expression of MDR1. miR199a-3p could increase the cisplatin sensitivity of cholangiocarcinoma cell lines by regulating mTOR expression. | |||
| Disease Class: Oral squamous cell carcinoma [ICD-11: 2B6E.0] | [9] | |||
| Sensitive Disease | Oral squamous cell carcinoma [ICD-11: 2B6E.0] | |||
| Sensitive Drug | Cisplatin | |||
| Molecule Alteration | Expression | Up-regulation |
||
| Experimental Note | Revealed Based on the Cell Line Data | |||
| Cell Pathway Regulation | Cell apoptosis | Activation | hsa04210 | |
| Cell autophagy | Inhibition | hsa04140 | ||
| Cell invasion | Inhibition | hsa05200 | ||
| Cell migration | Inhibition | hsa04670 | ||
| Cell proliferation | Inhibition | hsa05200 | ||
| In Vitro Model | CAL-27 cells | Tongue | Homo sapiens (Human) | CVCL_1107 |
| KB cells | Gastric | Homo sapiens (Human) | CVCL_0372 | |
| Experiment for Molecule Alteration |
Western blot analysis | |||
| Experiment for Drug Resistance |
CCK8 assay | |||
| Mechanism Description | After HOTAIR silence, autophagy was inhibited with the downregulated expression of MAP1LC3B (microtubule-associated protein 1 light chain 3B), beclin1, and autophagy-related gene (ATG) 3 and ATG7. The expressions of mTOR increased, which promoted the sensitivity to cisplatin. | |||
| Disease Class: Gastric cancer [ICD-11: 2B72.1] | [10] | |||
| Sensitive Disease | Gastric cancer [ICD-11: 2B72.1] | |||
| Sensitive Drug | Cisplatin | |||
| Molecule Alteration | Expression | Down-regulation |
||
| Experimental Note | Revealed Based on the Cell Line Data | |||
| Cell Pathway Regulation | Cell proliferation | Inhibition | hsa05200 | |
| mTOR signaling pathway | Regulation | N.A. | ||
| In Vitro Model | SGC7901 cells | Gastric | Homo sapiens (Human) | CVCL_0520 |
| In Vivo Model | Nude mouse xenograft model | Mus musculus | ||
| Experiment for Molecule Alteration |
Expression | |||
| Experiment for Drug Resistance |
WST-1 kit assay | |||
| Mechanism Description | miR-218 increased chemosensitivity of gastric cancer cells to cisplatin via its target mTOR inhibitor. | |||
| Disease Class: Gastric cancer [ICD-11: 2B72.1] | [11] | |||
| Sensitive Disease | Gastric cancer [ICD-11: 2B72.1] | |||
| Sensitive Drug | Cisplatin | |||
| Molecule Alteration | Expression | Down-regulation |
||
| Experimental Note | Revealed Based on the Cell Line Data | |||
| Cell Pathway Regulation | Cell apoptosis | Activation | hsa04210 | |
| Cell proliferation | Inhibition | hsa05200 | ||
| IGF1R/IRS1 signaling pathway | Regulation | N.A. | ||
| In Vitro Model | SGC7901 cells | Gastric | Homo sapiens (Human) | CVCL_0520 |
| Experiment for Molecule Alteration |
Western blot analysis | |||
| Experiment for Drug Resistance |
CCK8 assay; Transwell assay | |||
| Mechanism Description | Enforced miR-1271 expression repressed the protein levels of its targets, inhibited proliferation of SGC7901/DDP cells, and sensitized SGC7901/DDP cells to DDP-induced apoptosis. Overall, on the basis of the results of our study, we proposed that miR-1271 could regulate cisplatin resistance in human gastric cancer cells, at least partially, via targeting the IGF1R/IRS1 pathway. | |||
| Disease Class: Chondrosarcoma [ICD-11: 2B50.0] | [12] | |||
| Sensitive Disease | Chondrosarcoma [ICD-11: 2B50.0] | |||
| Sensitive Drug | Cisplatin | |||
| Molecule Alteration | Expression | Down-regulation |
||
| Experimental Note | Identified from the Human Clinical Data | |||
| Cell Pathway Regulation | mTOR signaling pathway | Inhibition | hsa04150 | |
| In Vitro Model | C-28/l2 cells | Cartilage | Homo sapiens (Human) | CVCL_0187 |
| CHON-001 cells | Cartilage | Homo sapiens (Human) | CVCL_C462 | |
| Experiment for Molecule Alteration |
Western blot analysis | |||
| Experiment for Drug Resistance |
MTT assay | |||
| Mechanism Description | mTOR is frequently activated in multiple carcinoma. The overexpression of miR-100 significantly down-regulated mTOR proteins and inhibition of miR-100 restored the expression of mTOR in CH-2879 cells, the present studies highlight miR-100 as a tumor suppressor in chondrosarcoma contributing to anti-chemoresistance. | |||
| Drug Sensitivity Data Categorized by Their Corresponding Mechanisms | ||||
|
|
||||
| Disease Class: Glioma [ICD-11: 2A00.1] | [4] | |||
| Sensitive Disease | Glioma [ICD-11: 2A00.1] | |||
| Sensitive Drug | Temozolomide | |||
| Molecule Alteration | Expression | Up-regulation |
||
| Differential expression of the molecule in resistant disease | ||||
| Classification of Disease | Brain cancer [ICD-11: 2A00] | |||
| The Specified Disease | Neuroectodermal tumor | |||
| The Studied Tissue | Brainstem tissue | |||
| The Expression Level of Disease Section Compare with the Healthy Individual Tissue | p-value: 8.18E-01 Fold-change: 2.19E-03 Z-score: 2.34E-01 |
|||
| Experimental Note | Identified from the Human Clinical Data | |||
| In Vitro Model | U87 cells | Brain | Homo sapiens (Human) | CVCL_0022 |
| U257 cells | Brain | Homo sapiens (Human) | N.A. | |
| Experiment for Molecule Alteration |
Luciferase reporter assay; Western blot analysis | |||
| Experiment for Drug Resistance |
Flow cytometry assay; MTT assay; Transwell assay | |||
| Mechanism Description | Upregulation of CASC2 sensitized glioma to temozolomide cytotoxicity through autophagy inhibition by sponging miR193a-5p and regulating mTOR expression. mTOR or CASC2 overexpression or miR193a-5p inhibition remarkably reduced autophagy-related proteins expression. | |||
| Drug Resistance Data Categorized by Their Corresponding Mechanisms | ||||
|
|
||||
| Disease Class: Glioma [ICD-11: 2A00.1] | [5] | |||
| Resistant Disease | Glioma [ICD-11: 2A00.1] | |||
| Resistant Drug | Temozolomide | |||
| Molecule Alteration | Expression | Down-regulation |
||
| Differential expression of the molecule in resistant disease | ||||
| Classification of Disease | Brain cancer [ICD-11: 2A00] | |||
| The Specified Disease | Brain cancer | |||
| The Studied Tissue | Nervous tissue | |||
| The Expression Level of Disease Section Compare with the Healthy Individual Tissue | p-value: 3.79E-15 Fold-change: -2.07E-02 Z-score: -7.99E+00 |
|||
| Experimental Note | Revealed Based on the Cell Line Data | |||
| Cell Pathway Regulation | IGF1R/IRS1 signaling pathway | Activation | hsa04212 | |
| In Vitro Model | U251 cells | Brain | Homo sapiens (Human) | CVCL_0021 |
| U87 cells | Brain | Homo sapiens (Human) | CVCL_0022 | |
| U138 cells | Brain | Homo sapiens (Human) | CVCL_0020 | |
| HEK293 cells | Kidney | Homo sapiens (Human) | CVCL_0045 | |
| NHA cells | Brain | Homo sapiens (Human) | N.A. | |
| LN382 cells | Brain | Homo sapiens (Human) | CVCL_3956 | |
| SF295 cells | Brain | Homo sapiens (Human) | CVCL_1690 | |
| SHG-44 cells | Brain | Homo sapiens (Human) | CVCL_6728 | |
| In Vivo Model | Nude mouse xenograft model | Mus musculus | ||
| Experiment for Molecule Alteration |
Western blot analysis | |||
| Experiment for Drug Resistance |
CCK8 assay | |||
| Mechanism Description | Up-regulation of miR-497 confers resistance to temozolomide in human glioma cells by targeting mTOR/Bcl-2. The silencing of miR-497 decreased the protein levels of IGF1R/IRS1 pathway-related proteins, that is, IGF1R, IRS1, mTOR, and Bcl-2. | |||
| Disease Class: Malignant glioma [ICD-11: 2A00.2] | [4] | |||
| Resistant Disease | Malignant glioma [ICD-11: 2A00.2] | |||
| Resistant Drug | Temozolomide | |||
| Molecule Alteration | Expression | Down-regulation |
||
| Experimental Note | Identified from the Human Clinical Data | |||
| Cell Pathway Regulation | Cell autophagy | Inhibition | hsa04140 | |
| Cell cytotoxicity | Activation | hsa04650 | ||
| In Vitro Model | U87 cells | Brain | Homo sapiens (Human) | CVCL_0022 |
| U257 cells | Brain | Homo sapiens (Human) | N.A. | |
| Experiment for Molecule Alteration |
Luciferase reporter assay; Western blot analysis | |||
| Experiment for Drug Resistance |
Flow cytometry assay; MTT assay; Transwell assay | |||
| Mechanism Description | Upregulation of CASC2 sensitized glioma to temozolomide cytotoxicity through autophagy inhibition by sponging miR193a-5p and regulating mTOR expression. CASC2 is downregulated in gliomas, resulting in increased miR193a-5p level and a decrease in mTOR expression, which further induces protective autophagy, leading to TMZ resistance. | |||
| Drug Resistance Data Categorized by Their Corresponding Mechanisms | ||||
|
|
||||
| Disease Class: B-cell non-Hodgkin lymphoma [ICD-11: 2A85.2] | [13] | |||
| Resistant Disease | B-cell non-Hodgkin lymphoma [ICD-11: 2A85.2] | |||
| Resistant Drug | Doxorubicin | |||
| Molecule Alteration | Phosphorylation | Up-regulation |
||
| Experimental Note | Revealed Based on the Cell Line Data | |||
| Cell Pathway Regulation | PI3K/AKT/mTOR signaling pathway | Inhibition | hsa04151 | |
| In Vitro Model | RAJI/DOX cells | Blood | Homo sapiens (Human) | N.A. |
| Mechanism Description | The expression of Pgp and the phosphorylation levels of AKT and mTOR in RAJI/DOX cell line were both higher than those in RAJI cell line. NVP-BEZ235 downregulated the phosphorylation levels of AKT and mTOR in RAJI/DOX cell line. NVP-BEZ235 inhibited the proliferation of RAJI/DOX cell line, and the effect was obvious when it was cooperated with doxorubicin. The constitutive activation of PI3K/AKT/mTOR pathway of RAJI/DOX cell line was more serious than RAJI cell line. NVP-BEZ235 reversed doxorubicin resistance of RAJI/DOX cell line by inhibiting the PI3K/AKT/mTOR signal pathway. | |||
| Drug Sensitivity Data Categorized by Their Corresponding Mechanisms | ||||
|
|
||||
| Disease Class: Hepatocellular cancer [ICD-11: 2C12.4] | [14] | |||
| Sensitive Disease | Hepatocellular cancer [ICD-11: 2C12.4] | |||
| Sensitive Drug | Doxorubicin | |||
| Molecule Alteration | Expression | Down-regulation |
||
| Experimental Note | Identified from the Human Clinical Data | |||
| Cell Pathway Regulation | Cell apoptosis | Activation | hsa04210 | |
| Cell invasion | Inhibition | hsa05200 | ||
| mTOR signaling pathway | Inhibition | hsa04150 | ||
| In Vitro Model | Huh-7 cells | Liver | Homo sapiens (Human) | CVCL_0336 |
| HepG2 cells | Liver | Homo sapiens (Human) | CVCL_0027 | |
| SNU475 cells | Liver | Homo sapiens (Human) | CVCL_0497 | |
| Experiment for Molecule Alteration |
Western blot analysis | |||
| Experiment for Drug Resistance |
Cell invasion assay | |||
| Mechanism Description | The mTOR pathway is activated by multiple extracellular signals, such as growth factors, nutrients, amino acids, hormones, and mitogens leading to the phosphorylation of the translational regulator, phospho-p70S6 kinase, which, in turn, regulates cell proliferation, regulates protein synthesis, and allows progression from the G1 to the S phase of the cell cycle. There is an inverse correlation linking miR-199a-3p and mTOR. miR-199a-3p restoration blocks the G1-S transition of the cell cycle, impairs invasion capability, and sensitizes HCC cells to doxorubicin challenge. | |||
| Drug Resistance Data Categorized by Their Corresponding Mechanisms | ||||
|
|
||||
| Disease Class: Thyroid carcinoma [ICD-11: 2D10.4] | [15] | |||
| Resistant Disease | Thyroid carcinoma [ICD-11: 2D10.4] | |||
| Resistant Drug | Everolimus | |||
| Molecule Alteration | Missense mutation | p.F2108L |
||
| Experimental Note | Identified from the Human Clinical Data | |||
| Cell Pathway Regulation | mTOR signaling pathway | Activation | hsa04150 | |
| Experiment for Molecule Alteration |
Whole-exome sequencing assay; Whole-genome sequencing assay | |||
| Experiment for Drug Resistance |
Computerized tomography assay | |||
| Mechanism Description | On the basis of these findings, we hypothesized that mTORF2108L causes resistance to allosteric mTOR inhibition by preventing the binding of the drug to the protein. | |||
| Drug Resistance Data Categorized by Their Corresponding Mechanisms | ||||
|
|
||||
| Disease Class: Colorectal cancer [ICD-11: 2B91.1] | [16] | |||
| Resistant Disease | Colorectal cancer [ICD-11: 2B91.1] | |||
| Resistant Drug | Fluorouracil | |||
| Molecule Alteration | Expression | Up-regulation |
||
| Experimental Note | Revealed Based on the Cell Line Data | |||
| Cell Pathway Regulation | AKT/mTOR signaling pathway | Activation | hsa04150 | |
| Cell apoptosis | Activation | hsa04210 | ||
| Cell invasion | Inhibition | hsa05200 | ||
| Cell proliferation | Inhibition | hsa05200 | ||
| In Vitro Model | SW480 cells | Colon | Homo sapiens (Human) | CVCL_0546 |
| DLD1 cells | Colon | Homo sapiens (Human) | CVCL_0248 | |
| SW620 cells | Colon | Homo sapiens (Human) | CVCL_0547 | |
| HCT116 cells | Colon | Homo sapiens (Human) | CVCL_0291 | |
| LOVO cells | Colon | Homo sapiens (Human) | CVCL_0399 | |
| HT-29 cells | Colon | Homo sapiens (Human) | CVCL_0320 | |
| In Vivo Model | Nude mouse xenograft model | Mus musculus | ||
| Experiment for Molecule Alteration |
Western blot analysis | |||
| Experiment for Drug Resistance |
CCK8 assay; Colony formation assay | |||
| Mechanism Description | Overexpressed RP11-708H21.4 suppresses CRC cell proliferation through inducing G1 arrest. Moreover, up-regulation of RP11-708H21.4 inhibits cell migration and invasion, causes cell apoptosis, and enhances 5-FU sensitivity of CRC cells. | |||
| Disease Class: Colorectal cancer [ICD-11: 2B91.1] | [17] | |||
| Resistant Disease | Colorectal cancer [ICD-11: 2B91.1] | |||
| Resistant Drug | Fluorouracil | |||
| Molecule Alteration | Expression | Up-regulation |
||
| Experimental Note | Identified from the Human Clinical Data | |||
| Cell Pathway Regulation | Cell apoptosis | Inhibition | hsa04210 | |
| Cell viability | Activation | hsa05200 | ||
| In Vitro Model | HCT116 cells | Colon | Homo sapiens (Human) | CVCL_0291 |
| HCT-8 cells | Colon | Homo sapiens (Human) | CVCL_2478 | |
| Experiment for Molecule Alteration |
Western blot analysis | |||
| Experiment for Drug Resistance |
CCK8 assay; Flow cytometry assay | |||
| Mechanism Description | The overexpression of PVT1 increased the mRNA and protein expression levels of multidrug resistance associated protein 1, P glycoprotein, serine/threonine protein kinase mTOR and apoptosis regulator Bcl2. | |||
| Disease Class: Gastric adenocarcinoma [ICD-11: 2B72.0] | [18] | |||
| Resistant Disease | Gastric adenocarcinoma [ICD-11: 2B72.0] | |||
| Resistant Drug | Fluorouracil | |||
| Molecule Alteration | Expression | Down-regulation |
||
| Experimental Note | Revealed Based on the Cell Line Data | |||
| Cell Pathway Regulation | PI3K/AKT/mTOR signaling pathway | Inhibition | hsa04151 | |
| In Vitro Model | MKN-45/R cells | Gastric | Homo sapiens (Human) | N.A. |
| MKN-74/R cells | Gastric | Homo sapiens (Human) | N.A. | |
| Experiment for Molecule Alteration |
Western blot assay; qRT-PCR | |||
| Experiment for Drug Resistance |
MTT assay | |||
| Mechanism Description | The PI3K/Akt/mTOR signaling pathway was activated in drug-resistant GC cells and tumor tissues of patients refractory to 5-FU chemotherapy, as evidenced by high PI3K, Akt, and mTOR levels in MKN-45/R, MKN-74/R, and GC tissues resistant to 5-FU. Silencing of the PI3K/Akt/mTOR signaling pathway suppressed the 5-FU resistance of GC cells. | |||
| Disease Class: Gastric adenocarcinoma [ICD-11: 2B72.0] | [18] | |||
| Resistant Disease | Gastric adenocarcinoma [ICD-11: 2B72.0] | |||
| Resistant Drug | Fluorouracil | |||
| Molecule Alteration | Phosphorylation | Down-regulation |
||
| Experimental Note | Revealed Based on the Cell Line Data | |||
| Cell Pathway Regulation | PI3K/AKT/mTOR signaling pathway | Inhibition | hsa04151 | |
| In Vitro Model | MKN-45/R cells | Gastric | Homo sapiens (Human) | N.A. |
| MKN-74/R cells | Gastric | Homo sapiens (Human) | N.A. | |
| Experiment for Molecule Alteration |
Western blot assay; qRT-PCR | |||
| Experiment for Drug Resistance |
MTT assay | |||
| Mechanism Description | The PI3K/Akt/mTOR signaling pathway was activated in drug-resistant GC cells and tumor tissues of patients refractory to 5-FU chemotherapy, as evidenced by high PI3K, Akt, and mTOR levels in MKN-45/R, MKN-74/R, and GC tissues resistant to 5-FU. Silencing of the PI3K/Akt/mTOR signaling pathway suppressed the 5-FU resistance of GC cells. | |||
| Drug Sensitivity Data Categorized by Their Corresponding Mechanisms | ||||
|
|
||||
| Disease Class: Colon cancer [ICD-11: 2B90.1] | [19] | |||
| Sensitive Disease | Colon cancer [ICD-11: 2B90.1] | |||
| Sensitive Drug | Fluorouracil | |||
| Molecule Alteration | Expression | Up-regulation |
||
| Experimental Note | Revealed Based on the Cell Line Data | |||
| Cell Pathway Regulation | miR338-3p/mTOR signaling pathway | Activation | hsa05206 | |
| In Vitro Model | HT29 Cells | Colon | Homo sapiens (Human) | CVCL_A8EZ |
| HCT116 cells | Colon | Homo sapiens (Human) | CVCL_0291 | |
| Experiment for Molecule Alteration |
Western blot analysis; Dual luciferase reporter assay | |||
| Experiment for Drug Resistance |
MTT assay; Flow cytometric analysis | |||
| Mechanism Description | miR338-3p increased 5-FU resistance by reducing the expression of its target gene, mTOR; and miR338-3p inhibitor sensitized HT29 (mutant p53) and HCT116 p53-/- (deficient p53) cells by activating mTOR; and miR338-3p-mTOR-autophagy was in the competition with 5-FU-induced apoptosis and contributed to the subsequent 5-FU resistance. (Inhibition of mTOR induces autophagy and depresses apoptosis to confer resistance to 5-FU). | |||
| Disease Class: Nasopharyngeal carcinoma [ICD-11: 2B6B.0] | [20] | |||
| Sensitive Disease | Nasopharyngeal carcinoma [ICD-11: 2B6B.0] | |||
| Sensitive Drug | Fluorouracil | |||
| Molecule Alteration | Expression | Down-regulation |
||
| Experimental Note | Revealed Based on the Cell Line Data | |||
| Cell Pathway Regulation | Cell proliferation | Inhibition | hsa05200 | |
| PI3K/AKT/mTOR signaling pathway | Inhibition | hsa04151 | ||
| In Vitro Model | HNE1 cells | Nasopharynx | Homo sapiens (Human) | CVCL_0308 |
| 5-8F cells | Nasopharynx | Homo sapiens (Human) | CVCL_C528 | |
| CNE2 cells | Nasopharynx | Homo sapiens (Human) | CVCL_6889 | |
| C666-1 cells | Throat | Homo sapiens (Human) | CVCL_7949 | |
| CNE1 cells | Throat | Homo sapiens (Human) | CVCL_6888 | |
| HONE1 cells | Throat | Homo sapiens (Human) | CVCL_8706 | |
| 6-10B cells | Nasopharynx | Homo sapiens (Human) | CVCL_C529 | |
| SUNE-1 cells | Nasopharynx | Homo sapiens (Human) | CVCL_6946 | |
| Experiment for Molecule Alteration |
Western blot analysis | |||
| Experiment for Drug Resistance |
MTT assay | |||
| Mechanism Description | miR-3188 regulates nasopharyngeal carcinoma proliferation and chemosensitivity through a FOXO1-modulated positive feedback loop with mTOR-p-PI3k/AkT-c-JUN. | |||
| Drug Resistance Data Categorized by Their Corresponding Mechanisms | ||||
|
|
||||
| Disease Class: Prostate cancer [ICD-11: 2C82.0] | [21] | |||
| Resistant Disease | Prostate cancer [ICD-11: 2C82.0] | |||
| Resistant Drug | Flutamide | |||
| Molecule Alteration | Phosphorylation | Up-regulation |
||
| Experimental Note | Revealed Based on the Cell Line Data | |||
| Cell Pathway Regulation | PI3K/AKT/mTOR signaling pathway | Inhibition | hsa04151 | |
| In Vitro Model | LN-FLU cells | Prostate | Homo sapiens (Human) | N.A. |
| Experiment for Molecule Alteration |
Western blot assay | |||
| Experiment for Drug Resistance |
MTT assay | |||
| Mechanism Description | The PI3K/Akt/mTOR pathway is involved in the regulation of cancer cell survival, proliferation, growth, and metabolism. In most prostate cancer cell lines, the PIP3 phosphatase PTEN, which antagonizes this pathway, is mutated and therefore the PI3K/Akt/mTOR pathway is activated. To examine the functioning of this pathway, we determined the expressions and phosphorylation levels of Akt and mTOR via Western blot. As shown in, in the drug-resistant LN-FLU cells, both the phosphorylation levels and overall expressions of Akt and mTOR were decreased when compared to the LNCaP cells. The results in the LN-FLU cells were similar to those observed in the androgen-resistant PC3 cells, which were used as a positive control. The decrease in Akt and mTOR signaling suggests a proliferative arrest of the drug-resistant LN-FLU cells. | |||
| Drug Sensitivity Data Categorized by Their Corresponding Mechanisms | ||||
|
|
||||
| Disease Class: Glioblastoma multiforme [ICD-11: 2A00.03] | [22] | |||
| Sensitive Disease | Glioblastoma multiforme [ICD-11: 2A00.03] | |||
| Sensitive Drug | Meclizine | |||
| Molecule Alteration | Expression | Down-regulation |
||
| Experimental Note | Revealed Based on the Cell Line Data | |||
| In Vitro Model | SH-1-V4 cells | Esophagus | Homo sapiens (Human) | N.A. |
| Experiment for Molecule Alteration |
Western blot analysis | |||
| Mechanism Description | GBM stem cells (GBMSC) resist the standard-of-care therapy, temozolomide, and are considered a major contributor to tumor resistance. GBMSCs are resistant to the standard-of-care temozolomide therapy, but temozolomide supplemented with tight-binding piperazine meclizine and flunarizine greatly enhanced GBMSC death over temozolomide alone. | |||
| Drug Sensitivity Data Categorized by Their Corresponding Mechanisms | ||||
|
|
||||
| Disease Class: Cervical cancer [ICD-11: 2C77.0] | [24] | |||
| Sensitive Disease | Cervical cancer [ICD-11: 2C77.0] | |||
| Sensitive Drug | Propofol | |||
| Molecule Alteration | Expression | Down-regulation |
||
| Experimental Note | Revealed Based on the Cell Line Data | |||
| Cell Pathway Regulation | Cell apoptosis | Activation | hsa04210 | |
| Cell invasion | Inhibition | hsa05200 | ||
| Cell proliferation | Inhibition | hsa05200 | ||
| mTOR/p70S6k signaling pathway | Inhibition | hsa04150 | ||
| In Vitro Model | Hela cells | Cervix uteri | Homo sapiens (Human) | CVCL_0030 |
| Caski cells | Uterus | Homo sapiens (Human) | CVCL_1100 | |
| C33A cells | Uterus | Homo sapiens (Human) | CVCL_1094 | |
| Experiment for Molecule Alteration |
Western blot analysis | |||
| Experiment for Drug Resistance |
MTT assay; Flow cytometry assay | |||
| Mechanism Description | Propofol promotes cell apoptosis via inhibiting HOTAIR mediated mTOR pathway in cervical cancer. | |||
| Drug Resistance Data Categorized by Their Corresponding Mechanisms | ||||
|
|
||||
| Disease Class: Breast cancer [ICD-11: 2C60.3] | [25] | |||
| Resistant Disease | Breast cancer [ICD-11: 2C60.3] | |||
| Resistant Drug | Sirolimus | |||
| Molecule Alteration | Missense mutation | p.F2108L |
||
| Experimental Note | Identified from the Human Clinical Data | |||
| Cell Pathway Regulation | PIk3CA/AKT/mTOR signaling pathway | Activation | hsa04211 | |
| In Vitro Model | MCF-7 cells | Breast | Homo sapiens (Human) | CVCL_0031 |
| MDA-MB-468 cells | Breast | Homo sapiens (Human) | CVCL_0419 | |
| Experiment for Molecule Alteration |
Integrated Mutation Profiling of Actionable Cancer Targets assay; Sanger sequencing assay | |||
| Experiment for Drug Resistance |
CellTiter-Glo luminescent cell viability assay | |||
| Mechanism Description | The clinical relevance of these mutations is supported by a case report of a patient who acquired the identical F2108L mTOR mutation after relapse under everolimus treatment. | |||
| Drug Sensitivity Data Categorized by Their Corresponding Mechanisms | ||||
|
|
||||
| Disease Class: Lung cancer [ICD-11: 2C25.5] | [26] | |||
| Sensitive Disease | Lung cancer [ICD-11: 2C25.5] | |||
| Sensitive Drug | Curcumin | |||
| Molecule Alteration | Phosphorylation | Down-regulation |
||
| Experimental Note | Revealed Based on the Cell Line Data | |||
| Cell Pathway Regulation | Cell apoptosis | Activation | hsa04210 | |
| Cell proliferation | Inhibition | hsa05200 | ||
| Wnt signaling pathway | Inhibition | hsa04310 | ||
| mTOR signaling pathway | Inhibition | hsa04150 | ||
| In Vitro Model | A549 cells | Lung | Homo sapiens (Human) | CVCL_0023 |
| Experiment for Molecule Alteration |
Western blot analysis | |||
| Experiment for Drug Resistance |
CCK8 assay; BrdU assay; Flow cytometry assay | |||
| Mechanism Description | Curcumin inhibited Wnt and mTOR pathways through down-regulation of UCA1. | |||
Clinical Trial Drug(s)
3 drug(s) in total
| Drug Sensitivity Data Categorized by Their Corresponding Mechanisms | ||||
|
|
||||
| Disease Class: Melanoma [ICD-11: 2C30.0] | [27] | |||
| Sensitive Disease | Melanoma [ICD-11: 2C30.0] | |||
| Sensitive Drug | Capivasertib | |||
| Molecule Alteration | Missense mutation | p.H1968Y (c.5902C>T) |
||
| Experimental Note | Identified from the Human Clinical Data | |||
| In Vitro Model | HEK 292T cells | Kidney | Homo sapiens (Human) | N.A. |
| Experiment for Molecule Alteration |
Western blot analysis | |||
| Experiment for Drug Resistance |
CCK-8 assay | |||
| Drug Sensitivity Data Categorized by Their Corresponding Mechanisms | ||||
|
|
||||
| Disease Class: B-cell non-Hodgkin lymphoma [ICD-11: 2A85.2] | [13] | |||
| Sensitive Disease | B-cell non-Hodgkin lymphoma [ICD-11: 2A85.2] | |||
| Sensitive Drug | Dactolisib | |||
| Molecule Alteration | Phosphorylation | S704 |
||
| Experimental Note | Revealed Based on the Cell Line Data | |||
| Cell Pathway Regulation | PI3K/AKT/mTOR signaling pathway | Inhibition | hsa04151 | |
| In Vitro Model | RAJI/DOX cells | Blood | Homo sapiens (Human) | N.A. |
| Mechanism Description | The expression of Pgp and the phosphorylation levels of AKT and mTOR in RAJI/DOX cell line were both higher than those in RAJI cell line. NVP-BEZ235 downregulated the phosphorylation levels of AKT and mTOR in RAJI/DOX cell line. NVP-BEZ235 inhibited the proliferation of RAJI/DOX cell line, and the effect was obvious when it was cooperated with doxorubicin. The constitutive activation of PI3K/AKT/mTOR pathway of RAJI/DOX cell line was more serious than RAJI cell line. NVP-BEZ235 reversed doxorubicin resistance of RAJI/DOX cell line by inhibiting the PI3K/AKT/mTOR signal pathway. | |||
| Drug Sensitivity Data Categorized by Their Corresponding Mechanisms | ||||
|
|
||||
| Disease Class: Melanoma [ICD-11: 2C30.0] | [27] | |||
| Sensitive Disease | Melanoma [ICD-11: 2C30.0] | |||
| Sensitive Drug | LY-294002 | |||
| Molecule Alteration | Missense mutation | p.H1968Y (c.5902C>T) |
||
| Experimental Note | Identified from the Human Clinical Data | |||
| In Vitro Model | HEK 292T cells | Kidney | Homo sapiens (Human) | N.A. |
| Experiment for Molecule Alteration |
Western blot analysis | |||
| Experiment for Drug Resistance |
CCK-8 assay | |||
Preclinical Drug(s)
1 drug(s) in total
| Drug Sensitivity Data Categorized by Their Corresponding Mechanisms | ||||
|
|
||||
| Disease Class: Melanoma [ICD-11: 2C30.0] | [27] | |||
| Sensitive Disease | Melanoma [ICD-11: 2C30.0] | |||
| Sensitive Drug | LY-294002/Capivasertib | |||
| Molecule Alteration | Missense mutation | p.P2213S (c.6637C>T) |
||
| Experimental Note | Identified from the Human Clinical Data | |||
| In Vitro Model | HEK 292T cells | Kidney | Homo sapiens (Human) | N.A. |
| Experiment for Molecule Alteration |
Western blot analysis | |||
| Experiment for Drug Resistance |
CCK-8 assay | |||
Investigative Drug(s)
1 drug(s) in total
| Drug Sensitivity Data Categorized by Their Corresponding Mechanisms | ||||
|
|
||||
| Disease Class: Lung adenocarcinoma [ICD-11: 2C25.0] | [28] | |||
| Sensitive Disease | Lung adenocarcinoma [ICD-11: 2C25.0] | |||
| Sensitive Drug | Celastrol | |||
| Molecule Alteration | Expression | Down-regulation |
||
| Experimental Note | Revealed Based on the Cell Line Data | |||
| Cell Pathway Regulation | Cell apoptosis | Activation | hsa04210 | |
| Cell viability | Inhibition | hsa05200 | ||
| mTOR signaling pathway | Inhibition | hsa04150 | ||
| In Vitro Model | A549 cells | Lung | Homo sapiens (Human) | CVCL_0023 |
| LTEP-a-2 cells | Lung | Homo sapiens (Human) | CVCL_6929 | |
| In Vivo Model | Nude mouse xenograft model | Mus musculus | ||
| Experiment for Molecule Alteration |
Western blot analysis | |||
| Experiment for Drug Resistance |
MTT assay; Flow cytometry assay | |||
| Mechanism Description | Combination of celastrol and miR-33a-5p increases the expression of miR-33a-5p to inhibit the mTOR signaling pathway. | |||
Disease- and Tissue-specific Abundances of This Molecule
ICD Disease Classification 02

| Differential expression of molecule in resistant diseases | ||
| The Studied Tissue | Nervous tissue | |
| The Specified Disease | Brain cancer | |
| The Expression Level of Disease Section Compare with the Healthy Individual Tissue | p-value: 3.79E-15; Fold-change: -8.92E-02; Z-score: -5.01E-01 | |
|
Molecule expression in the diseased tissue of patients
Molecule expression in the normal tissue of healthy individuals
|
||
| Disease-specific Molecule Abundances |

|
Click to View the Clearer Original Diagram |
| The Studied Tissue | Brainstem tissue | |
| The Specified Disease | Glioma | |
| The Expression Level of Disease Section Compare with the Healthy Individual Tissue | p-value: 6.62E-01; Fold-change: -3.46E-02; Z-score: -2.66E-01 | |
|
Molecule expression in the diseased tissue of patients
Molecule expression in the normal tissue of healthy individuals
|
||
| Disease-specific Molecule Abundances |
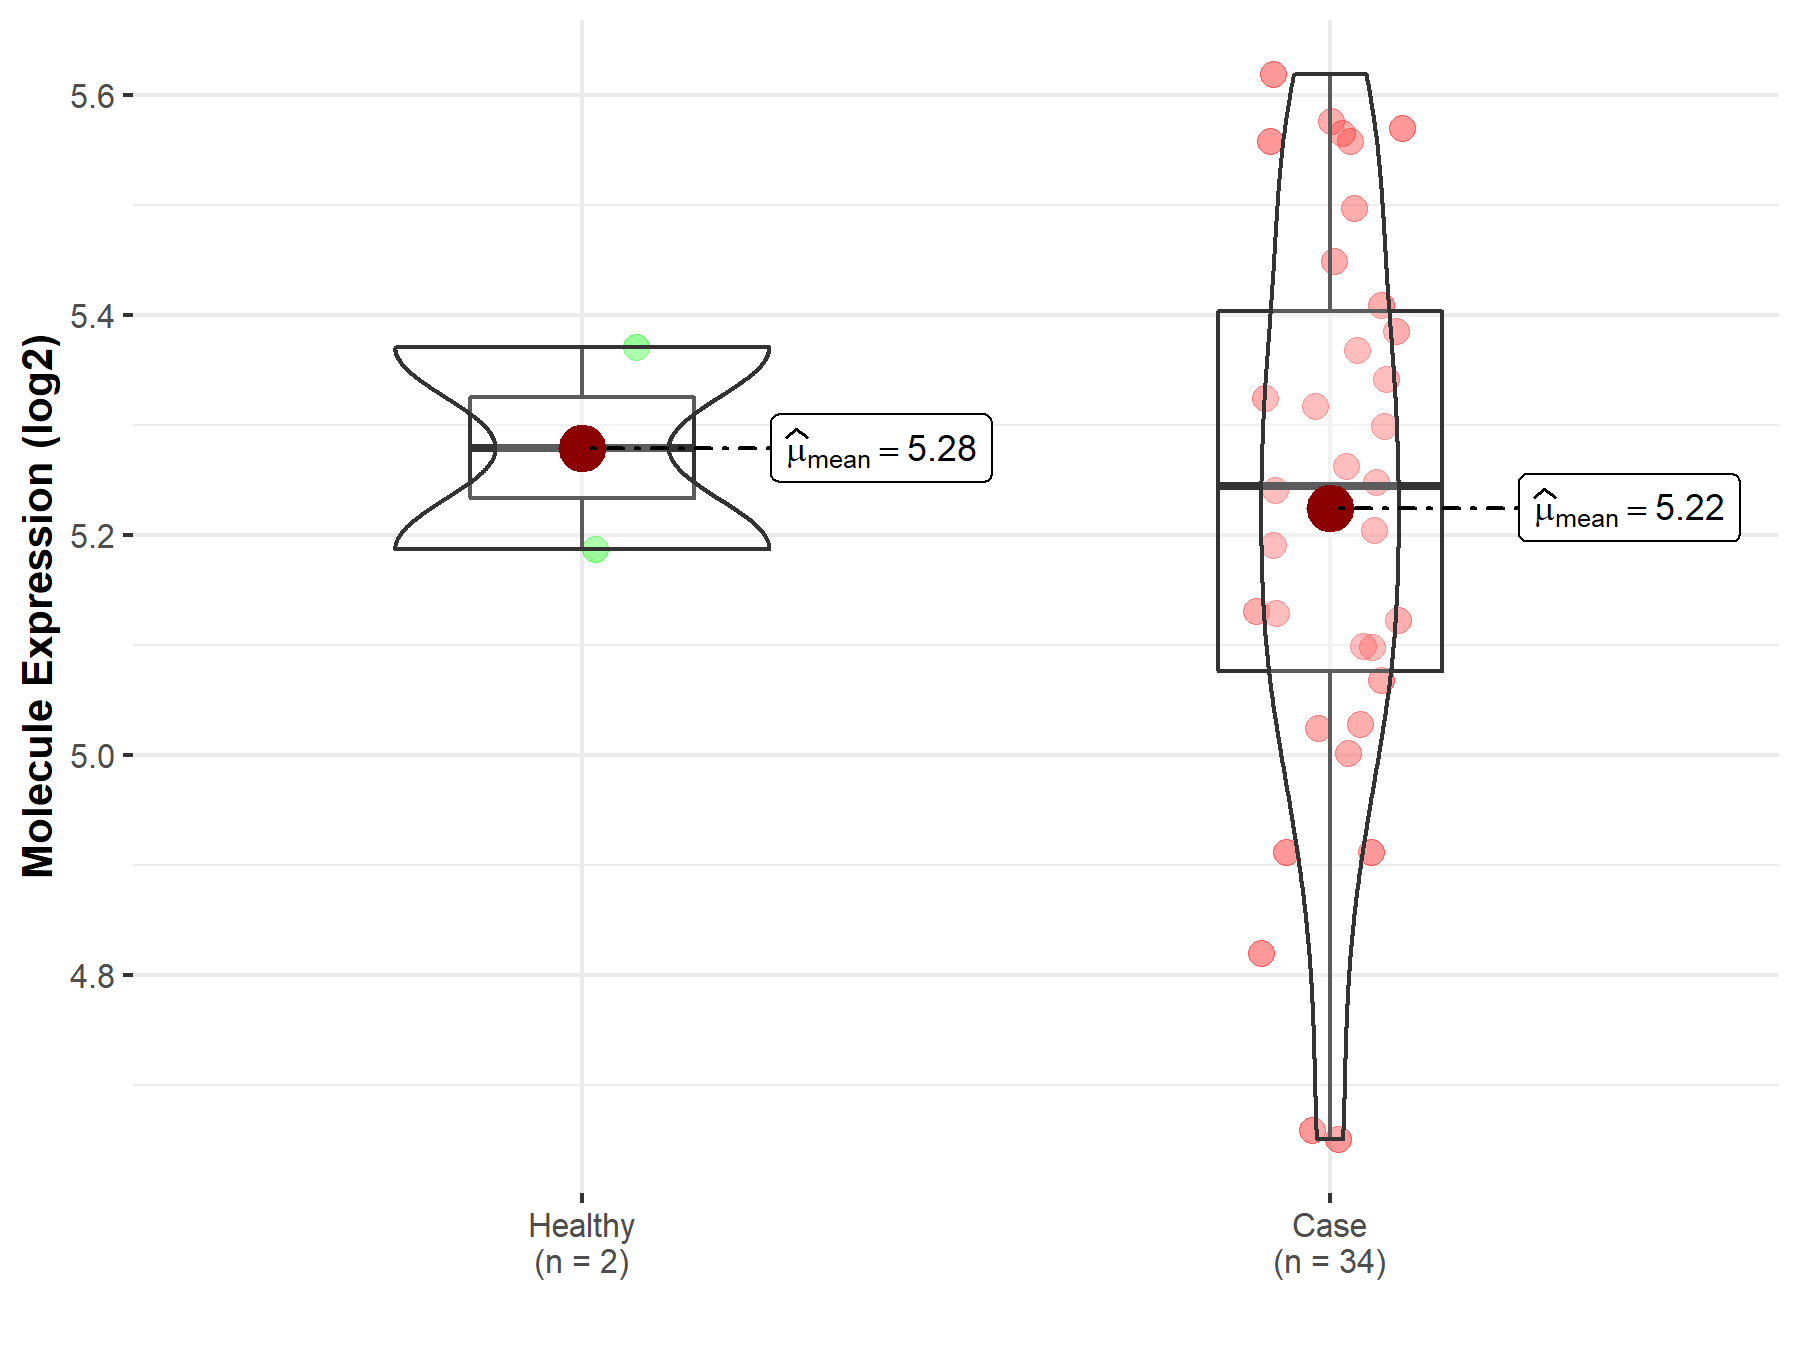
|
Click to View the Clearer Original Diagram |
| The Studied Tissue | White matter | |
| The Specified Disease | Glioma | |
| The Expression Level of Disease Section Compare with the Healthy Individual Tissue | p-value: 4.64E-02; Fold-change: -2.79E-01; Z-score: -9.19E-01 | |
|
Molecule expression in the diseased tissue of patients
Molecule expression in the normal tissue of healthy individuals
|
||
| Disease-specific Molecule Abundances |

|
Click to View the Clearer Original Diagram |
| The Studied Tissue | Brainstem tissue | |
| The Specified Disease | Neuroectodermal tumor | |
| The Expression Level of Disease Section Compare with the Healthy Individual Tissue | p-value: 8.18E-01; Fold-change: 1.05E-02; Z-score: 9.24E-02 | |
|
Molecule expression in the diseased tissue of patients
Molecule expression in the normal tissue of healthy individuals
|
||
| Disease-specific Molecule Abundances |
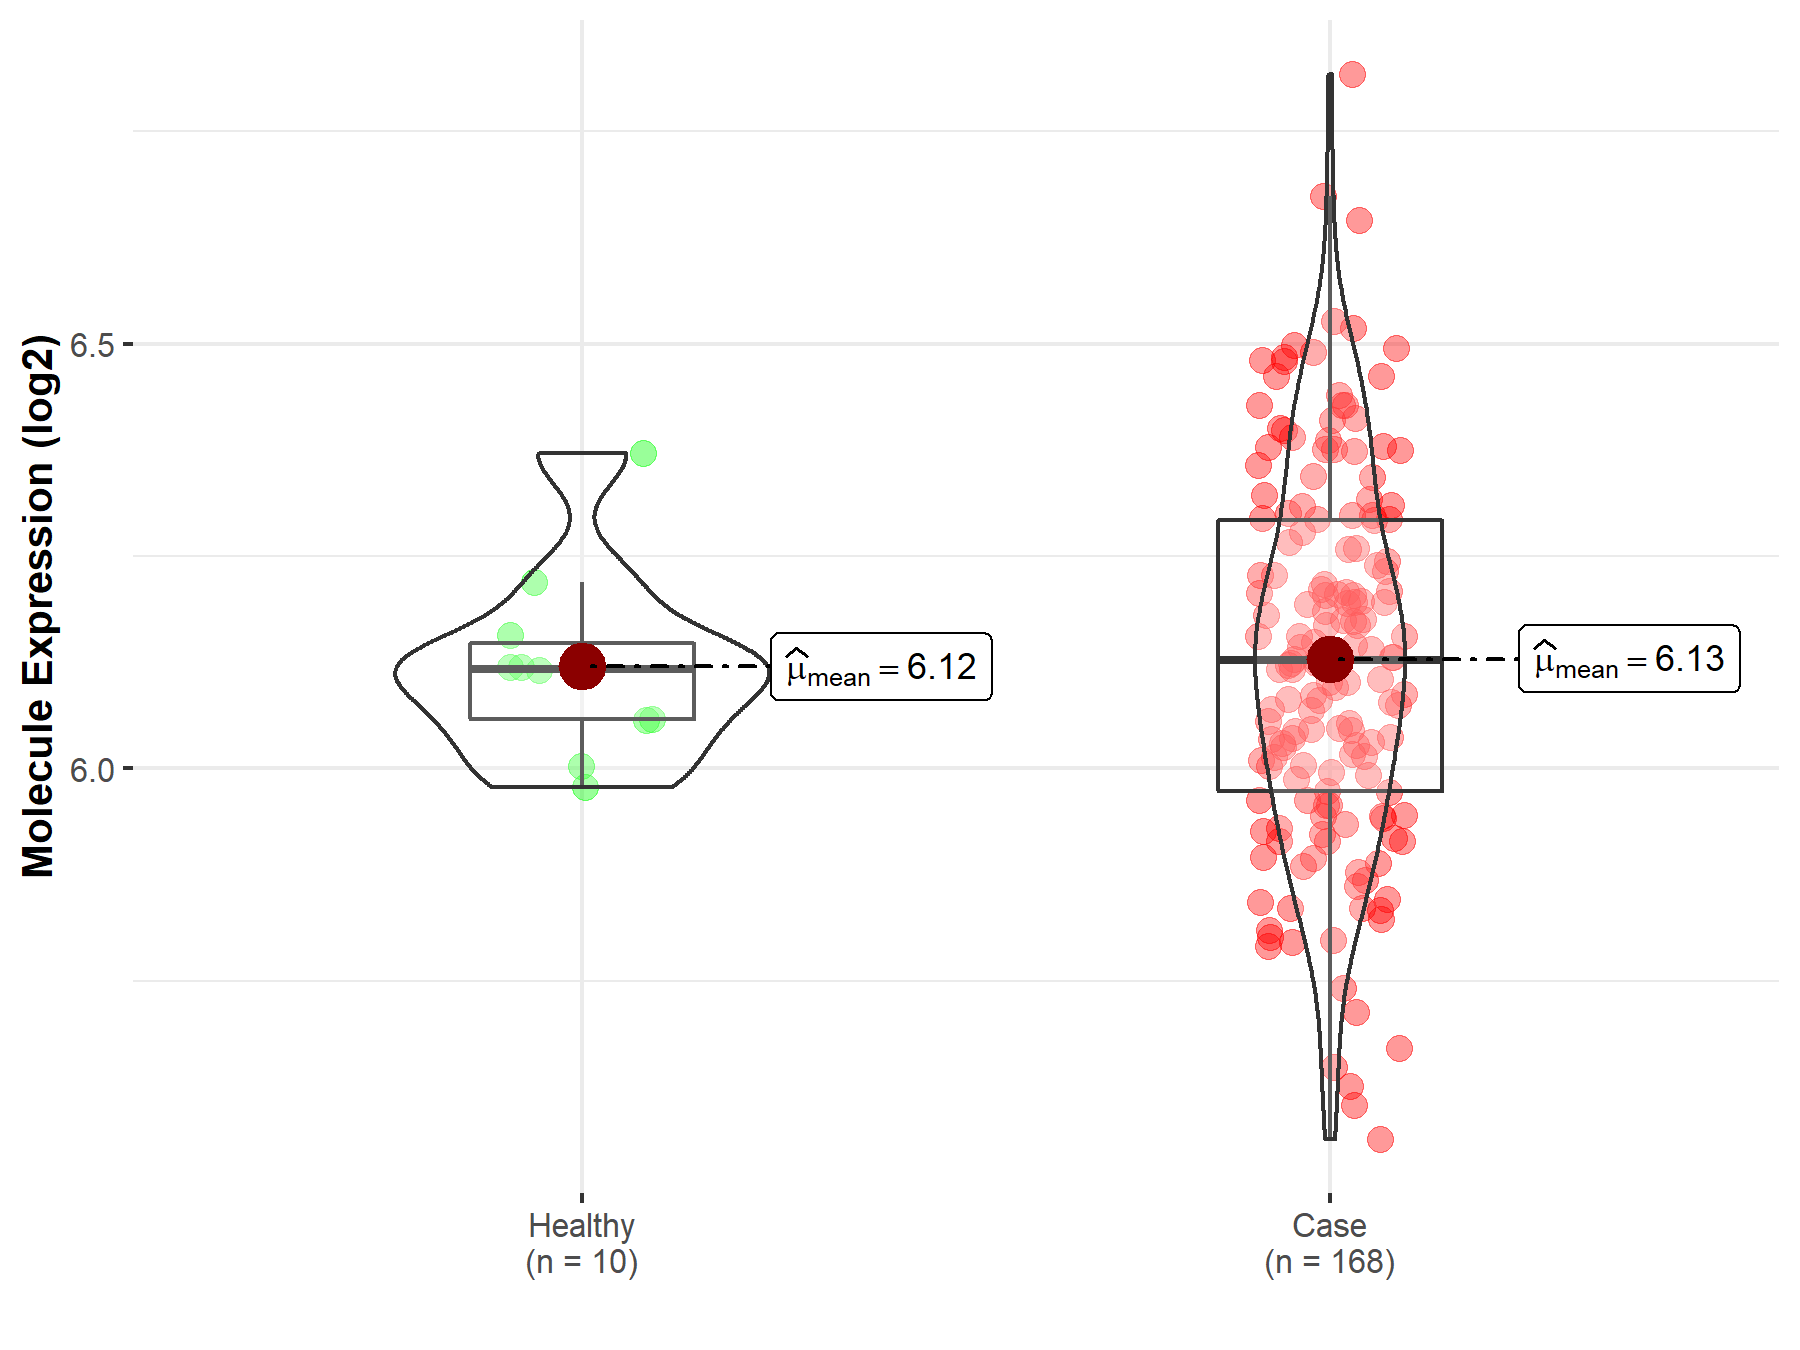
|
Click to View the Clearer Original Diagram |
| Differential expression of molecule in resistant diseases | ||
| The Studied Tissue | Oral tissue | |
| The Specified Disease | Oral squamous cell carcinoma | |
| The Expression Level of Disease Section Compare with the Healthy Individual Tissue | p-value: 1.20E-01; Fold-change: -1.14E-01; Z-score: -4.34E-01 | |
| The Expression Level of Disease Section Compare with the Adjacent Tissue | p-value: 9.87E-01; Fold-change: -7.21E-03; Z-score: -3.00E-02 | |
|
Molecule expression in the normal tissue adjacent to the diseased tissue of patients
Molecule expression in the diseased tissue of patients
Molecule expression in the normal tissue of healthy individuals
|
||
| Disease-specific Molecule Abundances |
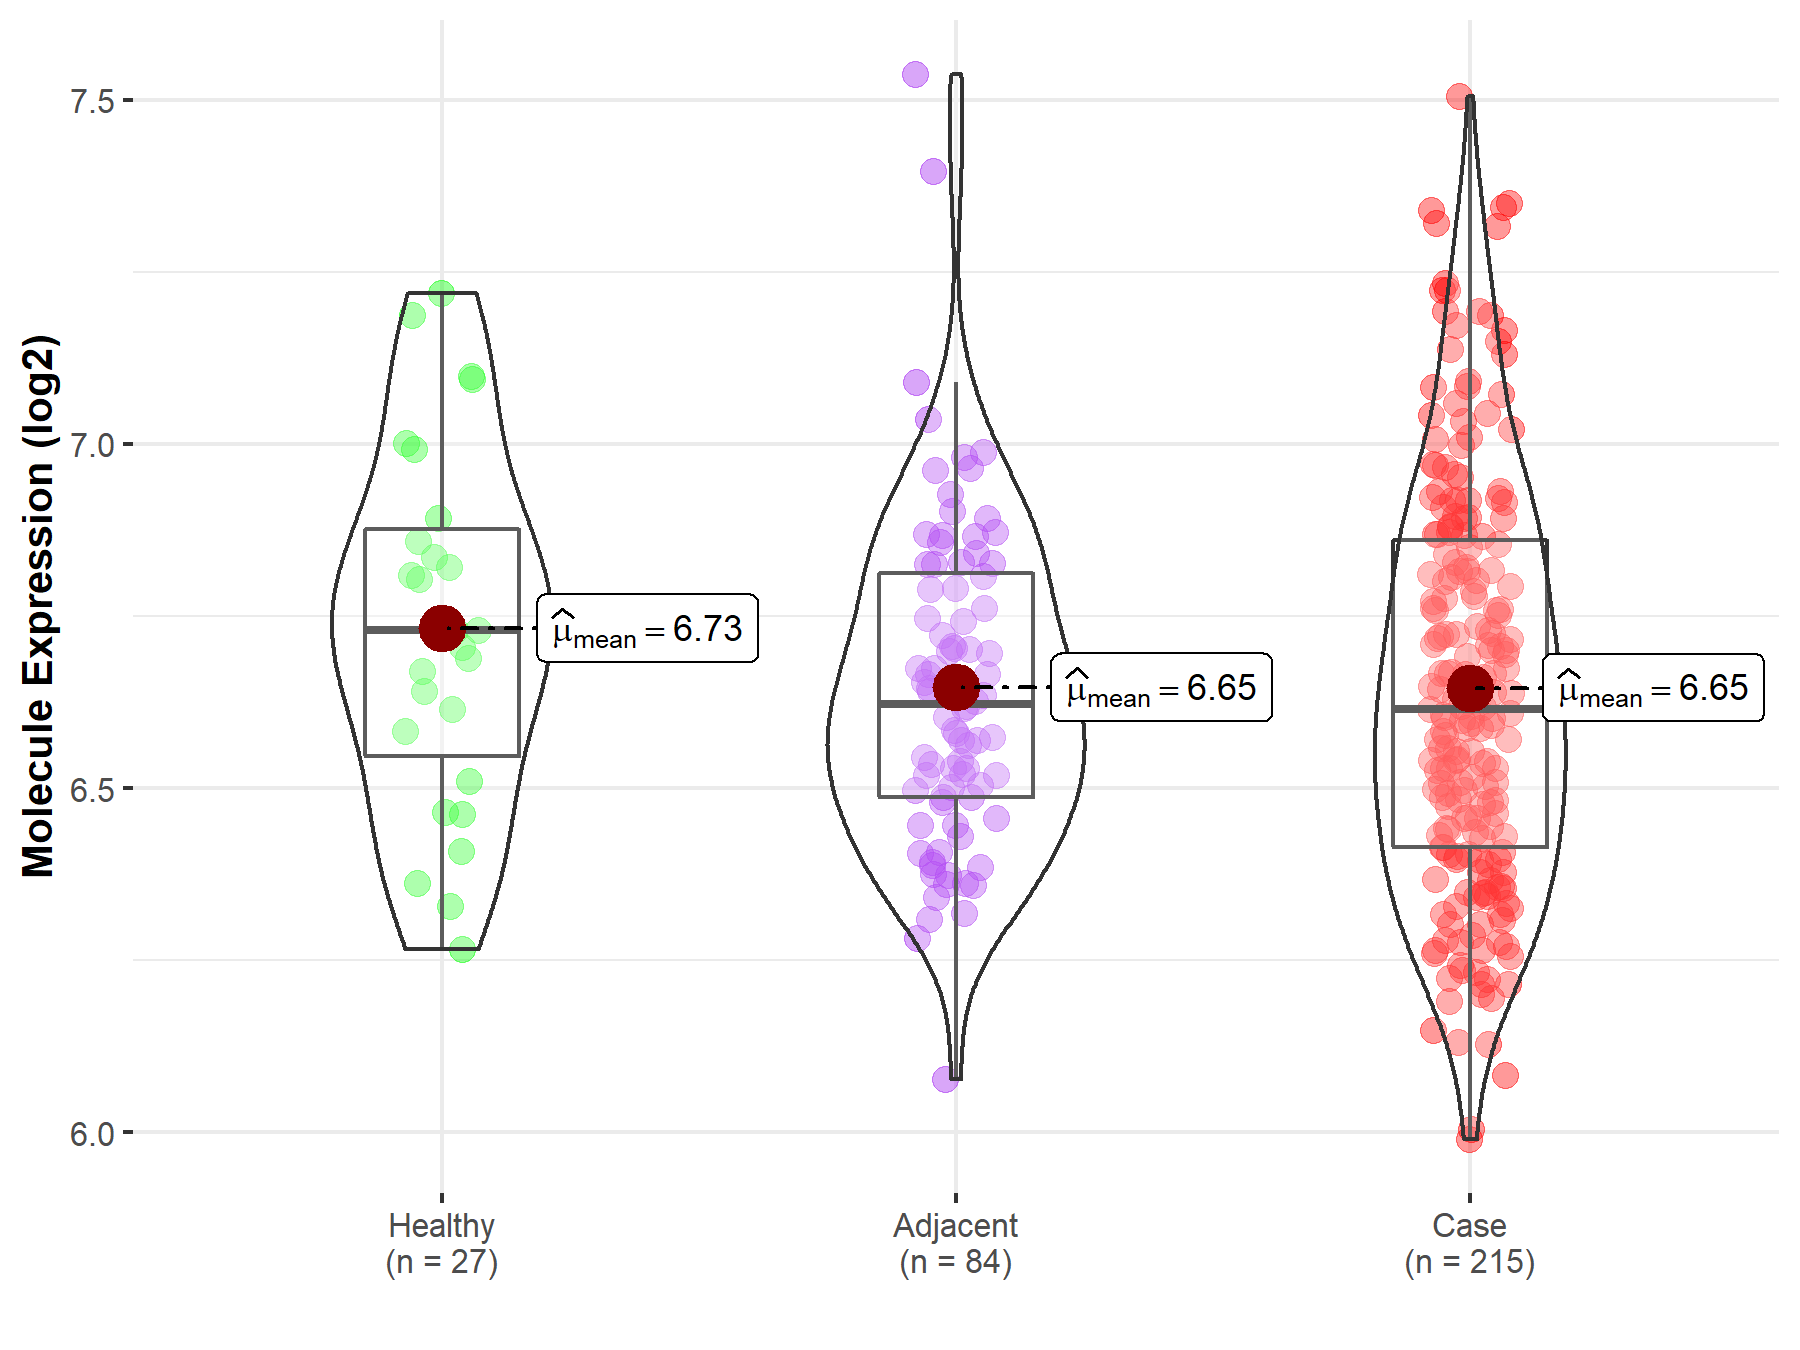
|
Click to View the Clearer Original Diagram |
| Differential expression of molecule in resistant diseases | ||
| The Studied Tissue | Gastric tissue | |
| The Specified Disease | Gastric cancer | |
| The Expression Level of Disease Section Compare with the Healthy Individual Tissue | p-value: 3.80E-01; Fold-change: 1.17E-01; Z-score: 8.60E-01 | |
| The Expression Level of Disease Section Compare with the Adjacent Tissue | p-value: 7.96E-01; Fold-change: 4.28E-04; Z-score: 2.40E-03 | |
|
Molecule expression in the normal tissue adjacent to the diseased tissue of patients
Molecule expression in the diseased tissue of patients
Molecule expression in the normal tissue of healthy individuals
|
||
| Disease-specific Molecule Abundances |
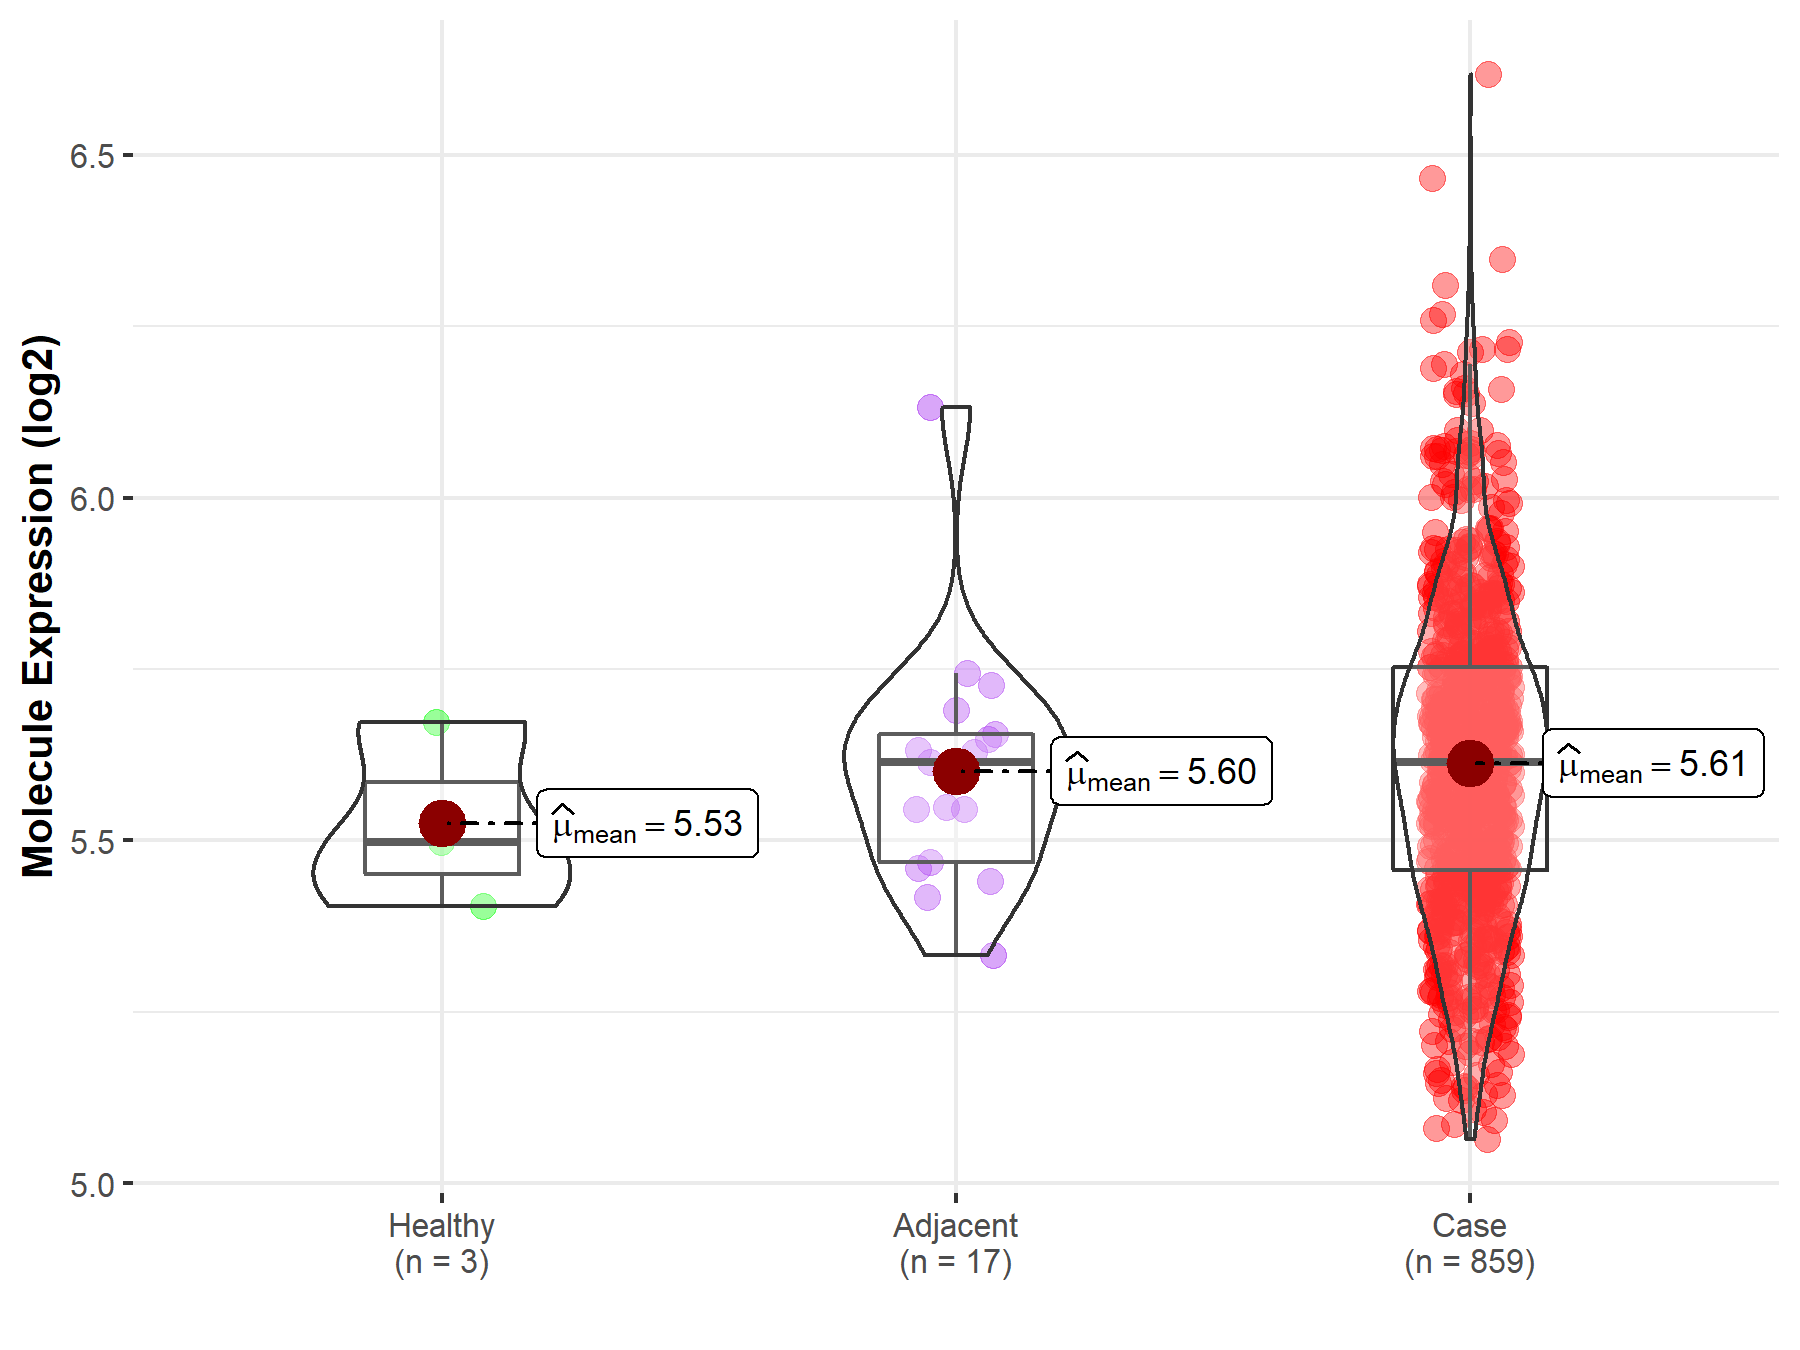
|
Click to View the Clearer Original Diagram |
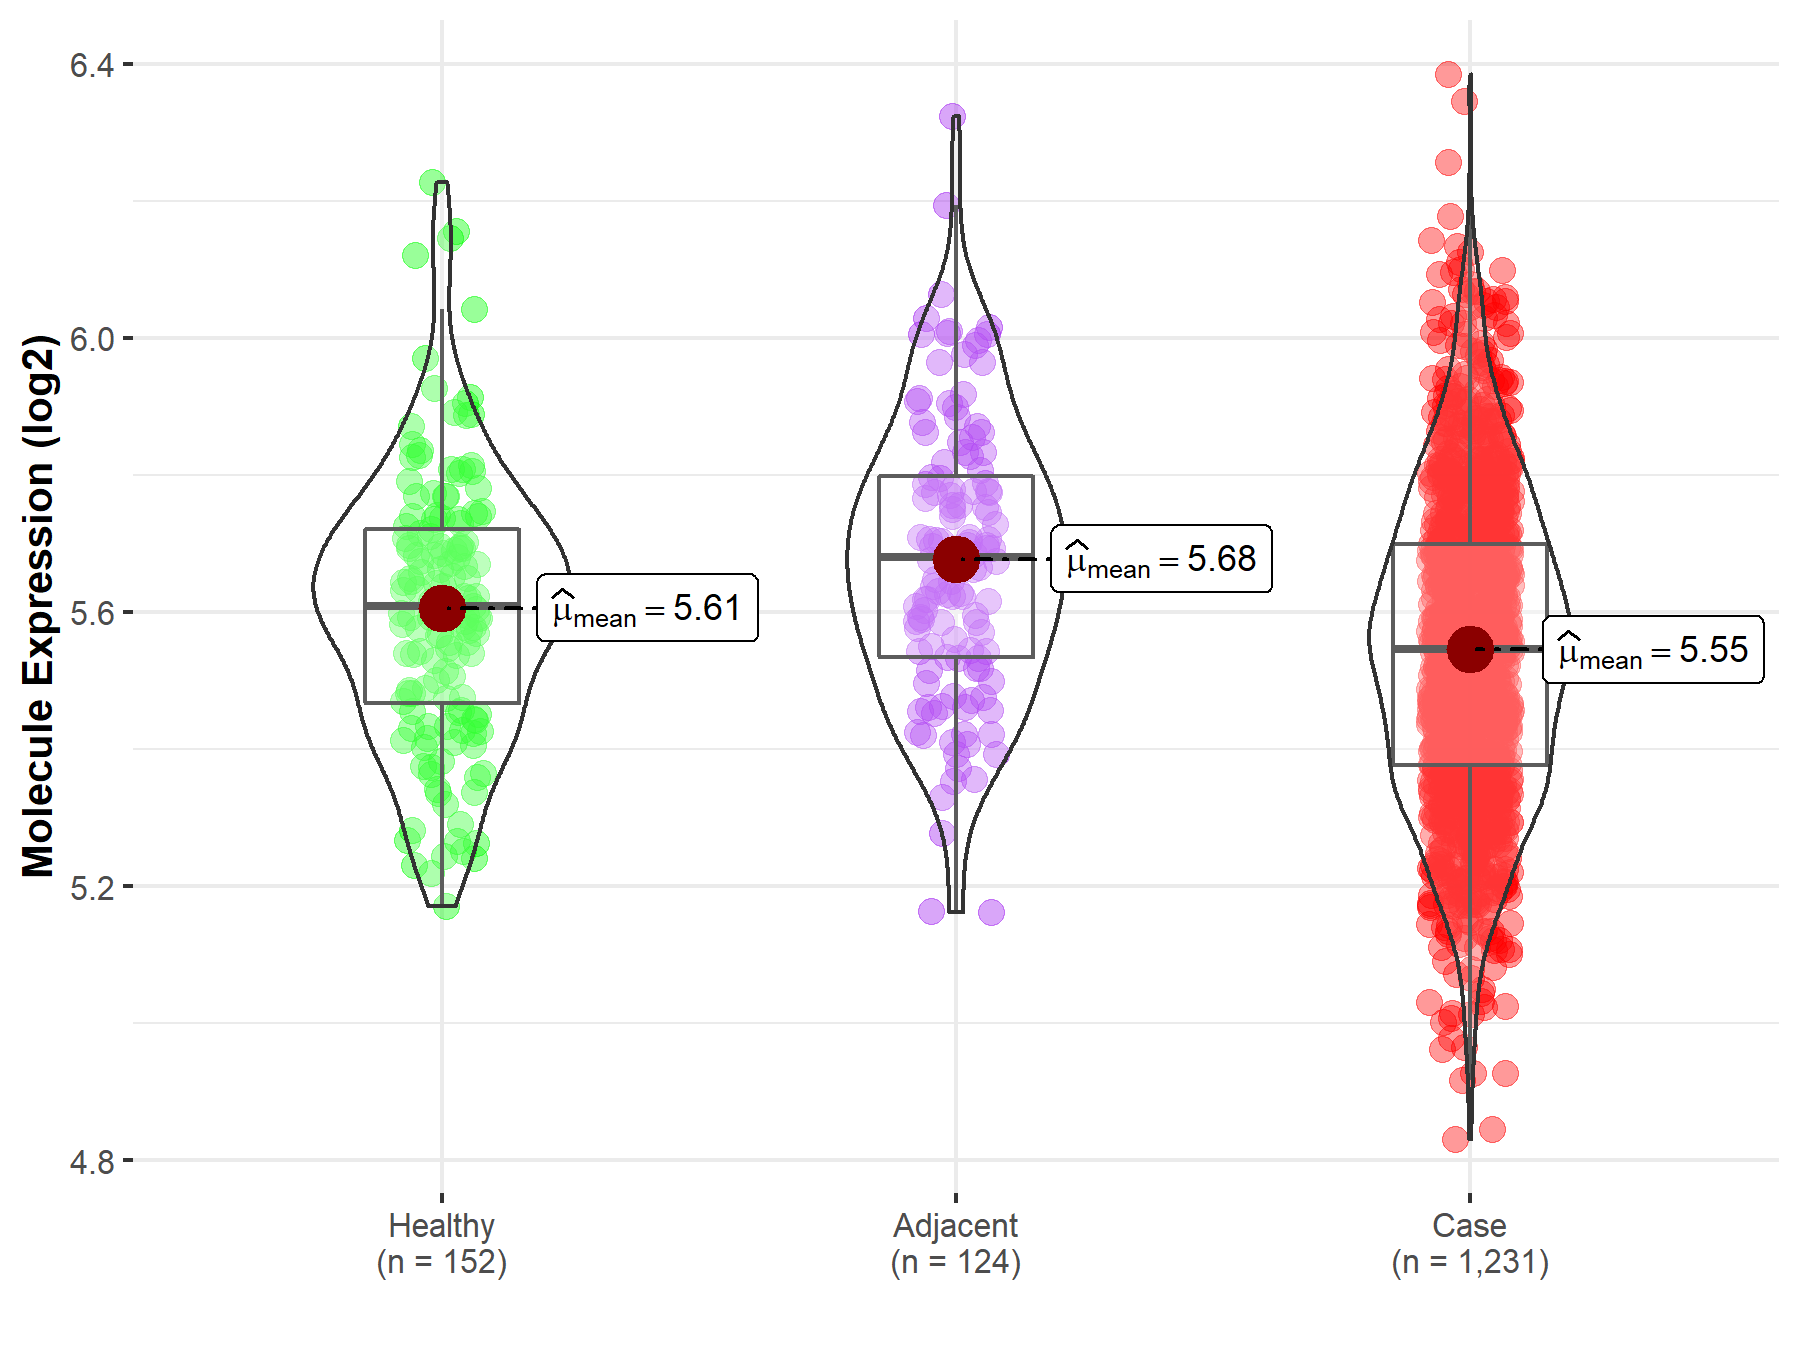
| Differential expression of molecule in resistant diseases | ||
| The Studied Tissue | Colon | |
| The Specified Disease | Colon cancer | |
| The Expression Level of Disease Section Compare with the Healthy Individual Tissue | p-value: 5.38E-04; Fold-change: -6.19E-02; Z-score: -3.14E-01 | |
| The Expression Level of Disease Section Compare with the Adjacent Tissue | p-value: 2.90E-10; Fold-change: -1.34E-01; Z-score: -6.50E-01 | |
|
Molecule expression in the normal tissue adjacent to the diseased tissue of patients
Molecule expression in the diseased tissue of patients
Molecule expression in the normal tissue of healthy individuals
|
||
| Disease-specific Molecule Abundances |
|
Click to View the Clearer Original Diagram |
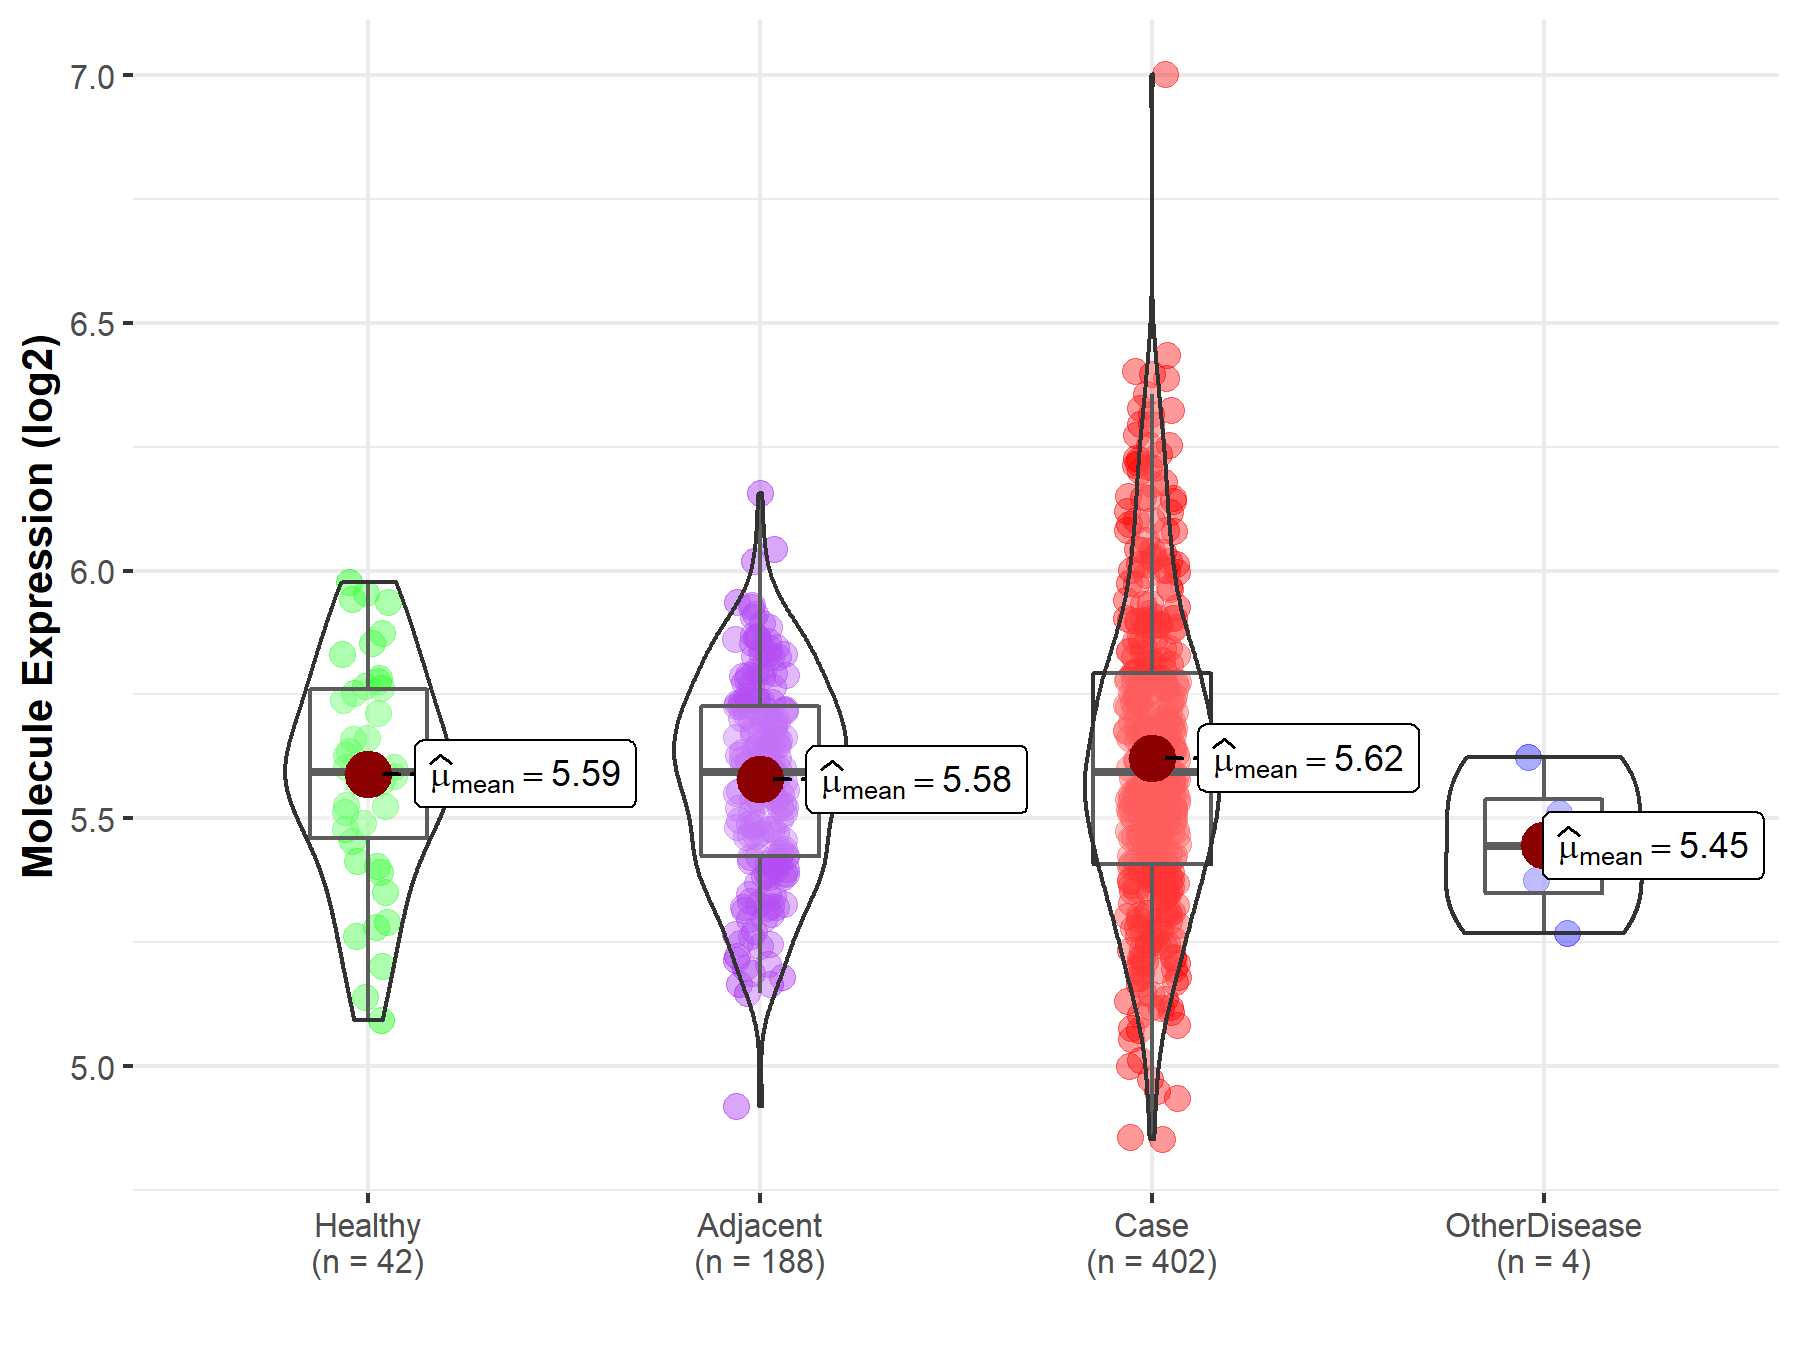
| Differential expression of molecule in resistant diseases | ||
| The Studied Tissue | Liver | |
| The Specified Disease | Liver cancer | |
| The Expression Level of Disease Section Compare with the Healthy Individual Tissue | p-value: 4.03E-01; Fold-change: 6.65E-04; Z-score: 2.97E-03 | |
| The Expression Level of Disease Section Compare with the Adjacent Tissue | p-value: 4.61E-02; Fold-change: 2.81E-06; Z-score: 1.35E-05 | |
| The Expression Level of Disease Section Compare with the Other Disease Section | p-value: 1.05E-01; Fold-change: 1.50E-01; Z-score: 9.66E-01 | |
|
Molecule expression in the normal tissue adjacent to the diseased tissue of patients
Molecule expression in the diseased tissue of patients
Molecule expression in the normal tissue of healthy individuals
Molecule expression in tissue other than the diseased tissue of patients
|
||
| Disease-specific Molecule Abundances |
|
Click to View the Clearer Original Diagram |
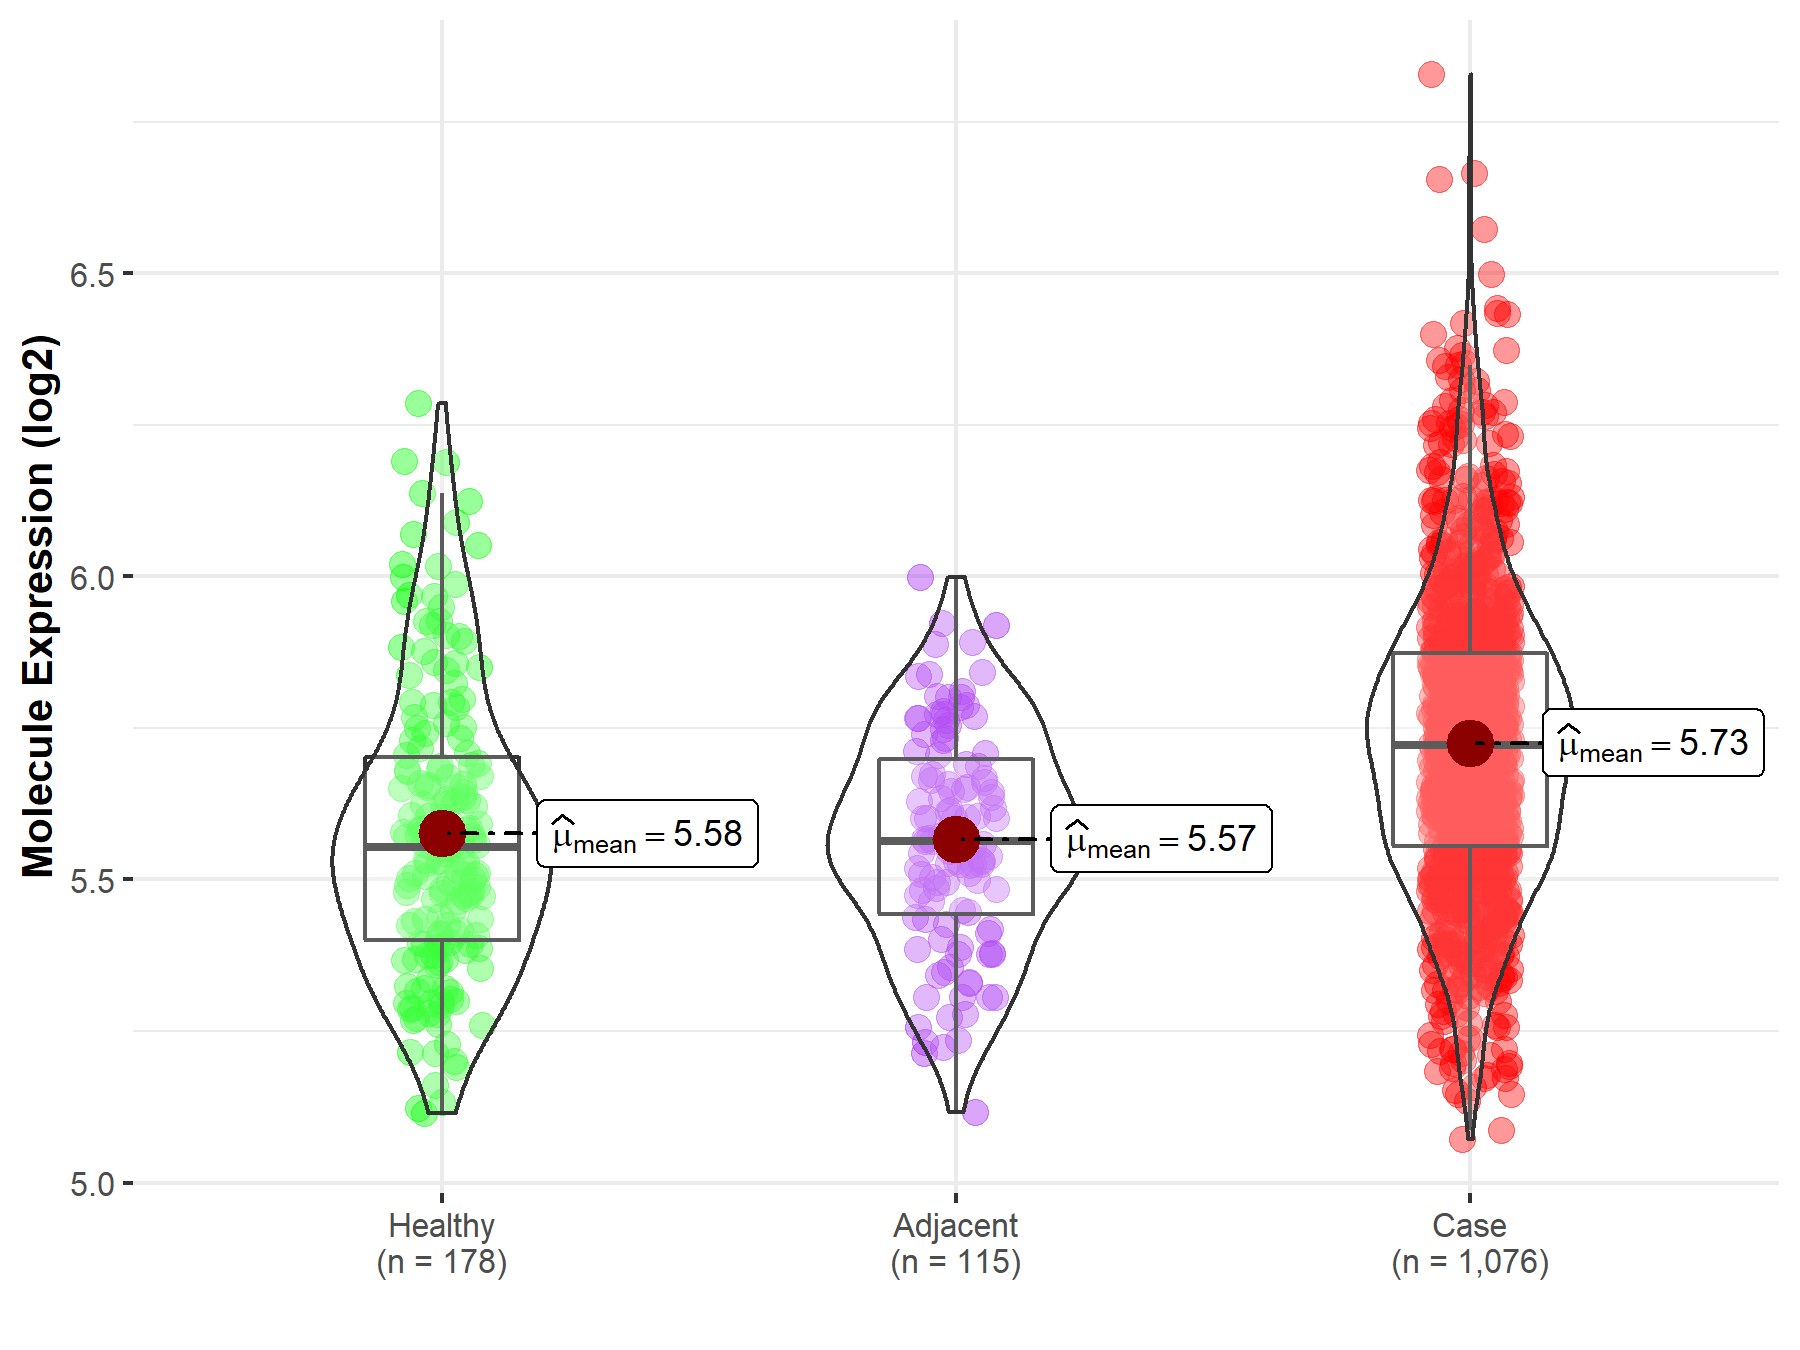
| Differential expression of molecule in resistant diseases | ||
| The Studied Tissue | Lung | |
| The Specified Disease | Lung cancer | |
| The Expression Level of Disease Section Compare with the Healthy Individual Tissue | p-value: 3.07E-13; Fold-change: 1.68E-01; Z-score: 7.07E-01 | |
| The Expression Level of Disease Section Compare with the Adjacent Tissue | p-value: 8.18E-15; Fold-change: 1.59E-01; Z-score: 8.75E-01 | |
|
Molecule expression in the normal tissue adjacent to the diseased tissue of patients
Molecule expression in the diseased tissue of patients
Molecule expression in the normal tissue of healthy individuals
|
||
| Disease-specific Molecule Abundances |
|
Click to View the Clearer Original Diagram |
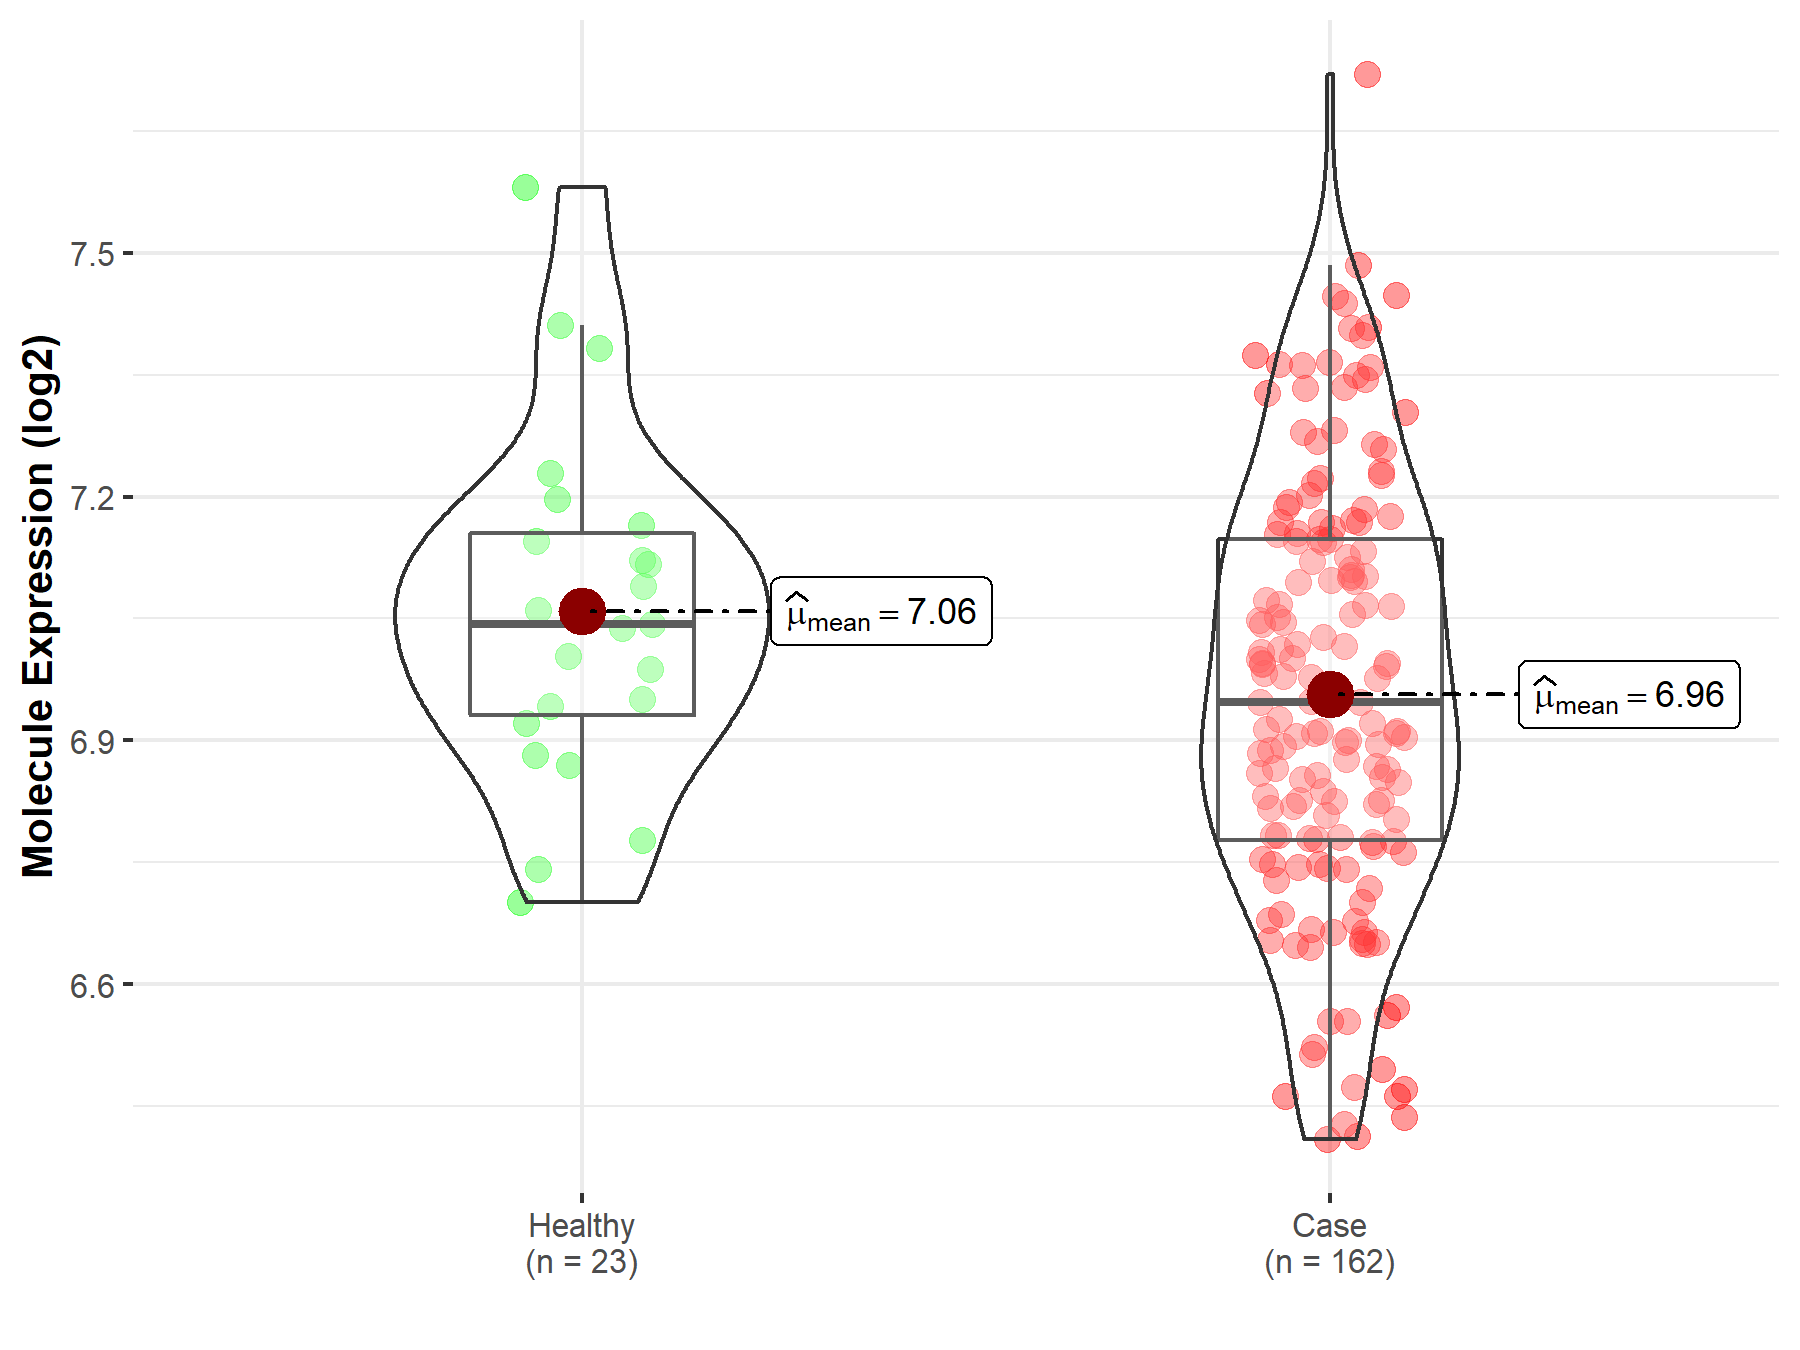
| Differential expression of molecule in resistant diseases | ||
| The Studied Tissue | Skin | |
| The Specified Disease | Melanoma | |
| The Expression Level of Disease Section Compare with the Healthy Individual Tissue | p-value: 4.51E-02; Fold-change: -9.55E-02; Z-score: -4.47E-01 | |
|
Molecule expression in the diseased tissue of patients
Molecule expression in the normal tissue of healthy individuals
|
||
| Disease-specific Molecule Abundances |
|
Click to View the Clearer Original Diagram |
| Differential expression of molecule in resistant diseases | ||
| The Studied Tissue | Breast tissue | |
| The Specified Disease | Breast cancer | |
| The Expression Level of Disease Section Compare with the Healthy Individual Tissue | p-value: 1.52E-01; Fold-change: 2.53E-02; Z-score: 1.26E-01 | |
| The Expression Level of Disease Section Compare with the Adjacent Tissue | p-value: 6.20E-01; Fold-change: 1.71E-02; Z-score: 5.63E-02 | |
|
Molecule expression in the normal tissue adjacent to the diseased tissue of patients
Molecule expression in the diseased tissue of patients
Molecule expression in the normal tissue of healthy individuals
|
||
| Disease-specific Molecule Abundances |

|
Click to View the Clearer Original Diagram |
| Differential expression of molecule in resistant diseases | ||
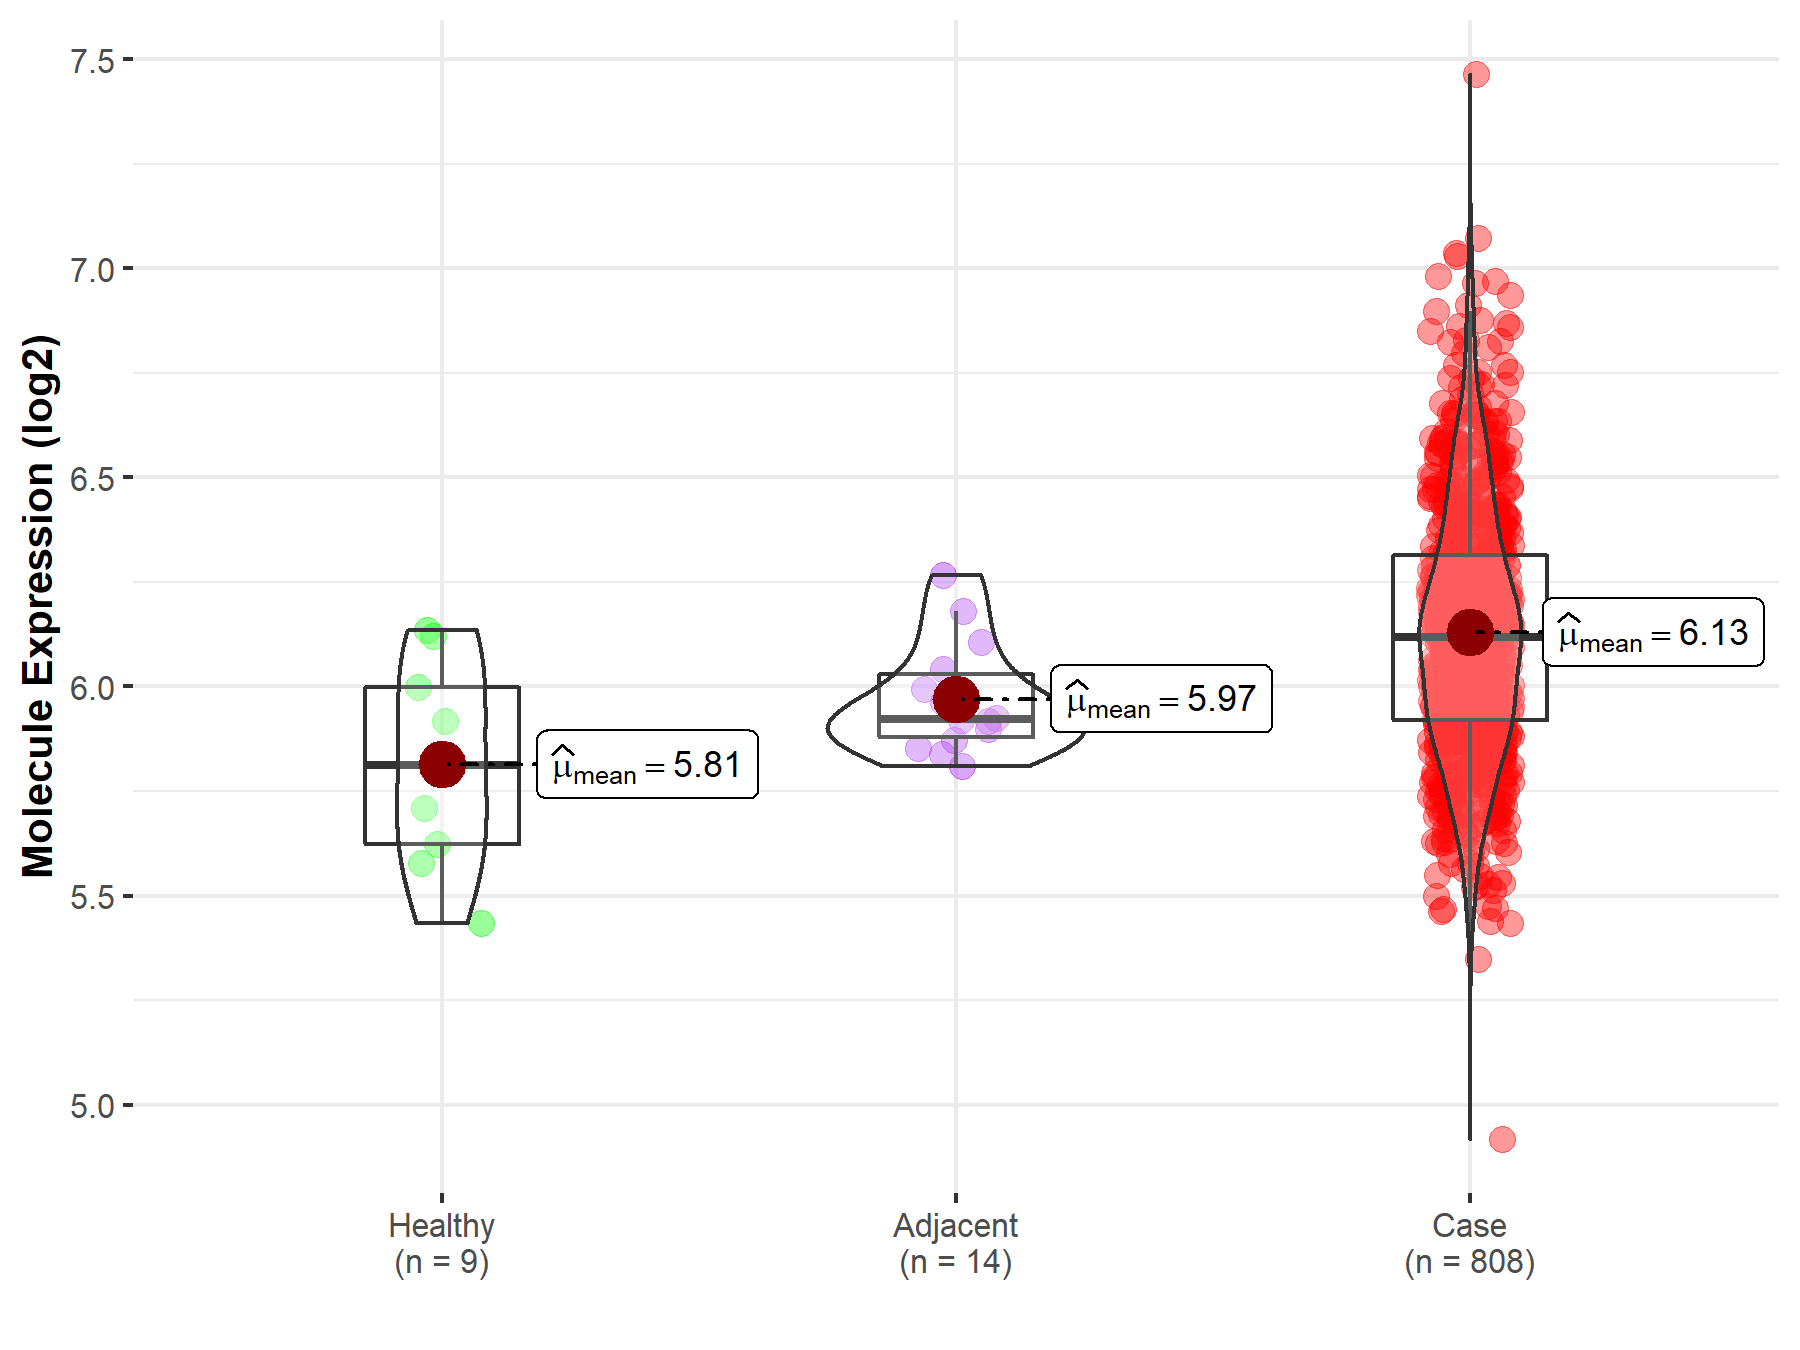
| The Studied Tissue | Ovary | |
| The Specified Disease | Ovarian cancer | |
| The Expression Level of Disease Section Compare with the Healthy Individual Tissue | p-value: 4.89E-03; Fold-change: 3.07E-01; Z-score: 1.24E+00 | |
| The Expression Level of Disease Section Compare with the Adjacent Tissue | p-value: 6.56E-04; Fold-change: 1.96E-01; Z-score: 1.46E+00 | |
|
Molecule expression in the normal tissue adjacent to the diseased tissue of patients
Molecule expression in the diseased tissue of patients
Molecule expression in the normal tissue of healthy individuals
|
||
| Disease-specific Molecule Abundances |
|
Click to View the Clearer Original Diagram |
| Differential expression of molecule in resistant diseases | ||
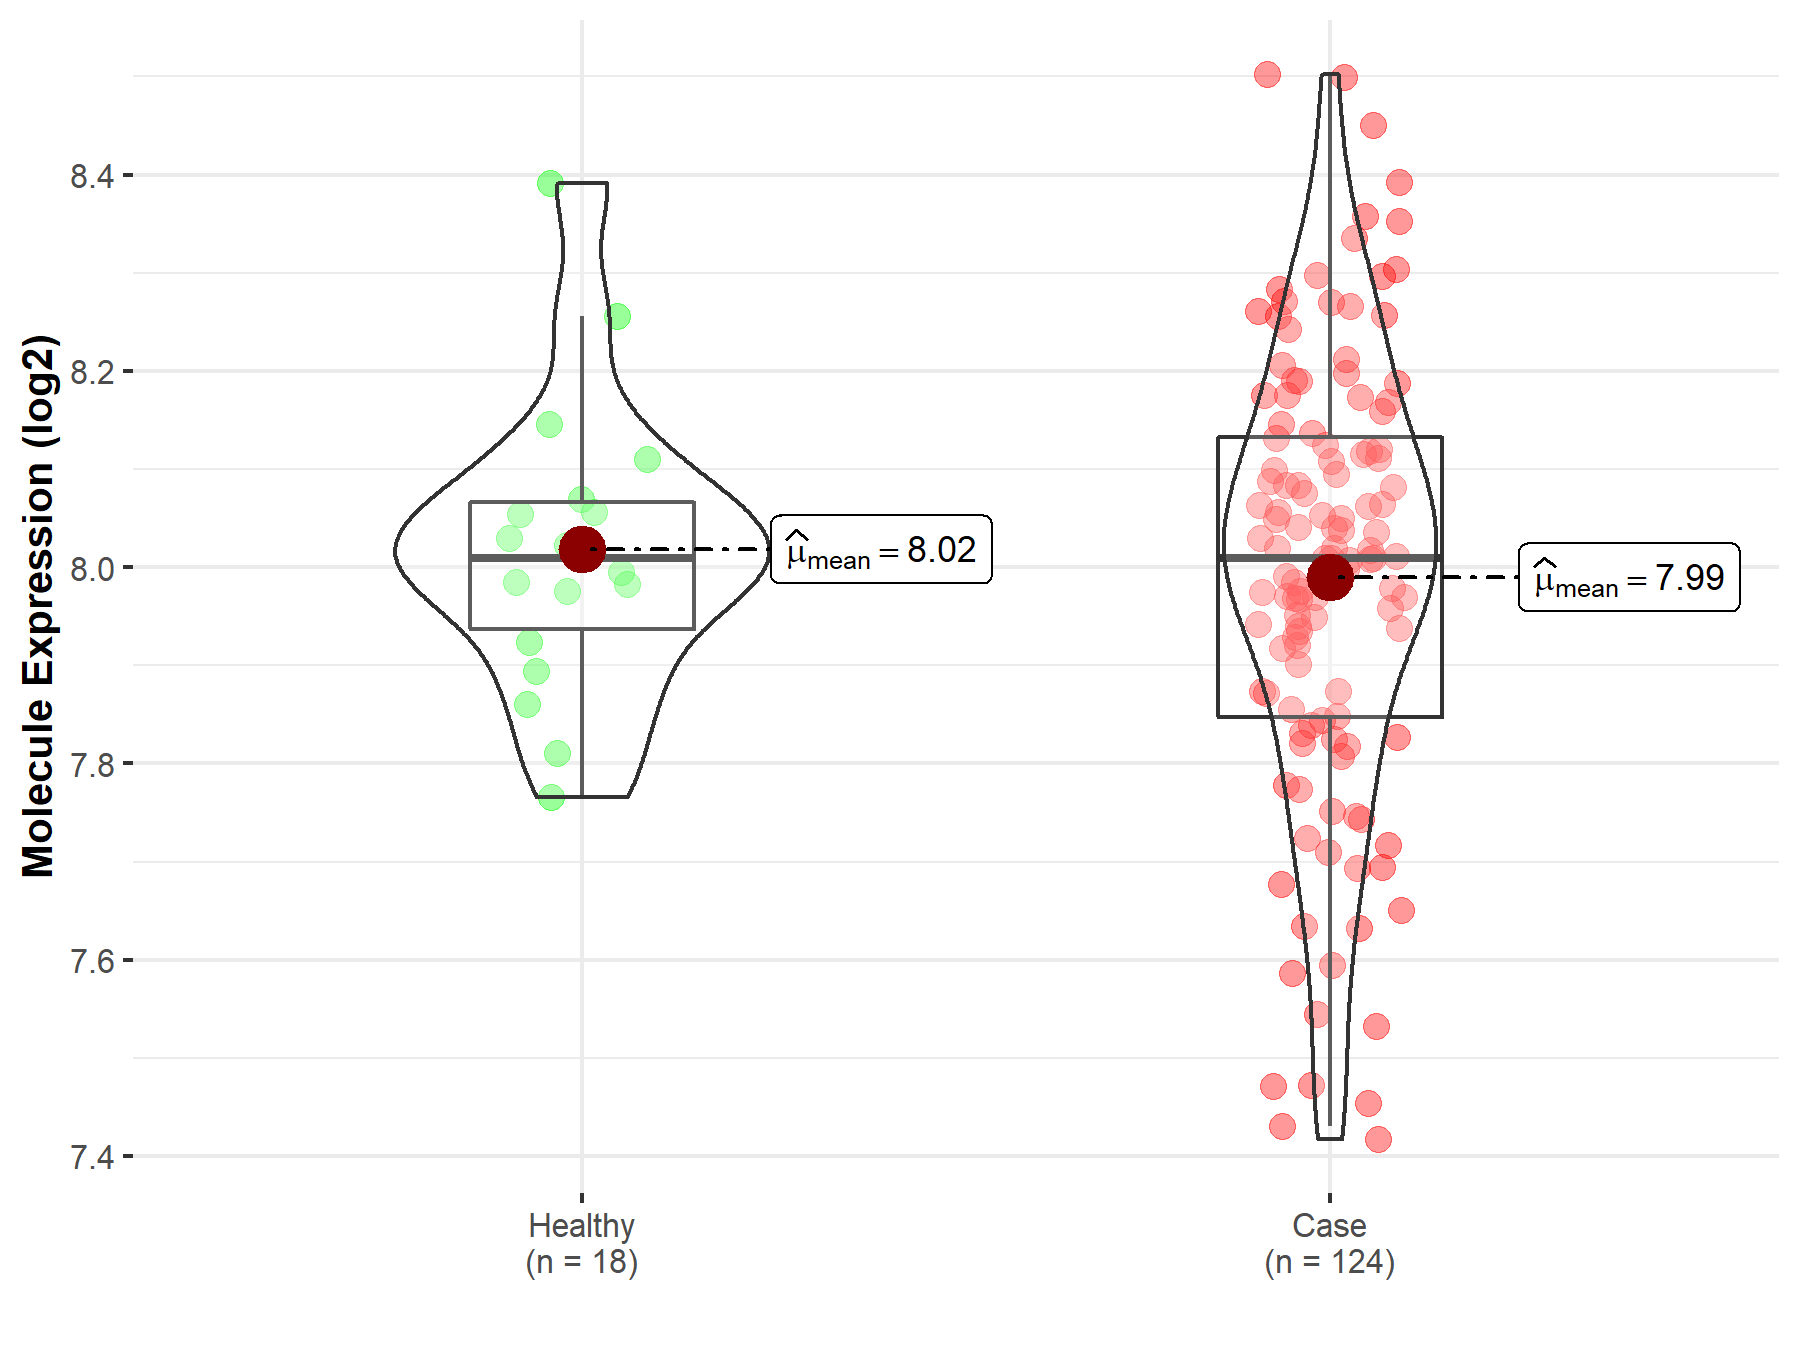
| The Studied Tissue | Cervix uteri | |
| The Specified Disease | Cervical cancer | |
| The Expression Level of Disease Section Compare with the Healthy Individual Tissue | p-value: 4.94E-01; Fold-change: 6.08E-04; Z-score: 4.03E-03 | |
|
Molecule expression in the diseased tissue of patients
Molecule expression in the normal tissue of healthy individuals
|
||
| Disease-specific Molecule Abundances |
|
Click to View the Clearer Original Diagram |
| Differential expression of molecule in resistant diseases | ||
| The Studied Tissue | Thyroid | |
| The Specified Disease | Thyroid cancer | |
| The Expression Level of Disease Section Compare with the Healthy Individual Tissue | p-value: 2.00E-07; Fold-change: 9.74E-02; Z-score: 5.71E-01 | |
| The Expression Level of Disease Section Compare with the Adjacent Tissue | p-value: 2.18E-06; Fold-change: 1.26E-01; Z-score: 7.46E-01 | |
|
Molecule expression in the normal tissue adjacent to the diseased tissue of patients
Molecule expression in the diseased tissue of patients
Molecule expression in the normal tissue of healthy individuals
|
||
| Disease-specific Molecule Abundances |

|
Click to View the Clearer Original Diagram |
Tissue-specific Molecule Abundances in Healthy Individuals


|
||
References
If you find any error in data or bug in web service, please kindly report it to Dr. Sun and Dr. Yu.
