Molecule Information
General Information of the Molecule (ID: Mol00086)
| Name |
High mobility group protein B1 (HMGB1)
,Homo sapiens
|
||||
|---|---|---|---|---|---|
| Synonyms |
High mobility group protein 1; HMG-1; HMG1
Click to Show/Hide
|
||||
| Molecule Type |
Protein
|
||||
| Gene Name |
HMGB1
|
||||
| Gene ID | |||||
| Location |
chr13:30456704-30617597[-]
|
||||
| Sequence |
MGKGDPKKPRGKMSSYAFFVQTCREEHKKKHPDASVNFSEFSKKCSERWKTMSAKEKGKF
EDMAKADKARYEREMKTYIPPKGETKKKFKDPNAPKRPPSAFFLFCSEYRPKIKGEHPGL SIGDVAKKLGEMWNNTAADDKQPYEKKAAKLKEKYEKDIAAYRAKGKPDAAKKGVVKAEK SKKKKEEEEDEEDEEDEEEEEDEEDEDEEEDDDDE Click to Show/Hide
|
||||
| 3D-structure |
|
||||
| Function |
Multifunctional redox sensitive protein with various roles in different cellular compartments. In the nucleus is one of the major chromatin-associated non-histone proteins and acts as a DNA chaperone involved in replication, transcription, chromatin remodeling, V(D)J recombination, DNA repair and genome stability (Ref.71). Proposed to be an universal biosensor for nucleic acids. Promotes host inflammatory response to sterile and infectious signals and is involved in the coordination and integration of innate and adaptive immune responses. In the cytoplasm functions as sensor and/or chaperone for immunogenic nucleic acids implicating the activation of TLR9-mediated immune responses, and mediates autophagy. Acts as danger associated molecular pattern (DAMP) molecule that amplifies immune responses during tissue injury. Released to the extracellular environment can bind DNA, nucleosomes, IL-1 beta, CXCL12, AGER isoform 2/sRAGE, lipopolysaccharide (LPS) and lipoteichoic acid (LTA), and activates cells through engagement of multiple surface receptors. In the extracellular compartment fully reduced HMGB1 (released by necrosis) acts as a chemokine, disulfide HMGB1 (actively secreted) as a cytokine, and sulfonyl HMGB1 (released from apoptotic cells) promotes immunological tolerance. Has proangiogdenic activity. May be involved in platelet activation. Binds to phosphatidylserine and phosphatidylethanolamide. Bound to RAGE mediates signaling for neuronal outgrowth. May play a role in accumulation of expanded polyglutamine (polyQ) proteins such as huntingtin (HTT) or TBP.
Click to Show/Hide
|
||||
| Uniprot ID | |||||
| Ensembl ID | |||||
| HGNC ID | |||||
| Click to Show/Hide the Complete Species Lineage | |||||
Type(s) of Resistant Mechanism of This Molecule
Drug Resistance Data Categorized by Drug
Approved Drug(s)
3 drug(s) in total
| Drug Sensitivity Data Categorized by Their Corresponding Mechanisms | ||||
|
|
||||
| Disease Class: Non-small cell lung cancer [ICD-11: 2C25.Y] | [1] | |||
| Sensitive Disease | Non-small cell lung cancer [ICD-11: 2C25.Y] | |||
| Sensitive Drug | Doxorubicin | |||
| Molecule Alteration | Expression | Down-regulation |
||
| Differential expression of the molecule in resistant disease | ||||
| Classification of Disease | Lung cancer [ICD-11: 2C25] | |||
| The Specified Disease | Non-small cell lung cancer | |||
| The Studied Tissue | Lung tissue | |||
| The Expression Level of Disease Section Compare with the Healthy Individual Tissue | p-value: 5.23E-01 Fold-change: -1.80E-02 Z-score: -6.40E-01 |
|||
| Experimental Note | Revealed Based on the Cell Line Data | |||
| Cell Pathway Regulation | PI3K/AKT/mTOR signaling pathway | Activation | hsa04151 | |
| In Vitro Model | A549 cells | Lung | Homo sapiens (Human) | CVCL_0023 |
| 16HBE cells | Lung | Homo sapiens (Human) | CVCL_0112 | |
| In Vivo Model | Nude mouse xenograft model | Mus musculus | ||
| Experiment for Molecule Alteration |
Western blot analysis; Luciferase reporter assay | |||
| Experiment for Drug Resistance |
Caspase-3 and TUNEL staining assay; MTT assay | |||
| Mechanism Description | miR142-3p regulates starvation-induced autophagy of NSCLC cells by directly downregulating HMGB1 and subsequently activating the PI3k/Akt/mTOR pathway. miR142-3p overexpression inhibited anticancer drug-induced autophagy and increased chemo-sensitivity of NSCLC in vitro and in vivo. | |||
| Disease Class: Acute myeloid leukemia [ICD-11: 2A60.0] | [3] | |||
| Sensitive Disease | Acute myeloid leukemia [ICD-11: 2A60.0] | |||
| Sensitive Drug | Doxorubicin | |||
| Molecule Alteration | Expression | Down-regulation |
||
| Experimental Note | Revealed Based on the Cell Line Data | |||
| Cell Pathway Regulation | Cell apoptosis | Activation | hsa04210 | |
| Cell migration | Inhibition | hsa04670 | ||
| In Vitro Model | HL60 cells | Peripheral blood | Homo sapiens (Human) | CVCL_0002 |
| K562 cells | Blood | Homo sapiens (Human) | CVCL_0004 | |
| Experiment for Molecule Alteration |
Western blot analysis | |||
| Experiment for Drug Resistance |
CCK8 assay | |||
| Mechanism Description | The ectopic expression of miR-181b in k562/A02 and HL-60/ADM cells robustly suppressed endogenous HMGB1 and Mcl-1 expression both at mRNA and protein levels. Conversely, knockdown of miR-181b by miR-181b inhibitor markedly increased the expression of both HMGB1 and Mcl-1. Restoration of miR-181b increased the drug sensitivity of AML MDR cells by targeting HMGB1 and Mcl-1. | |||
| Drug Resistance Data Categorized by Their Corresponding Mechanisms | ||||
|
|
||||
| Disease Class: Medulloblastoma [ICD-11: 2A00.10] | [2] | |||
| Resistant Disease | Medulloblastoma [ICD-11: 2A00.10] | |||
| Resistant Drug | Cisplatin | |||
| Molecule Alteration | Expression | Up-regulation |
||
| Differential expression of the molecule in resistant disease | ||||
| Classification of Disease | Brain cancer [ICD-11: 2A00] | |||
| The Specified Disease | Brain cancer | |||
| The Studied Tissue | Nervous tissue | |||
| The Expression Level of Disease Section Compare with the Healthy Individual Tissue | p-value: 9.33E-116 Fold-change: 8.78E-02 Z-score: 2.68E+01 |
|||
| Experimental Note | Revealed Based on the Cell Line Data | |||
| Cell Pathway Regulation | Cell apoptosis | Inhibition | hsa04210 | |
| Cell proliferation | Activation | hsa05200 | ||
| In Vitro Model | D425 cells | Brain | Homo sapiens (Human) | CVCL_1275 |
| UW228 cells | Brain | Homo sapiens (Human) | CVCL_8585 | |
| Experiment for Molecule Alteration |
Western blot analysis | |||
| Experiment for Drug Resistance |
MTS assay; TUNEL assay | |||
| Mechanism Description | High-Mobility Group Box 1 (HMGB1) is a direct target of miR-let-7f-1. HMGB1 is a highly conserved nuclear protein that functions as a chromatin-binding factor that bends DNA and promotes access to transcriptional protein assemblies on specific DNA targets. Overexpression of HMGB1 in cells treated with pSP and cisplatin blocked SPARC-induced cisplatin resistance indicating that overexpression of miR-let-7f-1 and a reduction in HMGB1 protein levels result in cellular resistance to cisplatin in SPARC over expressed cells. Earlier studies demonstrated that HMGB1 functions as a regulator of the balance between autophagy and apoptosis. | |||
| Drug Sensitivity Data Categorized by Their Corresponding Mechanisms | ||||
|
|
||||
| Disease Class: Non-small cell lung cancer [ICD-11: 2C25.Y] | [1] | |||
| Sensitive Disease | Non-small cell lung cancer [ICD-11: 2C25.Y] | |||
| Sensitive Drug | Cisplatin | |||
| Molecule Alteration | Expression | Down-regulation |
||
| Differential expression of the molecule in resistant disease | ||||
| Classification of Disease | Lung cancer [ICD-11: 2C25] | |||
| The Specified Disease | Lung cancer | |||
| The Studied Tissue | Lung tissue | |||
| The Expression Level of Disease Section Compare with the Healthy Individual Tissue | p-value: 2.63E-14 Fold-change: -2.66E-02 Z-score: -7.97E+00 |
|||
| Experimental Note | Revealed Based on the Cell Line Data | |||
| Cell Pathway Regulation | PI3K/AKT/mTOR signaling pathway | Activation | hsa04151 | |
| In Vitro Model | A549 cells | Lung | Homo sapiens (Human) | CVCL_0023 |
| 16HBE cells | Lung | Homo sapiens (Human) | CVCL_0112 | |
| In Vivo Model | Nude mouse xenograft model | Mus musculus | ||
| Experiment for Molecule Alteration |
Western blot analysis; Luciferase reporter assay | |||
| Experiment for Drug Resistance |
Caspase-3 and TUNEL staining assay; MTT assay | |||
| Mechanism Description | miR142-3p regulates starvation-induced autophagy of NSCLC cells by directly downregulating HMGB1 and subsequently activating the PI3k/Akt/mTOR pathway. miR142-3p overexpression inhibited anticancer drug-induced autophagy and increased chemo-sensitivity of NSCLC in vitro and in vivo. | |||
| Disease Class: Cervical cancer [ICD-11: 2C77.0] | [4] | |||
| Sensitive Disease | Cervical cancer [ICD-11: 2C77.0] | |||
| Sensitive Drug | Cisplatin | |||
| Molecule Alteration | Expression | Down-regulation |
||
| Experimental Note | Revealed Based on the Cell Line Data | |||
| Cell Pathway Regulation | Cell apoptosis | Activation | hsa04210 | |
| Cell colony | Inhibition | hsa05200 | ||
| Cell invasion | Inhibition | hsa05200 | ||
| Cell viability | Inhibition | hsa05200 | ||
| In Vitro Model | Hela cells | Cervix uteri | Homo sapiens (Human) | CVCL_0030 |
| Siha cells | Cervix uteri | Homo sapiens (Human) | CVCL_0032 | |
| C33A cells | Uterus | Homo sapiens (Human) | CVCL_1094 | |
| MS751 cells | Cervical | Homo sapiens (Human) | CVCL_4996 | |
| Experiment for Molecule Alteration |
Western blot analysis | |||
| Experiment for Drug Resistance |
CCK8 assay; Flow cytometry assay; Transwell assay | |||
| Mechanism Description | miR-1284 enhances sensitivity of cervical cancer cells to cisplatin via downregulating HMGB1. | |||
| Drug Sensitivity Data Categorized by Their Corresponding Mechanisms | ||||
|
|
||||
| Disease Class: Acute myeloid leukemia [ICD-11: 2A60.0] | [3] | |||
| Sensitive Disease | Acute myeloid leukemia [ICD-11: 2A60.0] | |||
| Sensitive Drug | Cytarabine | |||
| Molecule Alteration | Expression | Down-regulation |
||
| Differential expression of the molecule in resistant disease | ||||
| Classification of Disease | Acute myeloid leukemia [ICD-11: 2A60] | |||
| The Specified Disease | Acute myelocytic leukemia | |||
| The Studied Tissue | Bone marrow | |||
| The Expression Level of Disease Section Compare with the Healthy Individual Tissue | p-value: 3.67E-02 Fold-change: -9.69E-03 Z-score: -2.10E+00 |
|||
| Experimental Note | Revealed Based on the Cell Line Data | |||
| Cell Pathway Regulation | Cell apoptosis | Activation | hsa04210 | |
| Cell migration | Inhibition | hsa04670 | ||
| In Vitro Model | HL60 cells | Peripheral blood | Homo sapiens (Human) | CVCL_0002 |
| K562 cells | Blood | Homo sapiens (Human) | CVCL_0004 | |
| Experiment for Molecule Alteration |
Western blot analysis | |||
| Experiment for Drug Resistance |
CCK8 assay | |||
| Mechanism Description | The ectopic expression of miR-181b in k562/A02 and HL-60/ADM cells robustly suppressed endogenous HMGB1 and Mcl-1 expression both at mRNA and protein levels. Conversely, knockdown of miR-181b by miR-181b inhibitor markedly increased the expression of both HMGB1 and Mcl-1. Restoration of miR-181b increased the drug sensitivity of AML MDR cells by targeting HMGB1 and Mcl-1. | |||
Disease- and Tissue-specific Abundances of This Molecule
ICD Disease Classification 02

| Differential expression of molecule in resistant diseases | ||
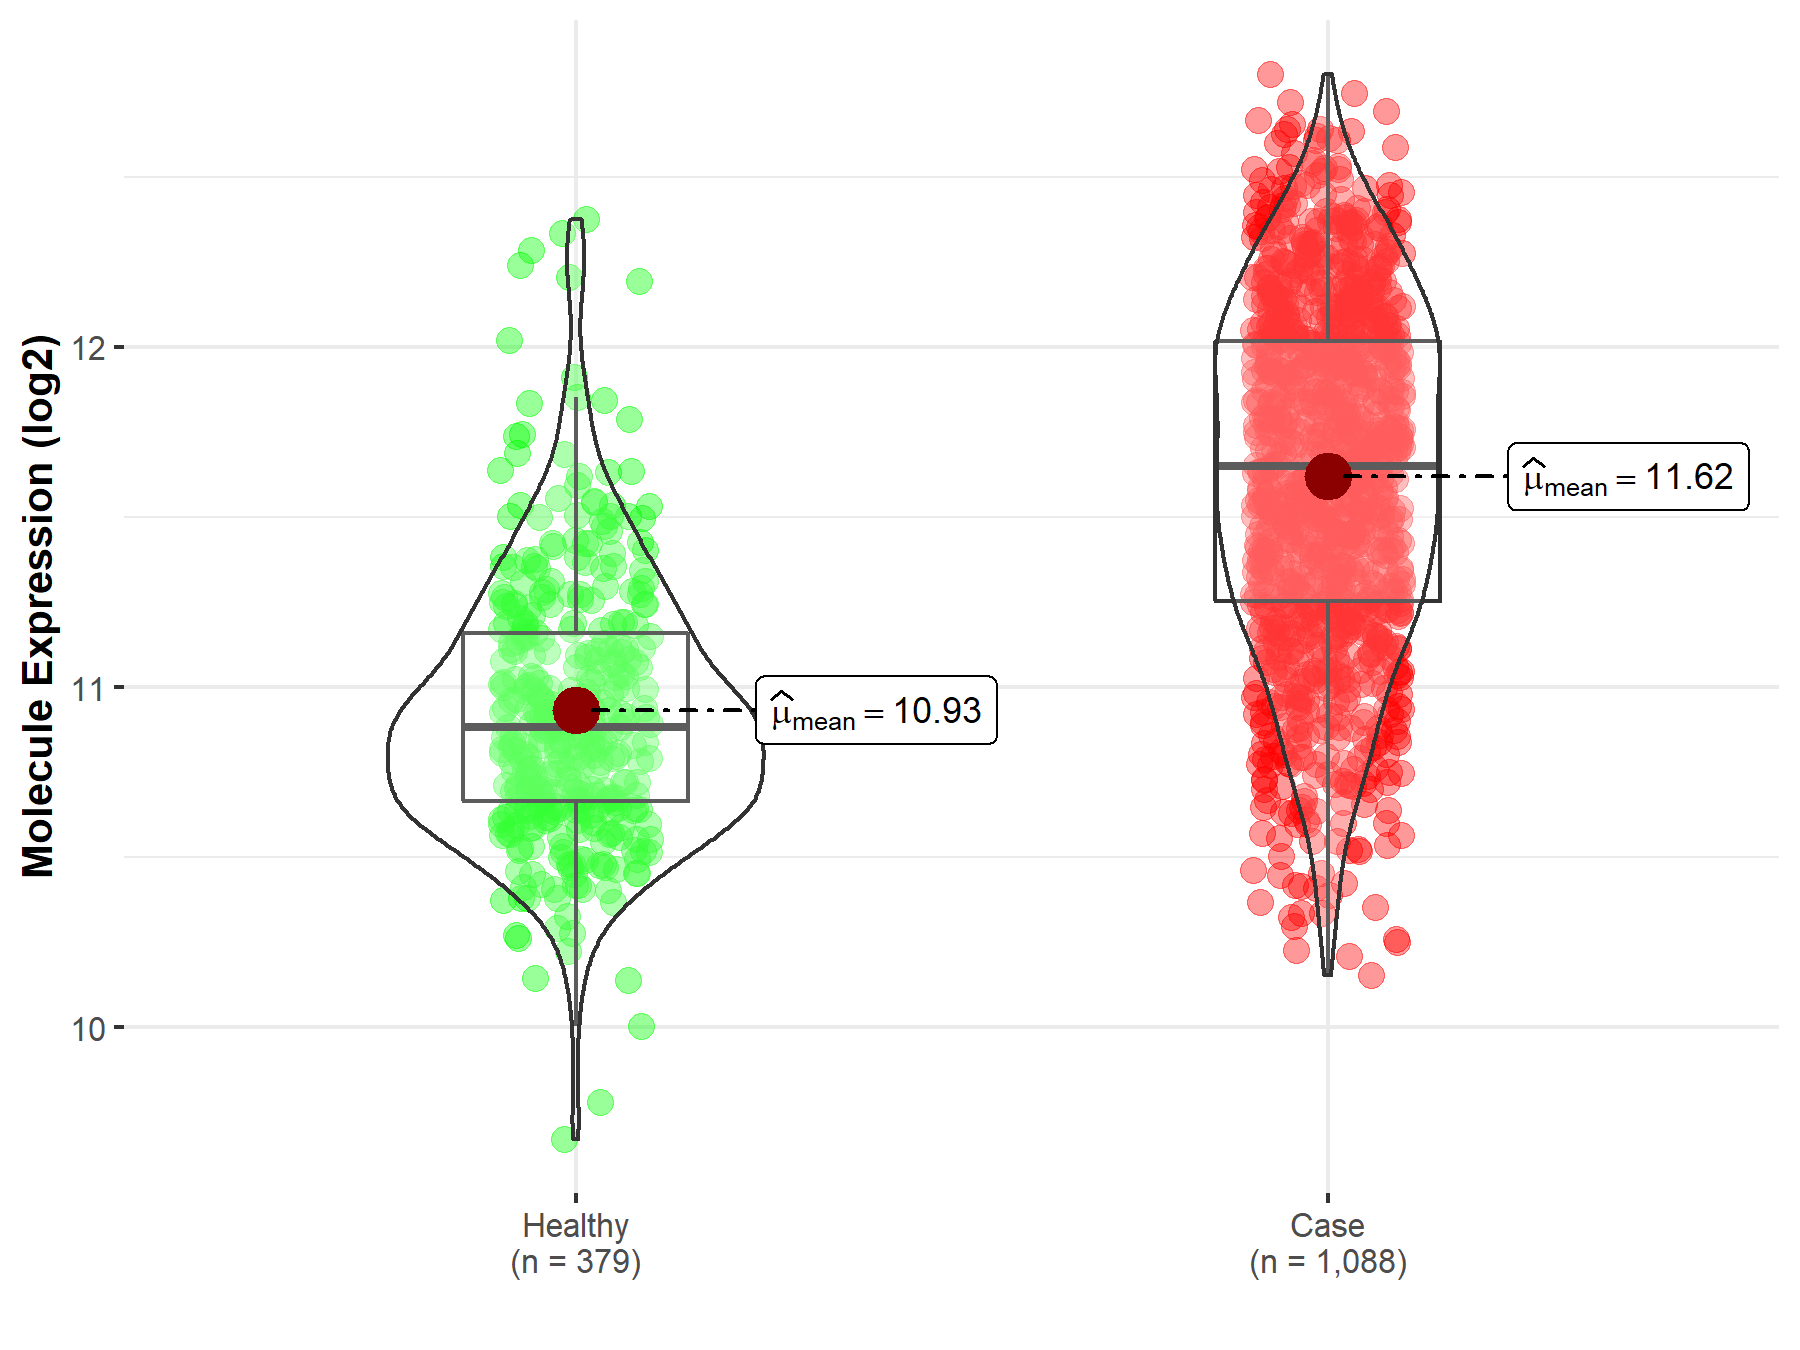
| The Studied Tissue | Nervous tissue | |
| The Specified Disease | Brain cancer | |
| The Expression Level of Disease Section Compare with the Healthy Individual Tissue | p-value: 9.33E-116; Fold-change: 7.67E-01; Z-score: 1.95E+00 | |
|
Molecule expression in the diseased tissue of patients
Molecule expression in the normal tissue of healthy individuals
|
||
| Disease-specific Molecule Abundances |
|
Click to View the Clearer Original Diagram |
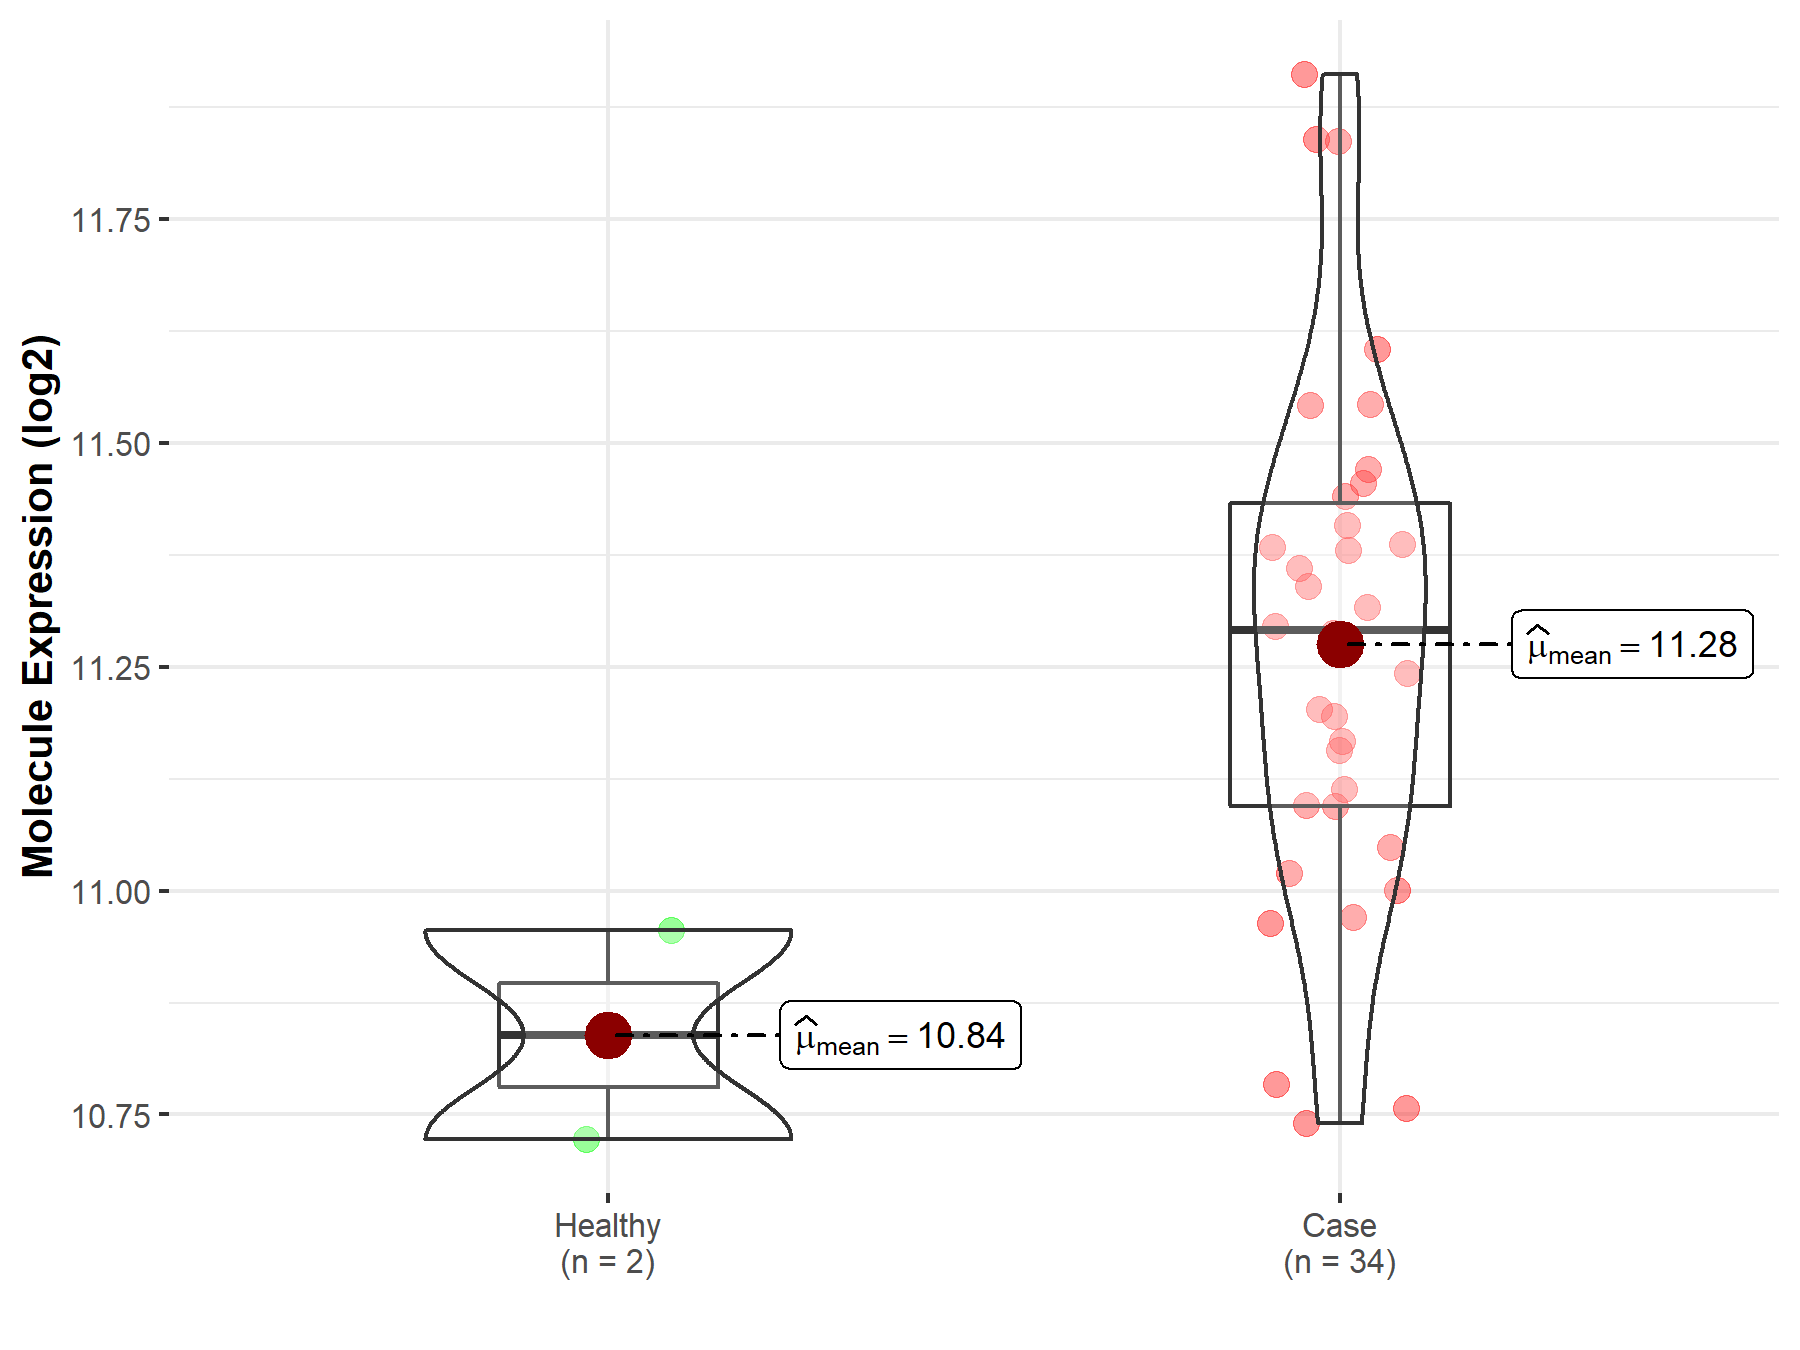
| The Studied Tissue | Brainstem tissue | |
| The Specified Disease | Glioma | |
| The Expression Level of Disease Section Compare with the Healthy Individual Tissue | p-value: 1.22E-01; Fold-change: 4.53E-01; Z-score: 2.74E+00 | |
|
Molecule expression in the diseased tissue of patients
Molecule expression in the normal tissue of healthy individuals
|
||
| Disease-specific Molecule Abundances |
|
Click to View the Clearer Original Diagram |
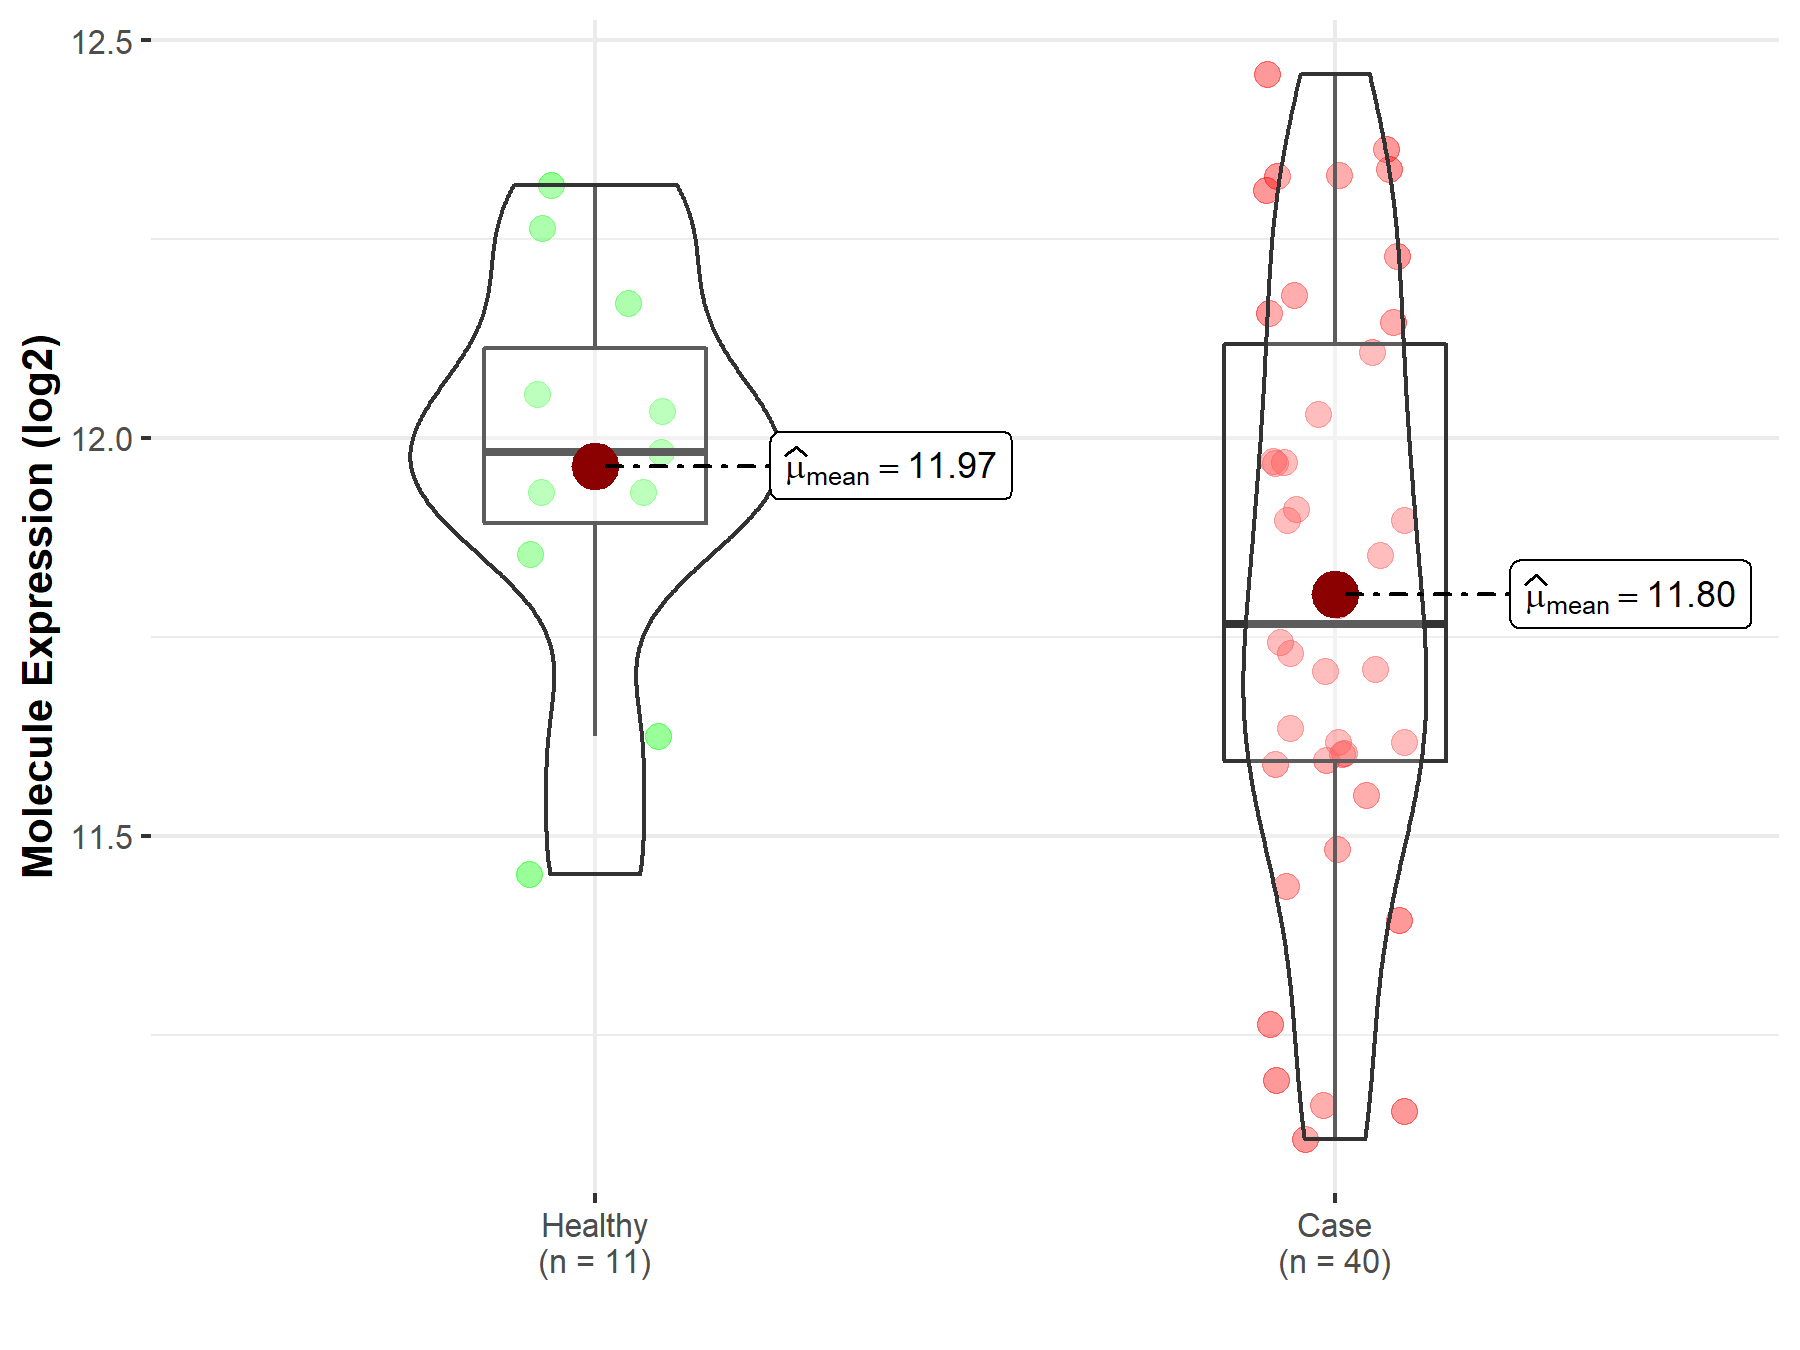
| The Studied Tissue | White matter | |
| The Specified Disease | Glioma | |
| The Expression Level of Disease Section Compare with the Healthy Individual Tissue | p-value: 1.10E-01; Fold-change: -2.16E-01; Z-score: -8.40E-01 | |
|
Molecule expression in the diseased tissue of patients
Molecule expression in the normal tissue of healthy individuals
|
||
| Disease-specific Molecule Abundances |
|
Click to View the Clearer Original Diagram |
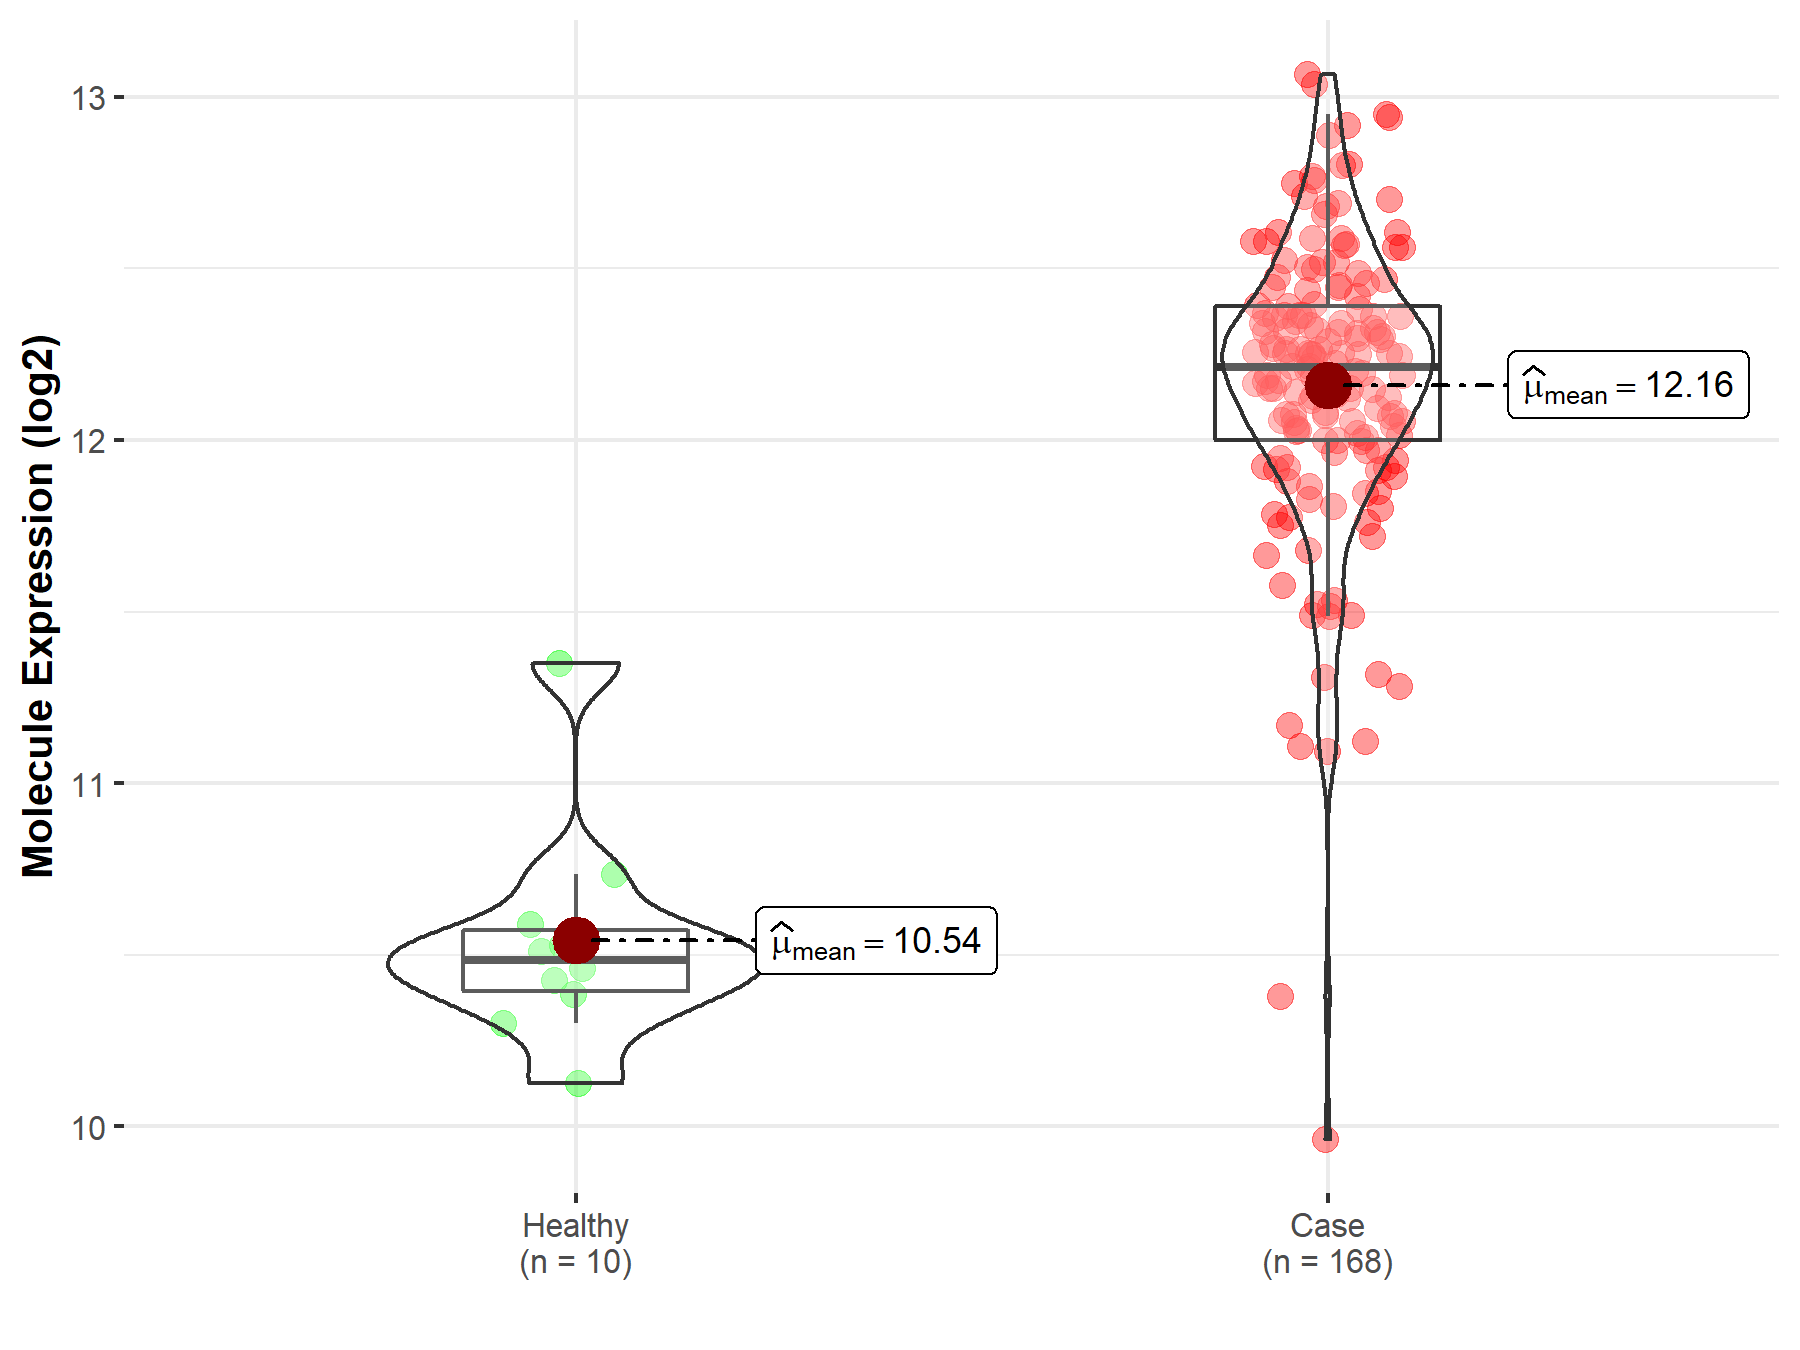
| The Studied Tissue | Brainstem tissue | |
| The Specified Disease | Neuroectodermal tumor | |
| The Expression Level of Disease Section Compare with the Healthy Individual Tissue | p-value: 1.27E-08; Fold-change: 1.73E+00; Z-score: 5.26E+00 | |
|
Molecule expression in the diseased tissue of patients
Molecule expression in the normal tissue of healthy individuals
|
||
| Disease-specific Molecule Abundances |
|
Click to View the Clearer Original Diagram |
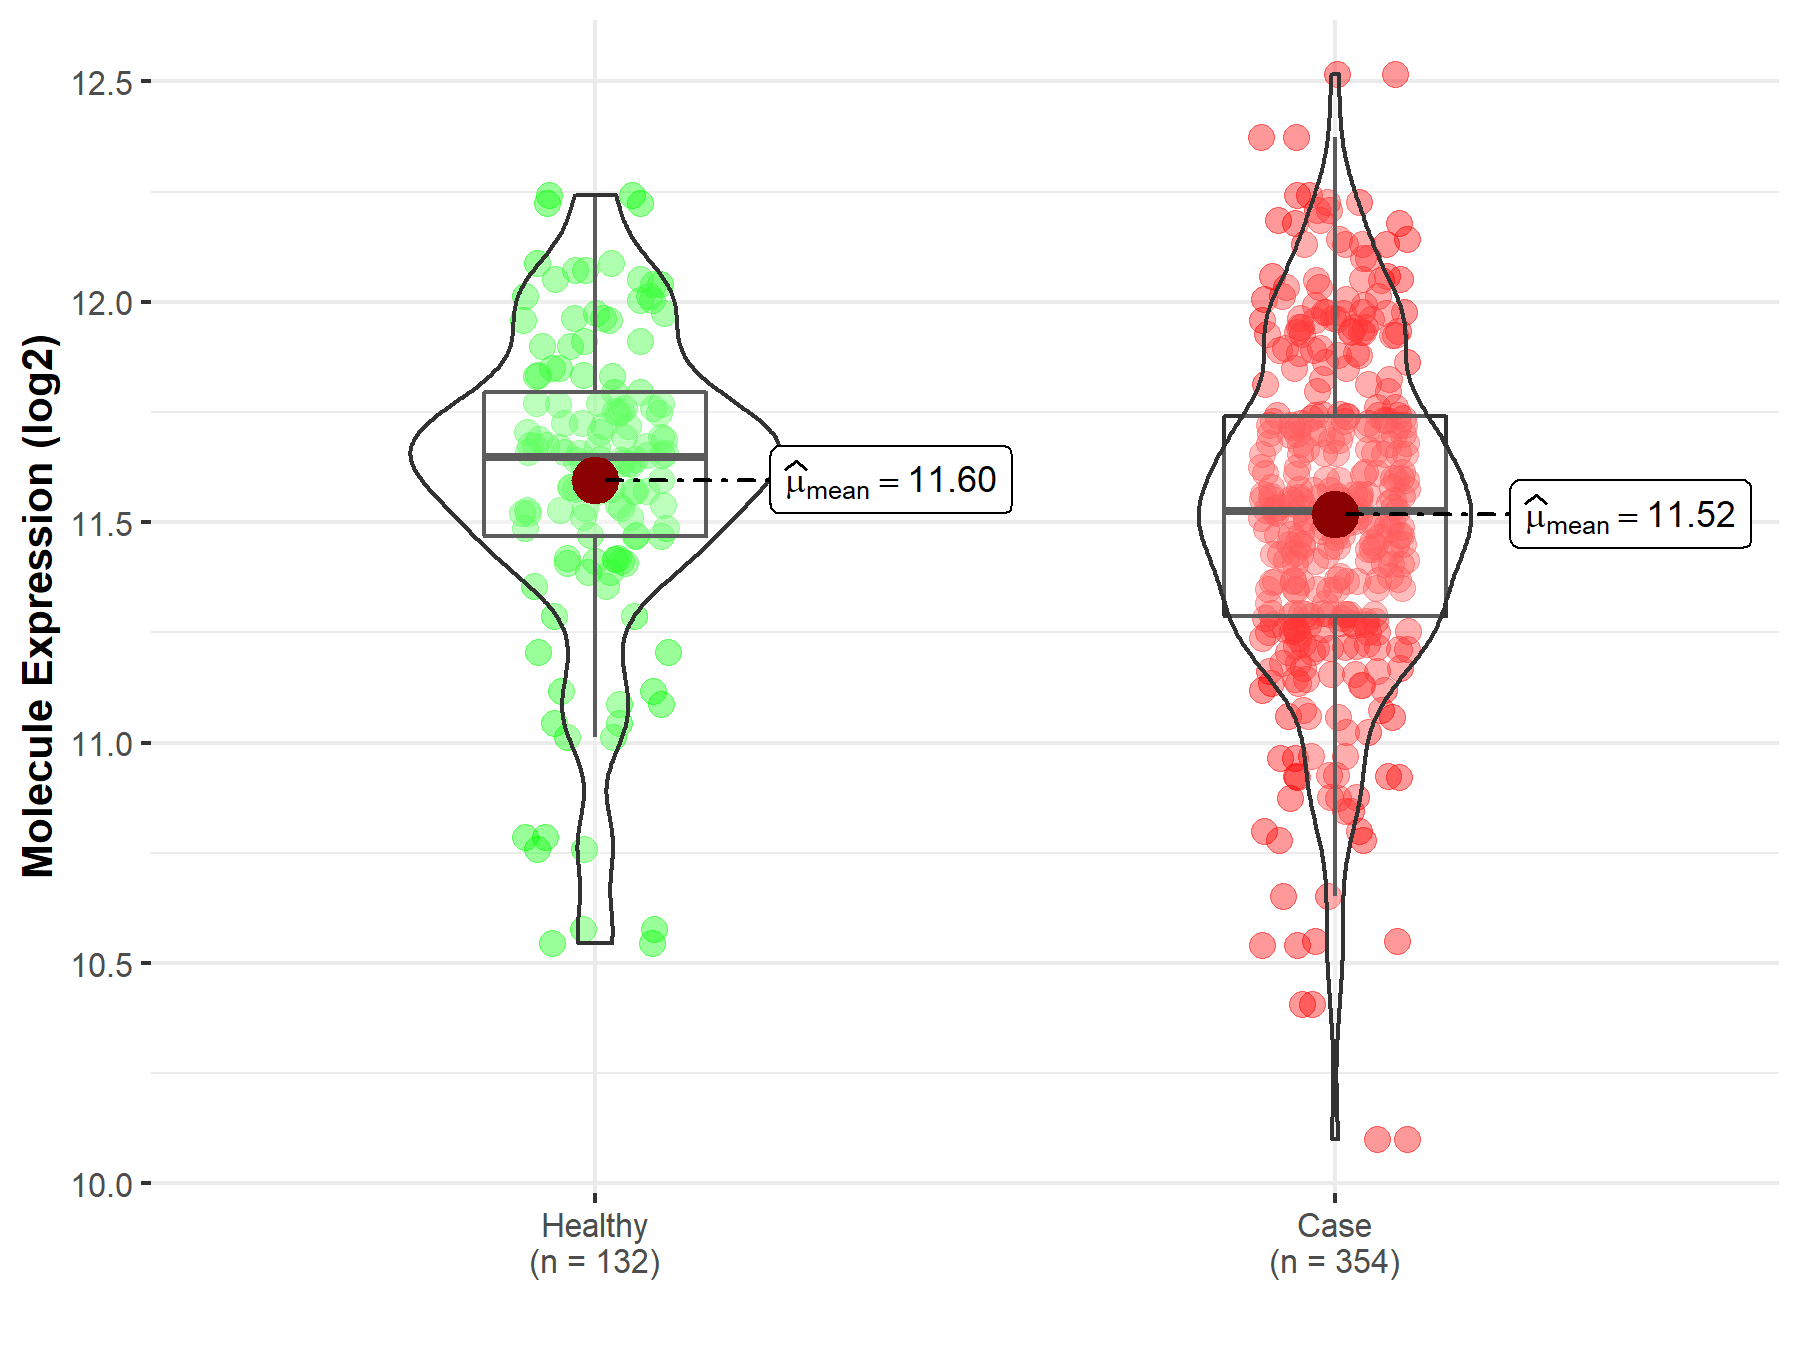
| Differential expression of molecule in resistant diseases | ||
| The Studied Tissue | Bone marrow | |
| The Specified Disease | Acute myeloid leukemia | |
| The Expression Level of Disease Section Compare with the Healthy Individual Tissue | p-value: 3.67E-02; Fold-change: -1.23E-01; Z-score: -3.46E-01 | |
|
Molecule expression in the diseased tissue of patients
Molecule expression in the normal tissue of healthy individuals
|
||
| Disease-specific Molecule Abundances |
|
Click to View the Clearer Original Diagram |
| Differential expression of molecule in resistant diseases | ||
| The Studied Tissue | Lung | |
| The Specified Disease | Lung cancer | |
| The Expression Level of Disease Section Compare with the Healthy Individual Tissue | p-value: 2.63E-14; Fold-change: -2.45E-01; Z-score: -8.07E-01 | |
| The Expression Level of Disease Section Compare with the Adjacent Tissue | p-value: 1.03E-01; Fold-change: -4.35E-02; Z-score: -1.36E-01 | |
|
Molecule expression in the normal tissue adjacent to the diseased tissue of patients
Molecule expression in the diseased tissue of patients
Molecule expression in the normal tissue of healthy individuals
|
||
| Disease-specific Molecule Abundances |

|
Click to View the Clearer Original Diagram |
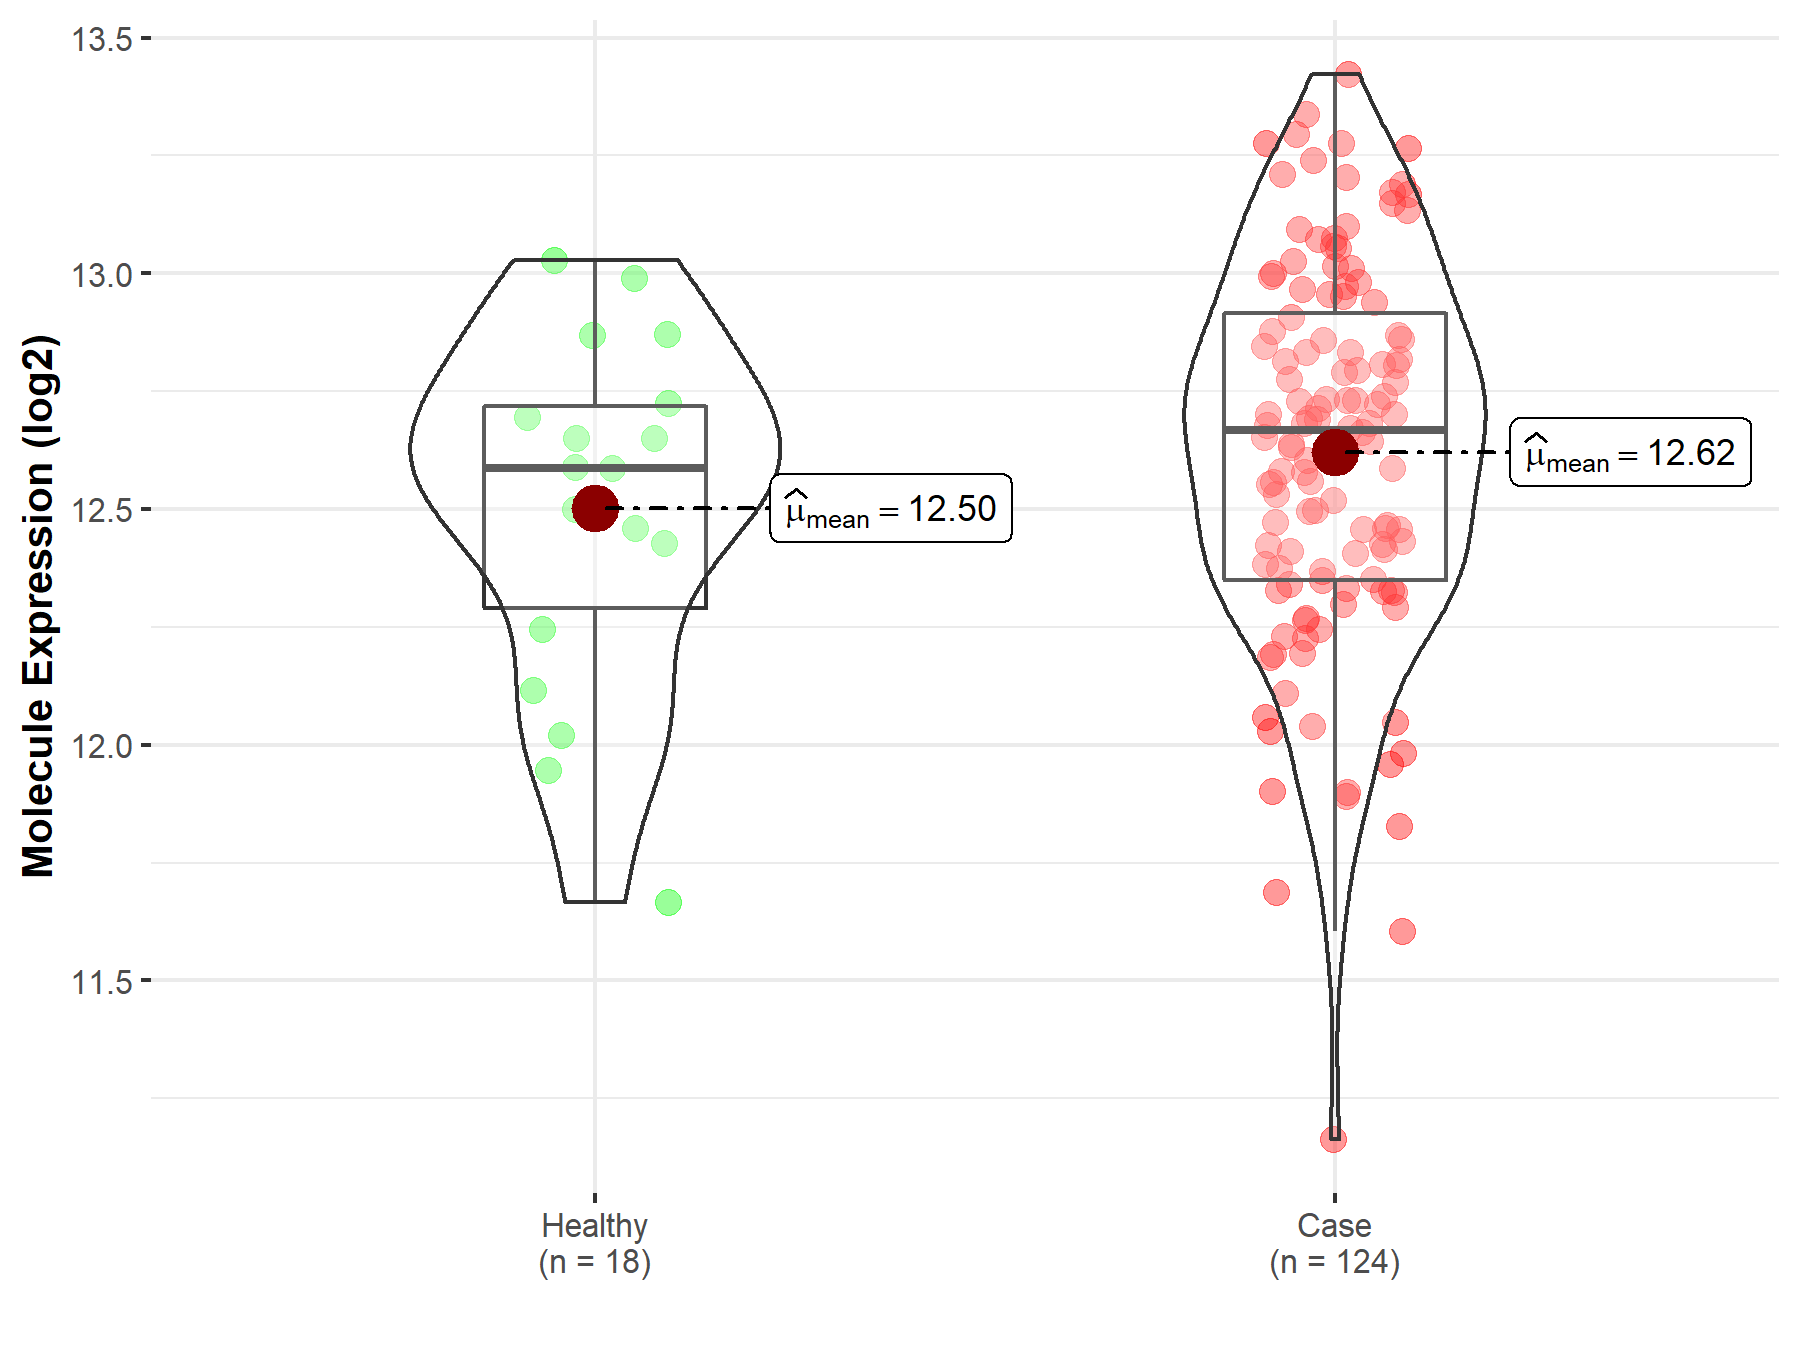
| Differential expression of molecule in resistant diseases | ||
| The Studied Tissue | Cervix uteri | |
| The Specified Disease | Cervical cancer | |
| The Expression Level of Disease Section Compare with the Healthy Individual Tissue | p-value: 2.27E-01; Fold-change: 7.96E-02; Z-score: 2.12E-01 | |
|
Molecule expression in the diseased tissue of patients
Molecule expression in the normal tissue of healthy individuals
|
||
| Disease-specific Molecule Abundances |
|
Click to View the Clearer Original Diagram |
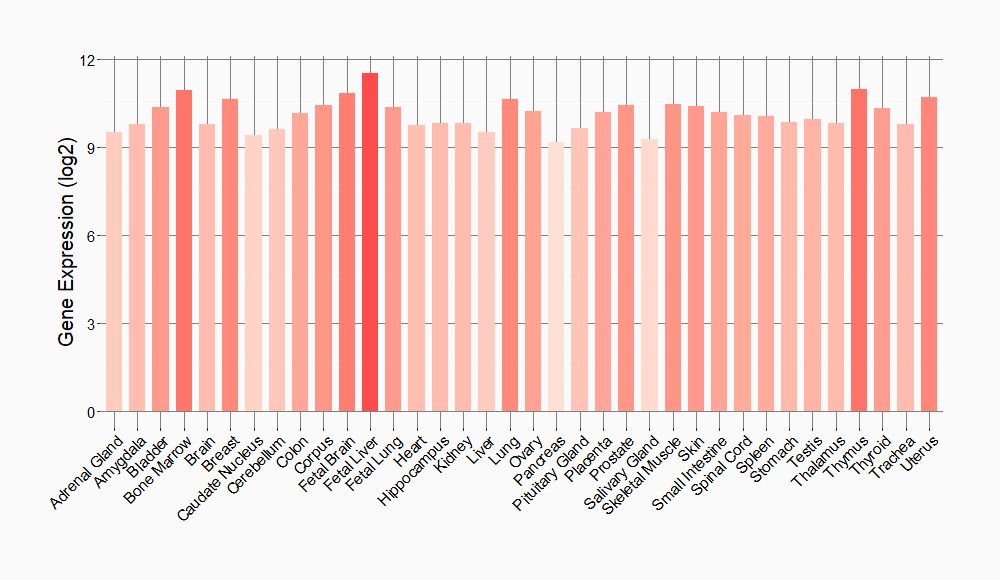
Tissue-specific Molecule Abundances in Healthy Individuals

|
||
References
If you find any error in data or bug in web service, please kindly report it to Dr. Sun and Dr. Yu.
