Molecule Information
General Information of the Molecule (ID: Mol00077)
| Name |
Glycogen synthase kinase-3 beta (GSK3B)
,Homo sapiens
|
||||
|---|---|---|---|---|---|
| Synonyms |
GSK-3 beta; Serine/threonine-protein kinase GSK3B
Click to Show/Hide
|
||||
| Molecule Type |
Protein
|
||||
| Gene Name |
GSK3B
|
||||
| Gene ID | |||||
| Location |
chr3:119821321-120094994[-]
|
||||
| Sequence |
MSGRPRTTSFAESCKPVQQPSAFGSMKVSRDKDGSKVTTVVATPGQGPDRPQEVSYTDTK
VIGNGSFGVVYQAKLCDSGELVAIKKVLQDKRFKNRELQIMRKLDHCNIVRLRYFFYSSG EKKDEVYLNLVLDYVPETVYRVARHYSRAKQTLPVIYVKLYMYQLFRSLAYIHSFGICHR DIKPQNLLLDPDTAVLKLCDFGSAKQLVRGEPNVSYICSRYYRAPELIFGATDYTSSIDV WSAGCVLAELLLGQPIFPGDSGVDQLVEIIKVLGTPTREQIREMNPNYTEFKFPQIKAHP WTKVFRPRTPPEAIALCSRLLEYTPTARLTPLEACAHSFFDELRDPNVKLPNGRDTPALF NFTTQELSSNPPLATILIPPHARIQAAASTPTNATAASDANTGDRGQTNNAASASASNST Click to Show/Hide
|
||||
| 3D-structure |
|
||||
| Function |
Constitutively active protein kinase that acts as a negative regulator in the hormonal control of glucose homeostasis, Wnt signaling and regulation of transcription factors and microtubules, by phosphorylating and inactivating glycogen synthase (GYS1 or GYS2), EIF2B, CTNNB1/beta-catenin, APC, AXIN1, DPYSL2/CRMP2, JUN, NFATC1/NFATC, MAPT/TAU and MACF1. Requires primed phosphorylation of the majority of its substrates. In skeletal muscle, contributes to insulin regulation of glycogen synthesis by phosphorylating and inhibiting GYS1 activity and hence glycogen synthesis. May also mediate the development of insulin resistance by regulating activation of transcription factors. Regulates protein synthesis by controlling the activity of initiation factor 2B (EIF2BE/EIF2B5) in the same manner as glycogen synthase. In Wnt signaling, GSK3B forms a multimeric complex with APC, AXIN1 and CTNNB1/beta-catenin and phosphorylates the N-terminus of CTNNB1 leading to its degradation mediated by ubiquitin/proteasomes. Phosphorylates JUN at sites proximal to its DNA-binding domain, thereby reducing its affinity for DNA. Phosphorylates NFATC1/NFATC on conserved serine residues promoting NFATC1/NFATC nuclear export, shutting off NFATC1/NFATC gene regulation, and thereby opposing the action of calcineurin. Phosphorylates MAPT/TAU on 'Thr-548', decreasing significantly MAPT/TAU ability to bind and stabilize microtubules. MAPT/TAU is the principal component of neurofibrillary tangles in Alzheimer disease. Plays an important role in ERBB2-dependent stabilization of microtubules at the cell cortex. Phosphorylates MACF1, inhibiting its binding to microtubules which is critical for its role in bulge stem cell migration and skin wound repair. Probably regulates NF-kappa-B (NFKB1) at the transcriptional level and is required for the NF-kappa-B-mediated anti-apoptotic response to TNF-alpha (TNF/TNFA). Negatively regulates replication in pancreatic beta-cells, resulting in apoptosis, loss of beta-cells and diabetes. Through phosphorylation of the anti-apoptotic protein MCL1, may control cell apoptosis in response to growth factors deprivation. Phosphorylates MUC1 in breast cancer cells, decreasing the interaction of MUC1 with CTNNB1/beta-catenin. Is necessary for the establishment of neuronal polarity and axon outgrowth. Phosphorylates MARK2, leading to inhibit its activity. Phosphorylates SIK1 at 'Thr-182', leading to sustain its activity. Phosphorylates ZC3HAV1 which enhances its antiviral activity. Phosphorylates SNAI1, leading to its BTRC-triggered ubiquitination and proteasomal degradation. Phosphorylates SFPQ at 'Thr-687' upon T-cell activation. Phosphorylates NR1D1 st 'Ser-55' and 'Ser-59' and stabilizes it by protecting it from proteasomal degradation. Regulates the circadian clock via phosphorylation of the major clock components including ARNTL/BMAL1, CLOCK and PER2. Phosphorylates CLOCK AT 'Ser-427' and targets it for proteasomal degradation. Phosphorylates ARNTL/BMAL1 at 'Ser-17' and 'Ser-21' and primes it for ubiquitination and proteasomal degradation. Phosphorylates OGT at 'Ser-3' or 'Ser-4' which positively regulates its activity. Phosphorylates MYCN in neuroblastoma cells which may promote its degradation. Regulates the circadian rhythmicity of hippocampal long-term potentiation and ARNTL/BMLA1 and PER2 expression. Acts as a regulator of autophagy by mediating phosphorylation of KAT5/TIP60 under starvation conditions, leading to activate KAT5/TIP60 acetyltransferase activity and promote acetylation of key autophagy regulators, such as ULK1 and RUBCNL/Pacer. Negatively regulates extrinsic apoptotic signaling pathway via death domain receptors. Promotes the formation of an anti-apoptotic complex, made of DDX3X, BRIC2 and GSK3B, at death receptors, including TNFRSF10B. The anti-apoptotic function is most effective with weak apoptotic signals and can be overcome by stronger stimulation. Phosphorylates E2F1, promoting the interaction between E2F1 and USP11, leading to stabilize E2F1 and promote its activity.
Click to Show/Hide
|
||||
| Uniprot ID | |||||
| Ensembl ID | |||||
| HGNC ID | |||||
| Click to Show/Hide the Complete Species Lineage | |||||
Type(s) of Resistant Mechanism of This Molecule
Drug Resistance Data Categorized by Drug
Approved Drug(s)
5 drug(s) in total
| Drug Resistance Data Categorized by Their Corresponding Mechanisms | ||||
|
|
||||
| Disease Class: HPV-related cervical cancer [ICD-11: 2E67.2] | [1] | |||
| Resistant Disease | HPV-related cervical cancer [ICD-11: 2E67.2] | |||
| Resistant Drug | Cisplatin | |||
| Molecule Alteration | Expression | Up-regulation |
||
| Differential expression of the molecule in resistant disease | ||||
| Classification of Disease | HPV-related cervical cancer [ICD-11: 2E67] | |||
| The Specified Disease | HPV-related cervical cancer | |||
| The Studied Tissue | Cervix | |||
| The Expression Level of Disease Section Compare with the Healthy Individual Tissue | p-value: 9.87E-03 Fold-change: 1.33E-01 Z-score: 2.81E+00 |
|||
| Experimental Note | Identified from the Human Clinical Data | |||
| Cell Pathway Regulation | ERK signaling pathway | Activation | hsa04210 | |
| GSK3 pathway | Activation | hsa04340 | ||
| Cell invasion | Activation | hsa05200 | ||
| In Vitro Model | Hela cells | Cervix uteri | Homo sapiens (Human) | CVCL_0030 |
| Siha cells | Cervix uteri | Homo sapiens (Human) | CVCL_0032 | |
| C33A cells | Uterus | Homo sapiens (Human) | CVCL_1094 | |
| Experiment for Molecule Alteration |
Western blot analysis | |||
| Experiment for Drug Resistance |
MTT assay | |||
| Mechanism Description | We examined the significance of HPV and HPV-driven pathways in CSCC pathogenesis and specially focused on its contribution to the neoplasm's severity, including its induction of rapid proliferation, survival, invasiveness, and chemoresistance. We hypothesized that the expression of the viral oncoproteins E6/E7, in addition to activation of the glycogen synthase kinase-3 (GSK3)alpha/beta signaling pathways, could influence the biology of CSCC. We used liquid N2 frozen/fresh human CSCC tissues and adjacent normal (AN) and chemoradiation-resistant CSCC to determine HPV16/18 E6 and HPV16 E7 and the expression and activation of the pERK1/2 and GSK3 pathways. Cisplatin-resistant cervical cancer cell lines, both HPV positive (HeLa and SiHa) and HPV negative (C33A), were created and used as a model to investigate cervical cancer invasion and resistance. We provide evidence that there is an increased dependence of GSK3beta signaling in HPV16/18-induced CSCC that promotes chemoresistance and invasiveness. | |||
| Disease Class: Colorectal cancer [ICD-11: 2B91.1] | [6] | |||
| Resistant Disease | Colorectal cancer [ICD-11: 2B91.1] | |||
| Resistant Drug | Cisplatin | |||
| Molecule Alteration | Expression | Down-regulation |
||
| Experimental Note | Identified from the Human Clinical Data | |||
| Cell Pathway Regulation | Wnt/Beta-catenin signaling pathway | Regulation | N.A. | |
| In Vitro Model | ALDHA1+ CCSCs cells | Colon | Homo sapiens (Human) | N.A. |
| ALDHA1 cells | Colon | Homo sapiens (Human) | N.A. | |
| In Vivo Model | Nude mouse xenograft model | Mus musculus | ||
| Experiment for Molecule Alteration |
Western blot analysis; Immunohistochemistry; Luciferase reporter assay | |||
| Experiment for Drug Resistance |
Flow cytometry assay; MTT assay | |||
| Mechanism Description | Upregulation of miR199a/b contributes to cisplatin resistance via Wnt/beta-catenin-ABCG2 signaling pathway in ALDHA1+ colorectal cancer stem cells. Gsk3beta was the direct target of miR199a/b, miR199a/b regulates Wnt/beta-catenin pathway by targeting Gsk3beta in ALDHA1+ CCSCs. | |||
|
|
||||
| Disease Class: Tongue squamous cell carcinoma [ICD-11: 2B62.1] | [5] | |||
| Resistant Disease | Tongue squamous cell carcinoma [ICD-11: 2B62.1] | |||
| Resistant Drug | Cisplatin | |||
| Molecule Alteration | Phosphorylation | Up-regulation |
||
| Experimental Note | Revealed Based on the Cell Line Data | |||
| Cell Pathway Regulation | Cell apoptosis | Inhibition | hsa04210 | |
| Cell metastasis | Activation | hsa05205 | ||
| Cell proliferation | Activation | hsa05200 | ||
| Cell viability | Activation | hsa05200 | ||
| Tumorigenesis | Activation | hsa05206 | ||
| Wnt/Beta-catenin signaling pathway | Activation | hsa04310 | ||
| In Vitro Model | CAL27 cells | Oral | Homo sapiens (Human) | CVCL_1107 |
| SCC9 cells | Tongue | Homo sapiens (Human) | CVCL_1685 | |
| In Vivo Model | Nude mouse xenograft model | Mus musculus | ||
| Experiment for Molecule Alteration |
Western blot analysis | |||
| Experiment for Drug Resistance |
MTS assay | |||
| Mechanism Description | Overexpression of CILA1 also increased the phosphorylation of GSk-3beta, resulting resistance in tongue cancar. | |||
| Drug Sensitivity Data Categorized by Their Corresponding Mechanisms | ||||
|
|
||||
| Disease Class: Glioblastoma [ICD-11: 2A00.02] | [2] | |||
| Sensitive Disease | Glioblastoma [ICD-11: 2A00.02] | |||
| Sensitive Drug | Cisplatin | |||
| Molecule Alteration | Expression | Up-regulation |
||
| Differential expression of the molecule in resistant disease | ||||
| Classification of Disease | Brain cancer [ICD-11: 2A00] | |||
| The Specified Disease | Neuroectodermal tumor | |||
| The Studied Tissue | Brainstem tissue | |||
| The Expression Level of Disease Section Compare with the Healthy Individual Tissue | p-value: 6.00E-01 Fold-change: 1.69E-02 Z-score: 5.41E-01 |
|||
| Experimental Note | Revealed Based on the Cell Line Data | |||
| Cell Pathway Regulation | Cell autophagy | Inhibition | hsa04140 | |
| Cell invasion | Inhibition | hsa05200 | ||
| Cell migration | Inhibition | hsa04670 | ||
| Cell proliferation | Inhibition | hsa05200 | ||
| miR26a/GSk3Beta/Mcl1 signaling pathway | Regulation | N.A. | ||
| In Vitro Model | U251-MG cells | Brain | Homo sapiens (Human) | CVCL_0021 |
| U87MG cells | Brain | Homo sapiens (Human) | CVCL_GP63 | |
| Experiment for Molecule Alteration |
Dual luciferase reporter assay; Western blot analysis | |||
| Experiment for Drug Resistance |
MTT assay; Annexin V-FITC staining assay; Flow cytometry assay | |||
| Mechanism Description | Long non-coding RNA AC023115.3 suppresses chemoresistance of glioblastoma by reducing autophagy. AC023115.3 acts as a competing endogenous RNA for miR26a and attenuates the inhibitory effect of miR26a on GSk3beta, leading to an increase in GSk3beta and a decrease in autophagy. | |||
| Drug Resistance Data Categorized by Their Corresponding Mechanisms | ||||
|
|
||||
| Disease Class: Breast cancer [ICD-11: 2C60.3] | [3] | |||
| Resistant Disease | Breast cancer [ICD-11: 2C60.3] | |||
| Resistant Drug | Docetaxel | |||
| Molecule Alteration | Expression | Down-regulation |
||
| Differential expression of the molecule in resistant disease | ||||
| Classification of Disease | Breast cancer [ICD-11: 2C60] | |||
| The Specified Disease | Breast cancer | |||
| The Studied Tissue | Breast tissue | |||
| The Expression Level of Disease Section Compare with the Healthy Individual Tissue | p-value: 1.20E-07 Fold-change: -3.67E-02 Z-score: -5.39E+00 |
|||
| Experimental Note | Revealed Based on the Cell Line Data | |||
| Cell Pathway Regulation | Cell apoptosis | Inhibition | hsa04210 | |
| GSK-3beta/Beta-catenin signaling pathway | Regulation | N.A. | ||
| In Vitro Model | MCF-7 cells | Breast | Homo sapiens (Human) | CVCL_0031 |
| MDA-MB-231 cells | Breast | Homo sapiens (Human) | CVCL_0062 | |
| Experiment for Molecule Alteration |
Western blot analysis; Flow cytometric assay | |||
| Experiment for Drug Resistance |
MTT assay | |||
| Mechanism Description | miR-3646 contributes to drug resistance of breast cancer cells to Doc at least in part through activation of GSk-3beta/beta-catenin pathway by suppressing expression of GSk-3beta. | |||
| Drug Sensitivity Data Categorized by Their Corresponding Mechanisms | ||||
|
|
||||
| Disease Class: Glioblastoma [ICD-11: 2A00.02] | [4] | |||
| Sensitive Disease | Glioblastoma [ICD-11: 2A00.02] | |||
| Sensitive Drug | Temozolomide | |||
| Molecule Alteration | Expression | Down-regulation |
||
| Differential expression of the molecule in resistant disease | ||||
| Classification of Disease | Brain cancer [ICD-11: 2A00] | |||
| The Specified Disease | Brain cancer | |||
| The Studied Tissue | Nervous tissue | |||
| The Expression Level of Disease Section Compare with the Healthy Individual Tissue | p-value: 1.25E-16 Fold-change: -6.07E-02 Z-score: -8.46E+00 |
|||
| Experimental Note | Revealed Based on the Cell Line Data | |||
| In Vitro Model | A172 cells | Brain | Homo sapiens (Human) | CVCL_0131 |
| T98G cells | Brain | Homo sapiens (Human) | CVCL_0556 | |
| U251-MG cells | Brain | Homo sapiens (Human) | CVCL_0021 | |
| In Vivo Model | Nude mouse xenograft model | Mus musculus | ||
| Experiment for Molecule Alteration |
Western blot analysis | |||
| Experiment for Drug Resistance |
CCK8 assay; Colony formation assay | |||
| Mechanism Description | microRNA-101 reverses temozolomide resistance by inhibition of GSk3beta in glioblastoma. | |||
| Drug Resistance Data Categorized by Their Corresponding Mechanisms | ||||
|
|
||||
| Disease Class: Colorectal cancer [ICD-11: 2B91.1] | [7] | |||
| Resistant Disease | Colorectal cancer [ICD-11: 2B91.1] | |||
| Resistant Drug | Doxorubicin | |||
| Molecule Alteration | Expression | Down-regulation |
||
| Experimental Note | Revealed Based on the Cell Line Data | |||
| Cell Pathway Regulation | Wnt/Beta-catenin signaling pathway | Regulation | N.A. | |
| In Vitro Model | SW480 cells | Colon | Homo sapiens (Human) | CVCL_0546 |
| SW480/ADM cells | Colon | Homo sapiens (Human) | CVCL_0546 | |
| Experiment for Molecule Alteration |
Dual luciferase gene reporter assay | |||
| Experiment for Drug Resistance |
CCK8 assay; Flow cytometry assay; EdU staining | |||
| Mechanism Description | miR224 up-regulation is associated with ADM resistance of CRC cells. Suppression of miR224 expression up-regulated GSk-3beta expression, inhibited Wnt/beta-catenin signal pathway activity and Survivin expression, as well as reduced ADM resistance of CRC SW480 cells. | |||
|
|
||||
| Disease Class: Hepatocellular carcinoma [ICD-11: 2C12.2] | [8] | |||
| Resistant Disease | Hepatocellular carcinoma [ICD-11: 2C12.2] | |||
| Resistant Drug | Doxorubicin | |||
| Molecule Alteration | Phosphorylation | Down-regulation |
||
| Experimental Note | Identified from the Human Clinical Data | |||
| Cell Pathway Regulation | Cell apoptosis | Activation | hsa04210 | |
| GSKIP/GSK-3beta signaling pathway | Activation | hsa04550 | ||
| Wnt/Beta-catenin signaling pathway | Activation | hsa04310 | ||
| In Vitro Model | Huh-7 cells | Liver | Homo sapiens (Human) | CVCL_0336 |
| Hep3B cells | Liver | Homo sapiens (Human) | CVCL_0326 | |
| L02 cells | Liver | Homo sapiens (Human) | CVCL_6926 | |
| In Vivo Model | Nude mouse xenograft model | Mus musculus | ||
| Experiment for Molecule Alteration |
Immunohistochemical staining | |||
| Experiment for Drug Resistance |
MTT assay | |||
| Mechanism Description | HANR bind to GSkIP for regulating the phosphorylation of GSk3beta in HCC, knock-down of HANR markedly retarded cell proliferation, suppressed HCC xenograft/orthotopic tumor growth, induced apoptosis and enhanced chemosensitivity to doxorubicin. GSkIP is the direct target of HANR to influence GSk3beta phosphorylation, HANR is physically associated with GSkIP to regulate the GSkIP/GSk3beta pathway. | |||
| Drug Sensitivity Data Categorized by Their Corresponding Mechanisms | ||||
|
|
||||
| Disease Class: Breast cancer [ICD-11: 2C60.3] | [9] | |||
| Sensitive Disease | Breast cancer [ICD-11: 2C60.3] | |||
| Sensitive Drug | Doxorubicin | |||
| Molecule Alteration | Expression | Up-regulation |
||
| Experimental Note | Revealed Based on the Cell Line Data | |||
| Cell Pathway Regulation | Cell apoptosis | Activation | hsa04210 | |
| PTEN/AKT/GSk3Beta signaling pathway | Activation | hsa05235 | ||
| In Vitro Model | MCF-7 cells | Breast | Homo sapiens (Human) | CVCL_0031 |
| Experiment for Molecule Alteration |
Western blot analysis | |||
| Experiment for Drug Resistance |
MTS assay; Flow cytometry assay | |||
| Mechanism Description | Down-regulation of miR-29a expression in MCF-7/ADR cells increased PTEN expression levels, resulting in decreased phospho-Akt (p-Akt) and phospho-GSk3beta (p-GSk3beta) expression. Conversely, upregulation of miR-29a expression in MCF-7/S cells is associated with decreasing PTEN expression and increasing p-Akt and p-GSk3beta expression. PTEN and GSk3beta are targeted by miR-29a, and miR-29a may contribute to ADR resistance through inhibition of the PTEN/AkT/GSk3beta pathway in breast cancer cells. | |||
| Drug Sensitivity Data Categorized by Their Corresponding Mechanisms | ||||
|
|
||||
| Disease Class: Hepatocellular carcinoma [ICD-11: 2C12.2] | [10] | |||
| Sensitive Disease | Hepatocellular carcinoma [ICD-11: 2C12.2] | |||
| Sensitive Drug | Vinpocetine | |||
| Molecule Alteration | Function | Activation |
||
| Experimental Note | Revealed Based on the Cell Line Data | |||
| Cell Pathway Regulation | PI3K/AKT/GSK-3beta signaling pathway | Activation | hsa04931 | |
| In Vitro Model | Saccharomyces cerevisiae strain | 4932 | ||
| Bacteroides thetaiotaomicron strain | 818 | |||
| Experiment for Molecule Alteration |
Western blot analysis | |||
| Experiment for Drug Resistance |
Sulforhodamine blue (SRB) assay | |||
| Mechanism Description | Enhanced anticancer activity by the combination of vinpocetine and sorafenib via PI3K/AKT/GSK-3beta signaling axis in hepatocellular carcinoma cells. Our study revealed that vinpocetine plus sorafenib could suppress the cytoprotective autophagy induced by vinpocetine and subsequently show synergistically anti-HCC activity via activating GSK-3beta and the combination of vinpocetine and sorafenib might reverse sorafenib resistance via the PI3K/protein kinase B/GSK-3beta signaling axis. | |||
Disease- and Tissue-specific Abundances of This Molecule
ICD Disease Classification 02

| Differential expression of molecule in resistant diseases | ||
| The Studied Tissue | Nervous tissue | |
| The Specified Disease | Brain cancer | |
| The Expression Level of Disease Section Compare with the Healthy Individual Tissue | p-value: 1.25E-16; Fold-change: -3.00E-01; Z-score: -4.89E-01 | |
|
Molecule expression in the diseased tissue of patients
Molecule expression in the normal tissue of healthy individuals
|
||
| Disease-specific Molecule Abundances |
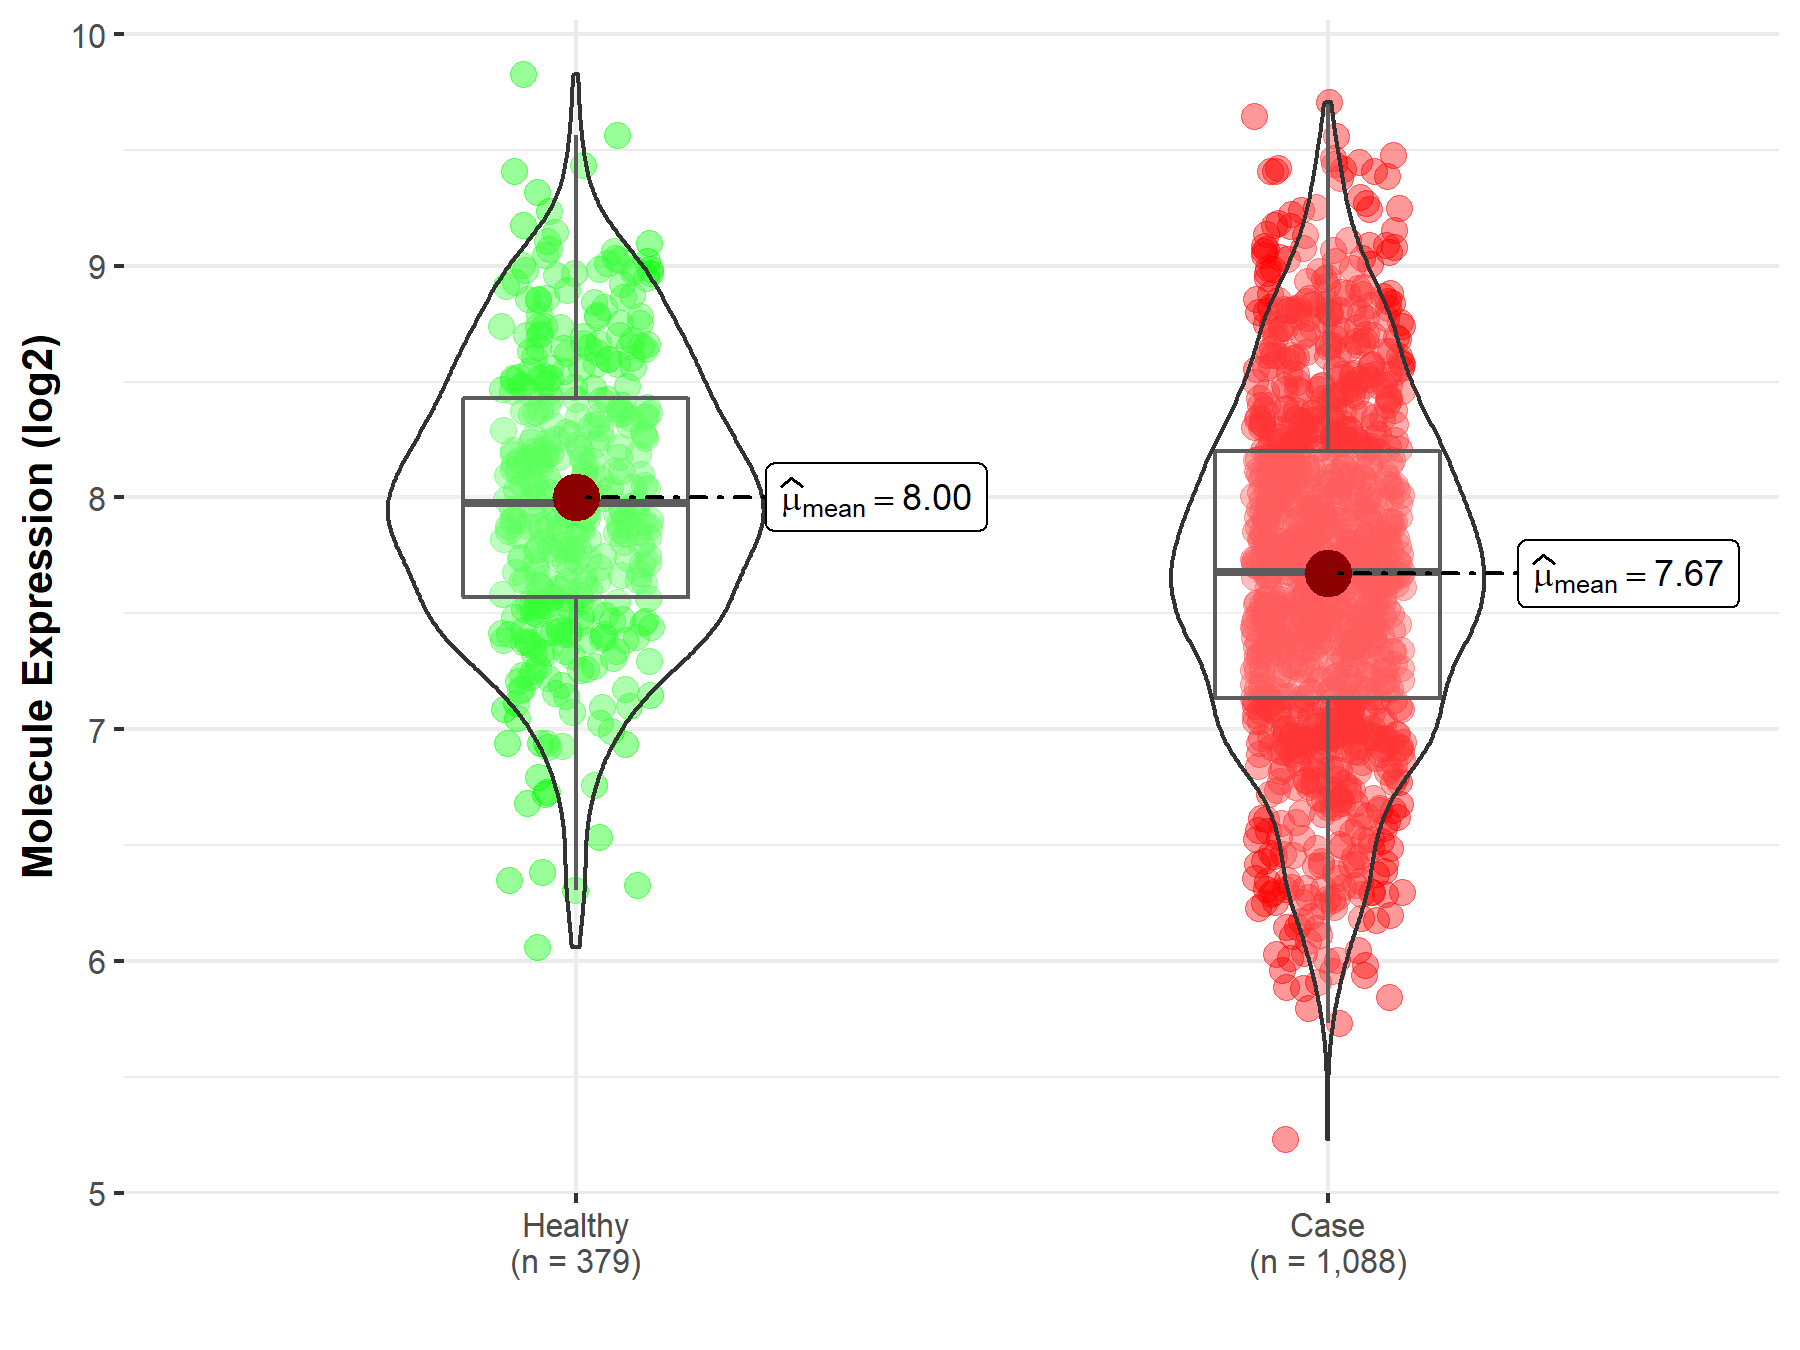
|
Click to View the Clearer Original Diagram |
| The Studied Tissue | Brainstem tissue | |
| The Specified Disease | Glioma | |
| The Expression Level of Disease Section Compare with the Healthy Individual Tissue | p-value: 4.72E-02; Fold-change: -9.01E-02; Z-score: -3.34E+00 | |
|
Molecule expression in the diseased tissue of patients
Molecule expression in the normal tissue of healthy individuals
|
||
| Disease-specific Molecule Abundances |

|
Click to View the Clearer Original Diagram |
| The Studied Tissue | White matter | |
| The Specified Disease | Glioma | |
| The Expression Level of Disease Section Compare with the Healthy Individual Tissue | p-value: 2.21E-05; Fold-change: 8.20E-01; Z-score: 1.65E+00 | |
|
Molecule expression in the diseased tissue of patients
Molecule expression in the normal tissue of healthy individuals
|
||
| Disease-specific Molecule Abundances |
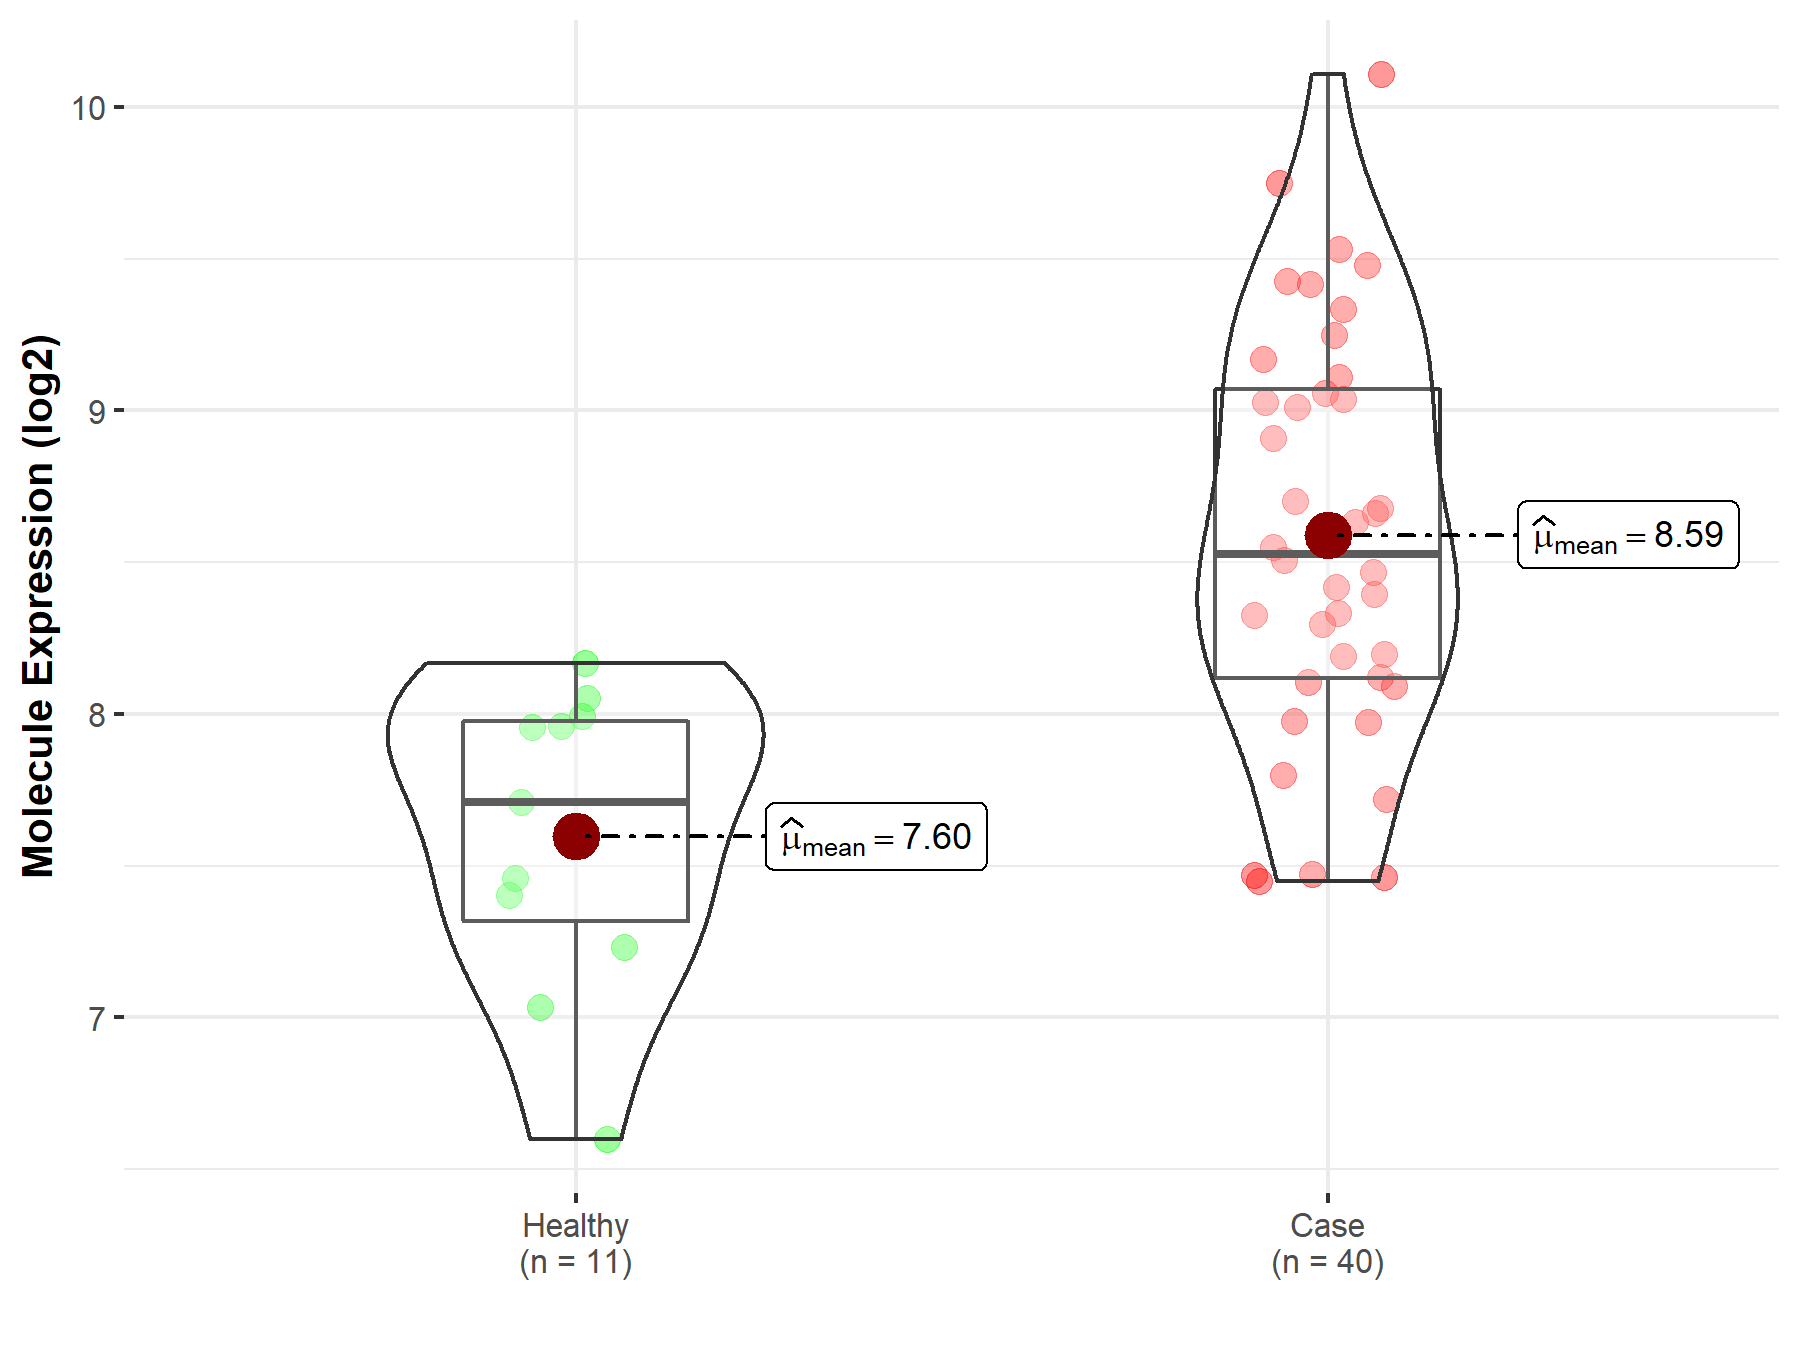
|
Click to View the Clearer Original Diagram |
| The Studied Tissue | Brainstem tissue | |
| The Specified Disease | Neuroectodermal tumor | |
| The Expression Level of Disease Section Compare with the Healthy Individual Tissue | p-value: 6.00E-01; Fold-change: 1.92E-02; Z-score: 4.09E-02 | |
|
Molecule expression in the diseased tissue of patients
Molecule expression in the normal tissue of healthy individuals
|
||
| Disease-specific Molecule Abundances |
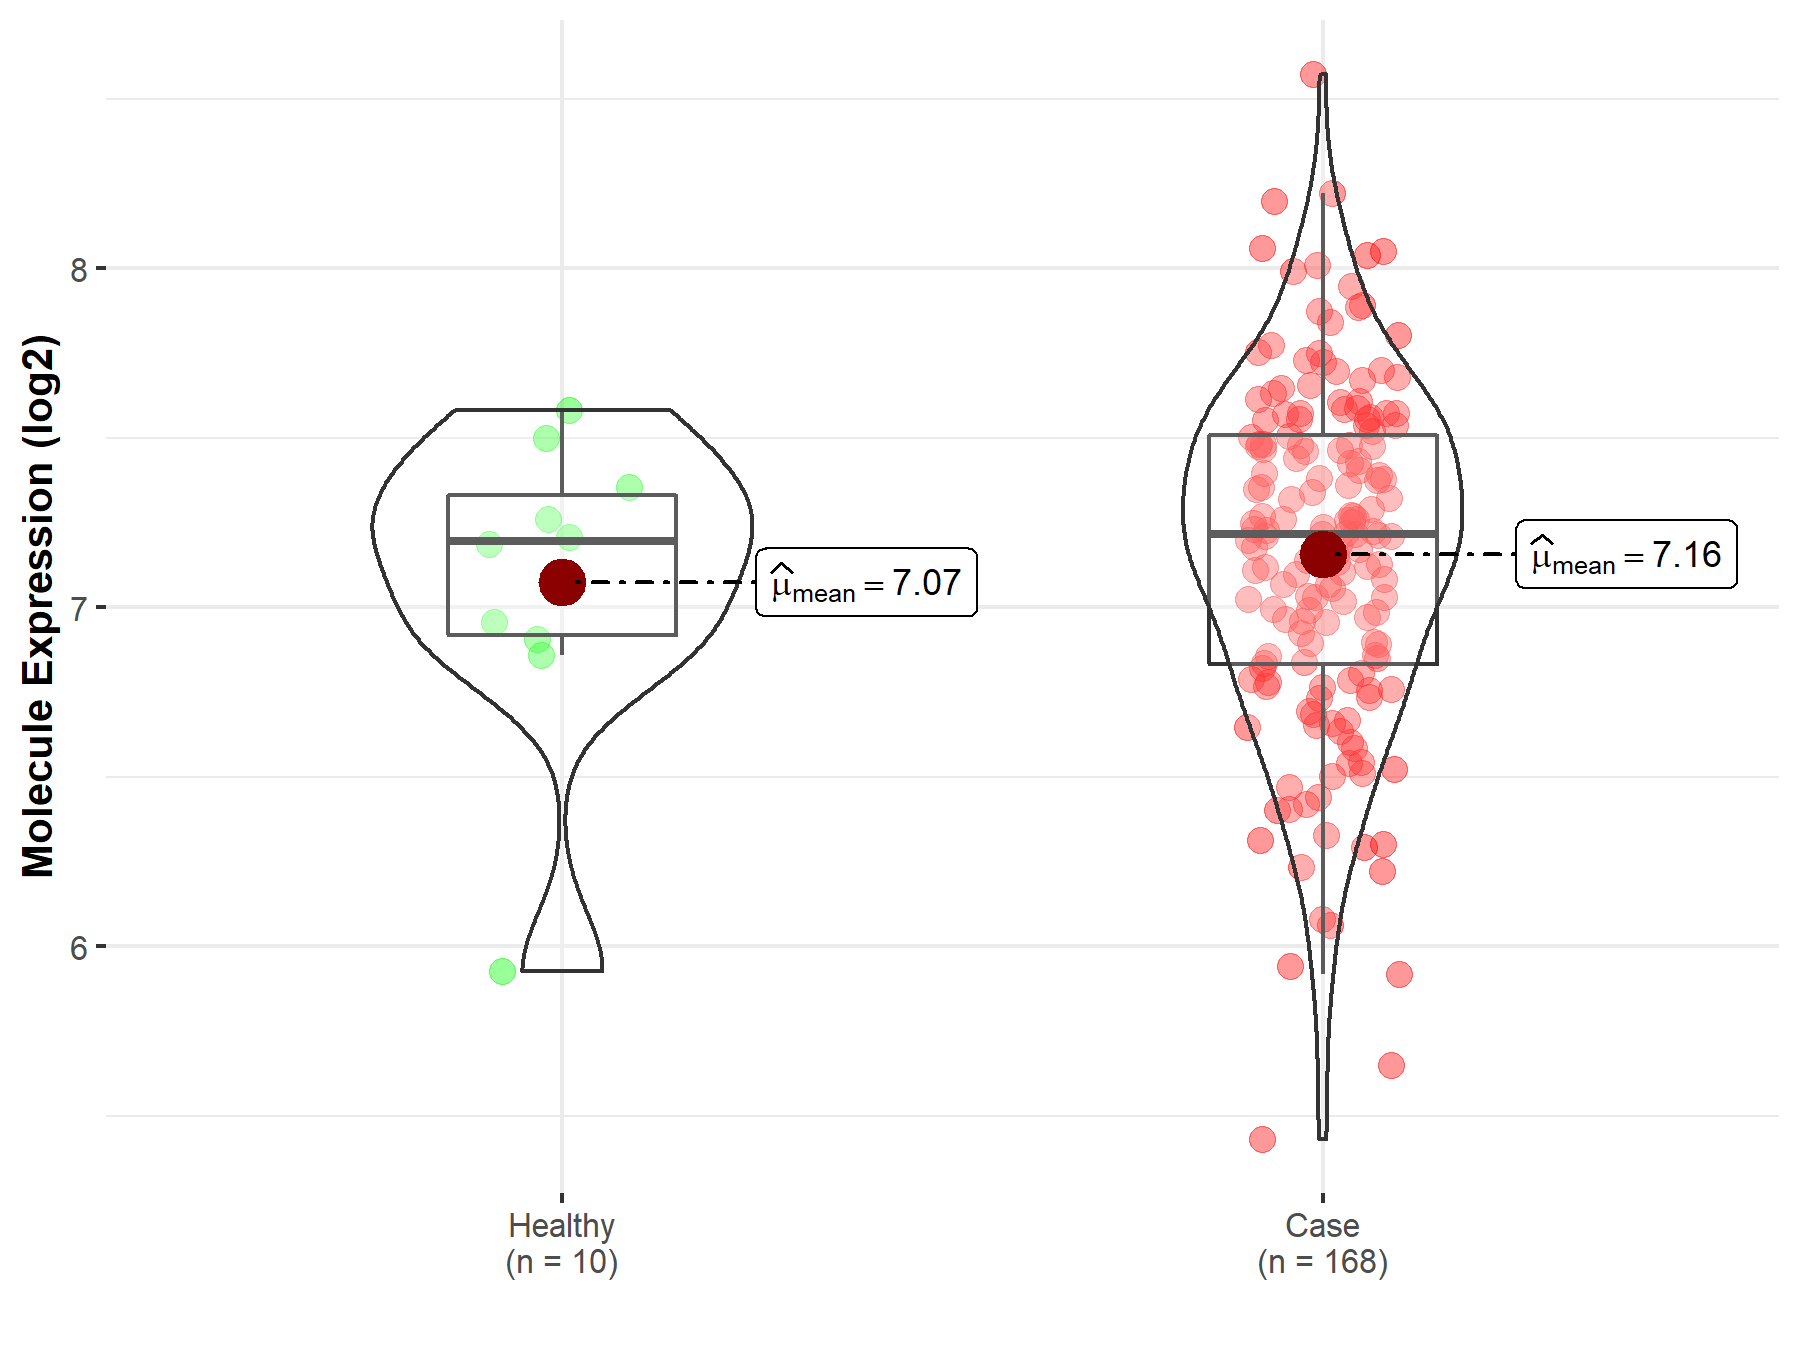
|
Click to View the Clearer Original Diagram |
| Differential expression of molecule in resistant diseases | ||
| The Studied Tissue | Liver | |
| The Specified Disease | Liver cancer | |
| The Expression Level of Disease Section Compare with the Healthy Individual Tissue | p-value: 1.76E-04; Fold-change: 3.16E-01; Z-score: 7.77E-01 | |
| The Expression Level of Disease Section Compare with the Adjacent Tissue | p-value: 9.96E-12; Fold-change: 3.44E-01; Z-score: 6.85E-01 | |
| The Expression Level of Disease Section Compare with the Other Disease Section | p-value: 1.25E-01; Fold-change: 9.98E-02; Z-score: 4.10E-01 | |
|
Molecule expression in the normal tissue adjacent to the diseased tissue of patients
Molecule expression in the diseased tissue of patients
Molecule expression in the normal tissue of healthy individuals
Molecule expression in tissue other than the diseased tissue of patients
|
||
| Disease-specific Molecule Abundances |
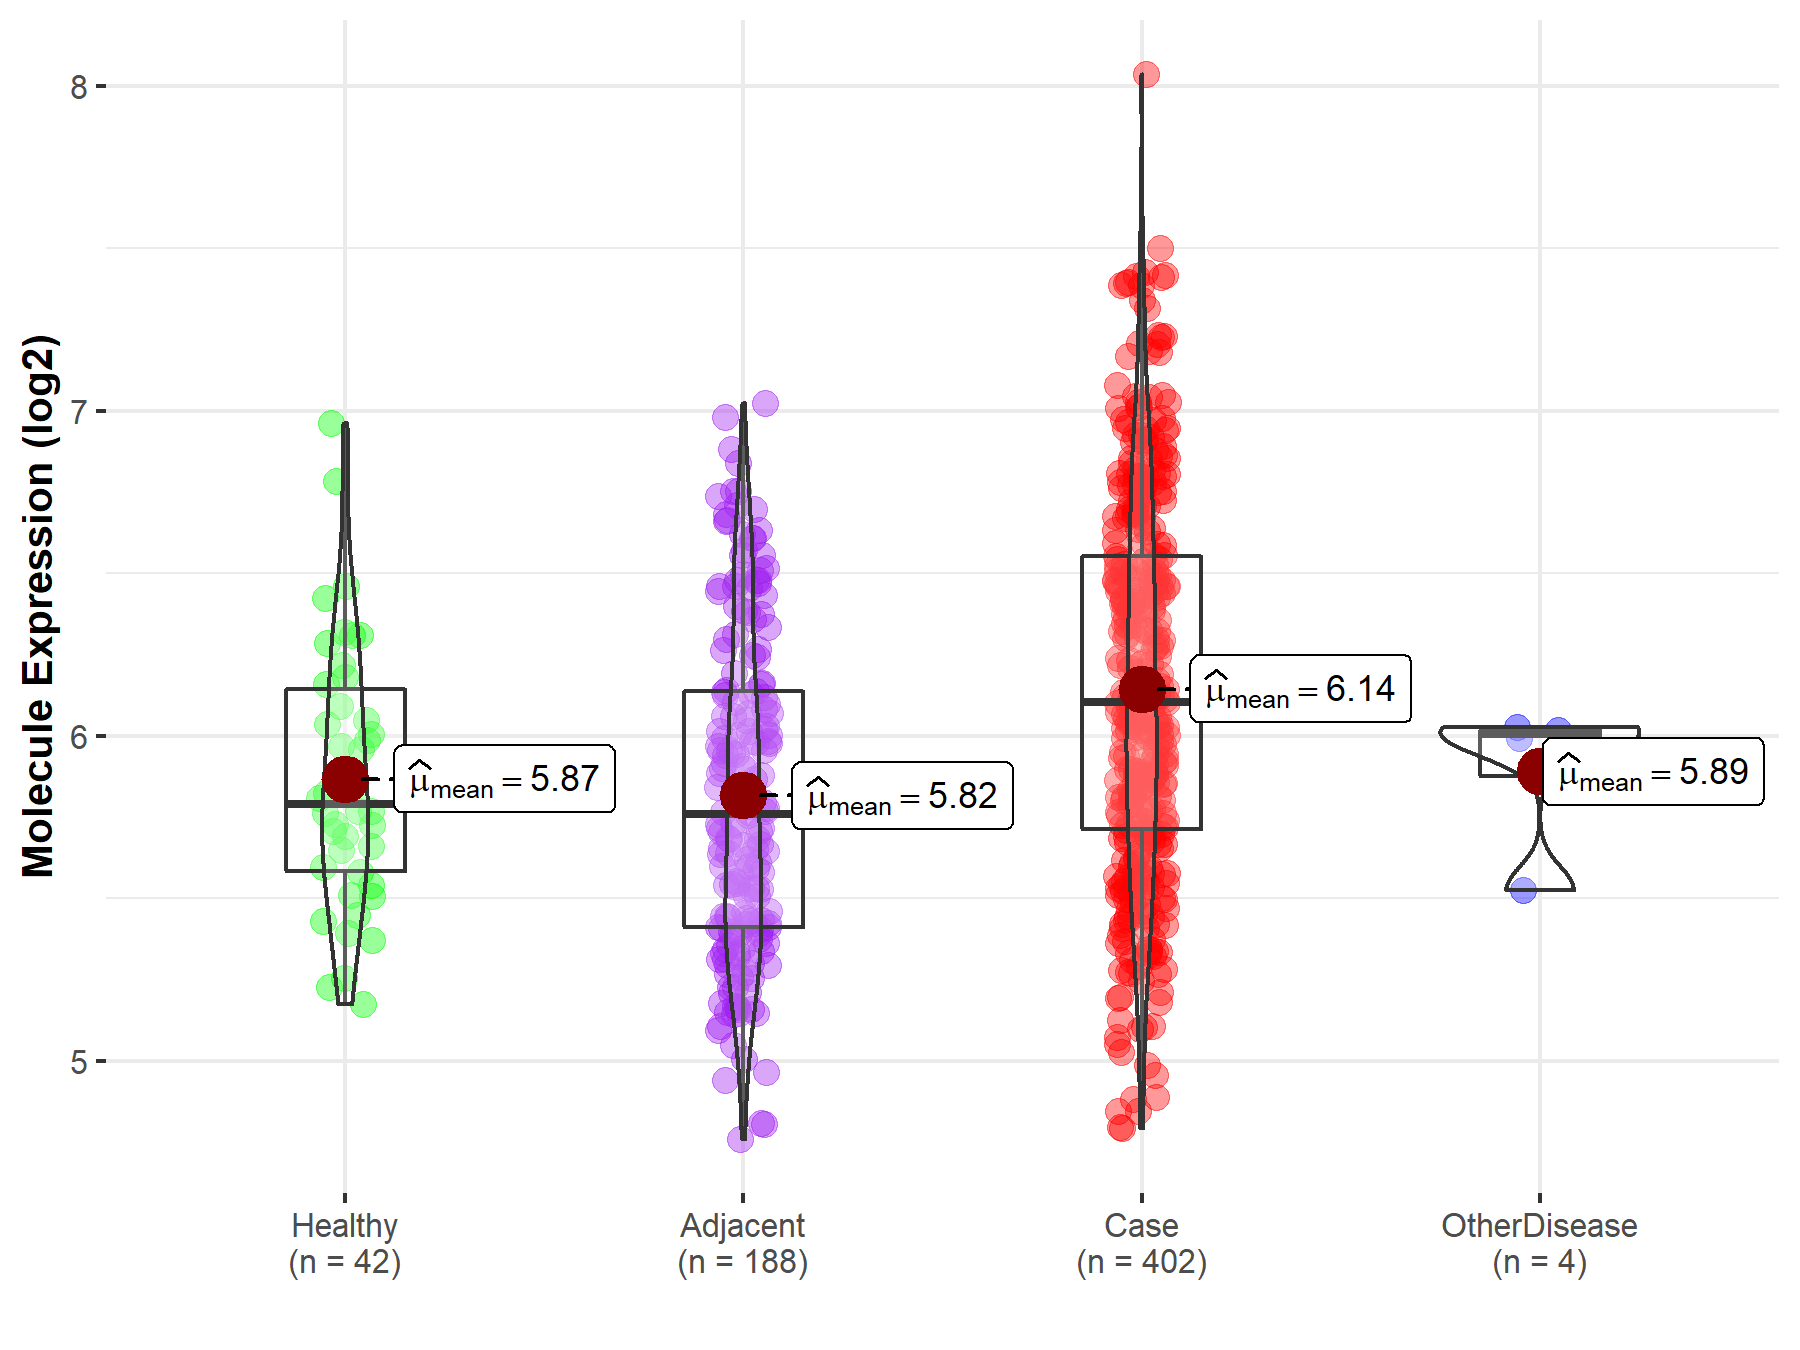
|
Click to View the Clearer Original Diagram |
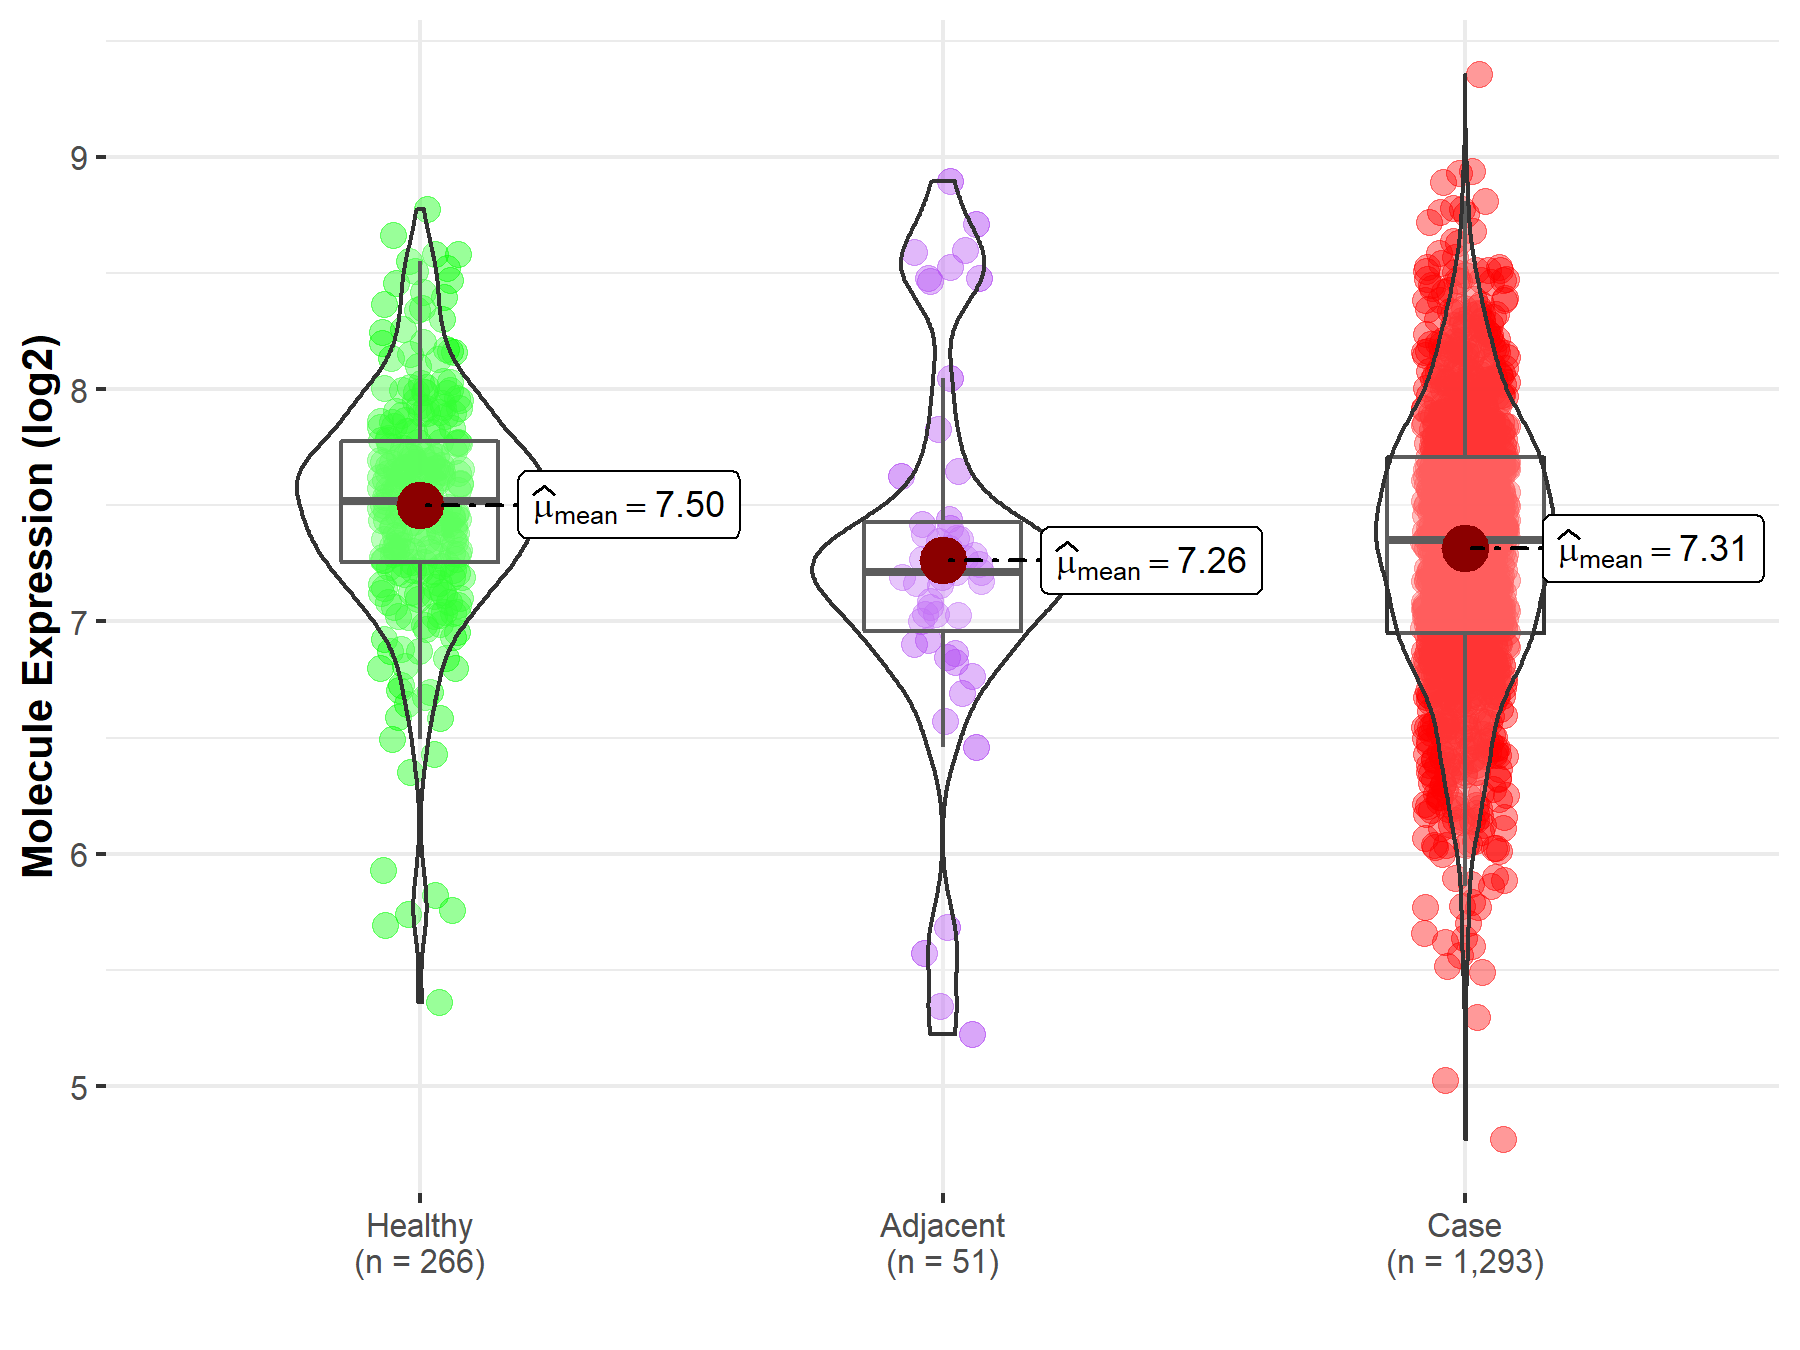
| Differential expression of molecule in resistant diseases | ||
| The Studied Tissue | Breast tissue | |
| The Specified Disease | Breast cancer | |
| The Expression Level of Disease Section Compare with the Healthy Individual Tissue | p-value: 1.20E-07; Fold-change: -1.65E-01; Z-score: -3.27E-01 | |
| The Expression Level of Disease Section Compare with the Adjacent Tissue | p-value: 6.53E-01; Fold-change: 1.38E-01; Z-score: 1.74E-01 | |
|
Molecule expression in the normal tissue adjacent to the diseased tissue of patients
Molecule expression in the diseased tissue of patients
Molecule expression in the normal tissue of healthy individuals
|
||
| Disease-specific Molecule Abundances |
|
Click to View the Clearer Original Diagram |
Tissue-specific Molecule Abundances in Healthy Individuals


|
||
References
If you find any error in data or bug in web service, please kindly report it to Dr. Sun and Dr. Yu.
