Molecule Information
General Information of the Molecule (ID: Mol00062)
| Name |
Hypoxia-inducible factor 2-alpha (EPAS1)
,Homo sapiens
|
||||
|---|---|---|---|---|---|
| Synonyms |
EPAS-1; Basic-helix-loop-helix-PAS protein MOP2; Class E basic helix-loop-helix protein 73; bHLHe73; HIF-1-alpha-like factor; HLF; Hypoxia-inducible factor 2-alpha; HIF-2-alpha; HIF2-alpha; Member of PAS protein 2; PAS domain-containing protein 2; BHLHE73; HIF2A; MOP2; PASD2
Click to Show/Hide
|
||||
| Molecule Type |
Protein
|
||||
| Gene Name |
EPAS1
|
||||
| Gene ID | |||||
| Location |
chr2:46293667-46386697[+]
|
||||
| Sequence |
MTADKEKKRSSSERRKEKSRDAARCRRSKETEVFYELAHELPLPHSVSSHLDKASIMRLA
ISFLRTHKLLSSVCSENESEAEADQQMDNLYLKALEGFIAVVTQDGDMIFLSENISKFMG LTQVELTGHSIFDFTHPCDHEEIRENLSLKNGSGFGKKSKDMSTERDFFMRMKCTVTNRG RTVNLKSATWKVLHCTGQVKVYNNCPPHNSLCGYKEPLLSCLIIMCEPIQHPSHMDIPLD SKTFLSRHSMDMKFTYCDDRITELIGYHPEELLGRSAYEFYHALDSENMTKSHQNLCTKG QVVSGQYRMLAKHGGYVWLETQGTVIYNPRNLQPQCIMCVNYVLSEIEKNDVVFSMDQTE SLFKPHLMAMNSIFDSSGKGAVSEKSNFLFTKLKEEPEELAQLAPTPGDAIISLDFGNQN FEESSAYGKAILPPSQPWATELRSHSTQSEAGSLPAFTVPQAAAPGSTTPSATSSSSSCS TPNSPEDYYTSLDNDLKIEVIEKLFAMDTEAKDQCSTQTDFNELDLETLAPYIPMDGEDF QLSPICPEERLLAENPQSTPQHCFSAMTNIFQPLAPVAPHSPFLLDKFQQQLESKKTEPE HRPMSSIFFDAGSKASLPPCCGQASTPLSSMGGRSNTQWPPDPPLHFGPTKWAVGDQRTE FLGAAPLGPPVSPPHVSTFKTRSAKGFGARGPDVLSPAMVALSNKLKLKRQLEYEEQAFQ DLSGGDPPGGSTSHLMWKRMKNLRGGSCPLMPDKPLSANVPNDKFTQNPMRGLGHPLRHL PLPQPPSAISPGENSKSRFPPQCYATQYQDYSLSSAHKVSGMASRLLGPSFESYLLPELT RYDCEVNVPVLGSSTLLQGGDLLRALDQAT Click to Show/Hide
|
||||
| 3D-structure |
|
||||
| Function |
Transcription factor involved in the induction of oxygen regulated genes. Heterodimerizes with ARNT; heterodimer binds to core DNA sequence 5'-TACGTG-3' within the hypoxia response element (HRE) of target gene promoters (By similarity). Regulates the vascular endothelial growth factor (VEGF) expression and seems to be implicated in the development of blood vessels and the tubular system of lung. May also play a role in the formation of the endothelium that gives rise to the blood brain barrier. Potent activator of the Tie-2 tyrosine kinase expression. Activation requires recruitment of transcriptional coactivators such as CREBBP and probably EP300. Interaction with redox regulatory protein APEX1 seems to activate CTAD (By similarity).
Click to Show/Hide
|
||||
| Uniprot ID | |||||
| Ensembl ID | |||||
| HGNC ID | |||||
| Click to Show/Hide the Complete Species Lineage | |||||
Type(s) of Resistant Mechanism of This Molecule
Drug Resistance Data Categorized by Drug
Approved Drug(s)
5 drug(s) in total
| Drug Resistance Data Categorized by Their Corresponding Mechanisms | ||||
|
|
||||
| Disease Class: Chronic myeloid leukemia [ICD-11: 2A20.0] | [1] | |||
| Resistant Disease | Chronic myeloid leukemia [ICD-11: 2A20.0] | |||
| Resistant Drug | Dasatinib | |||
| Molecule Alteration | Expression | Down-regulation |
||
| Experimental Note | Identified from the Human Clinical Data | |||
| In Vitro Model | Lin-CD34+CD38- cells | Bone | Homo sapiens (Human) | N.A. |
| Lin-CD34-CD38- CML cells | Bone | Homo sapiens (Human) | N.A. | |
| Experiment for Molecule Alteration |
Western blot analysis | |||
| Experiment for Drug Resistance |
Annexin V assay | |||
| Mechanism Description | The up-regulation of miR660-5p observed in CML LSCs led to the down-regulation of its target EPAS1 and conferred TkI-resistance to CML LSCs in vitro. | |||
| Drug Resistance Data Categorized by Their Corresponding Mechanisms | ||||
|
|
||||
| Disease Class: Gastric cancer [ICD-11: 2B72.1] | [2] | |||
| Resistant Disease | Gastric cancer [ICD-11: 2B72.1] | |||
| Resistant Drug | Docetaxel | |||
| Molecule Alteration | Expression | Up-regulation |
||
| Experimental Note | Revealed Based on the Cell Line Data | |||
| In Vitro Model | BGC-823 cells | Gastric | Homo sapiens (Human) | CVCL_3360 |
| BEL-7402 cells | Liver | Homo sapiens (Human) | CVCL_5492 | |
| HepG2 cells | Liver | Homo sapiens (Human) | CVCL_0027 | |
| HEK293 cells | Kidney | Homo sapiens (Human) | CVCL_0045 | |
| Experiment for Molecule Alteration |
Western blotting assay | |||
| Experiment for Drug Resistance |
Flow cytometry assay | |||
| Mechanism Description | Over-expression of EPAS-1 increased the expression of PXR responsive genes, enhanced the proliferation of BGC-823 cells and boosted the resistance of BGC-823 cells against the cytotoxicity of chemotherapeutic drugs, e.g. Mitomycin C and Paclitaxel.EPAS-1 reduces BGC-823 cell apoptosis induced by Mitomycin C and Paclitaxel. | |||
| Drug Resistance Data Categorized by Their Corresponding Mechanisms | ||||
|
|
||||
| Disease Class: Chronic myeloid leukemia [ICD-11: 2A20.0] | [1] | |||
| Resistant Disease | Chronic myeloid leukemia [ICD-11: 2A20.0] | |||
| Resistant Drug | Imatinib | |||
| Molecule Alteration | Expression | Down-regulation |
||
| Experimental Note | Identified from the Human Clinical Data | |||
| In Vitro Model | Lin-CD34+CD38- cells | Bone | Homo sapiens (Human) | N.A. |
| Lin-CD34-CD38- CML cells | Bone | Homo sapiens (Human) | N.A. | |
| Experiment for Molecule Alteration |
Western blot analysis | |||
| Experiment for Drug Resistance |
Annexin V assay | |||
| Mechanism Description | The up-regulation of miR660-5p observed in CML LSCs led to the down-regulation of its target EPAS1 and conferred TkI-resistance to CML LSCs in vitro. | |||
| Drug Resistance Data Categorized by Their Corresponding Mechanisms | ||||
|
|
||||
| Disease Class: Gastric cancer [ICD-11: 2B72.1] | [2] | |||
| Resistant Disease | Gastric cancer [ICD-11: 2B72.1] | |||
| Resistant Drug | Mitomycin | |||
| Molecule Alteration | Expression | Up-regulation |
||
| Experimental Note | Revealed Based on the Cell Line Data | |||
| In Vitro Model | BGC-823 cells | Gastric | Homo sapiens (Human) | CVCL_3360 |
| BEL-7402 cells | Liver | Homo sapiens (Human) | CVCL_5492 | |
| HepG2 cells | Liver | Homo sapiens (Human) | CVCL_0027 | |
| HEK293 cells | Kidney | Homo sapiens (Human) | CVCL_0045 | |
| Experiment for Molecule Alteration |
Western blotting assay | |||
| Experiment for Drug Resistance |
Flow cytometry assay | |||
| Mechanism Description | Over-expression of EPAS-1 increased the expression of PXR responsive genes, enhanced the proliferation of BGC-823 cells and boosted the resistance of BGC-823 cells against the cytotoxicity of chemotherapeutic drugs, e.g. Mitomycin C and Paclitaxel.EPAS-1 reduces BGC-823 cell apoptosis induced by Mitomycin C and Paclitaxel. | |||
| Drug Resistance Data Categorized by Their Corresponding Mechanisms | ||||
|
|
||||
| Disease Class: Chronic myeloid leukemia [ICD-11: 2A20.0] | [1] | |||
| Resistant Disease | Chronic myeloid leukemia [ICD-11: 2A20.0] | |||
| Resistant Drug | Ponatinib | |||
| Molecule Alteration | Expression | Down-regulation |
||
| Experimental Note | Identified from the Human Clinical Data | |||
| In Vitro Model | Lin-CD34+CD38- cells | Bone | Homo sapiens (Human) | N.A. |
| Lin-CD34-CD38- CML cells | Bone | Homo sapiens (Human) | N.A. | |
| Experiment for Molecule Alteration |
Western blot analysis | |||
| Experiment for Drug Resistance |
Annexin V assay | |||
| Mechanism Description | The up-regulation of miR660-5p observed in CML LSCs led to the down-regulation of its target EPAS1 and conferred TkI-resistance to CML LSCs in vitro. | |||
Disease- and Tissue-specific Abundances of This Molecule
ICD Disease Classification 02

| Differential expression of molecule in resistant diseases | ||
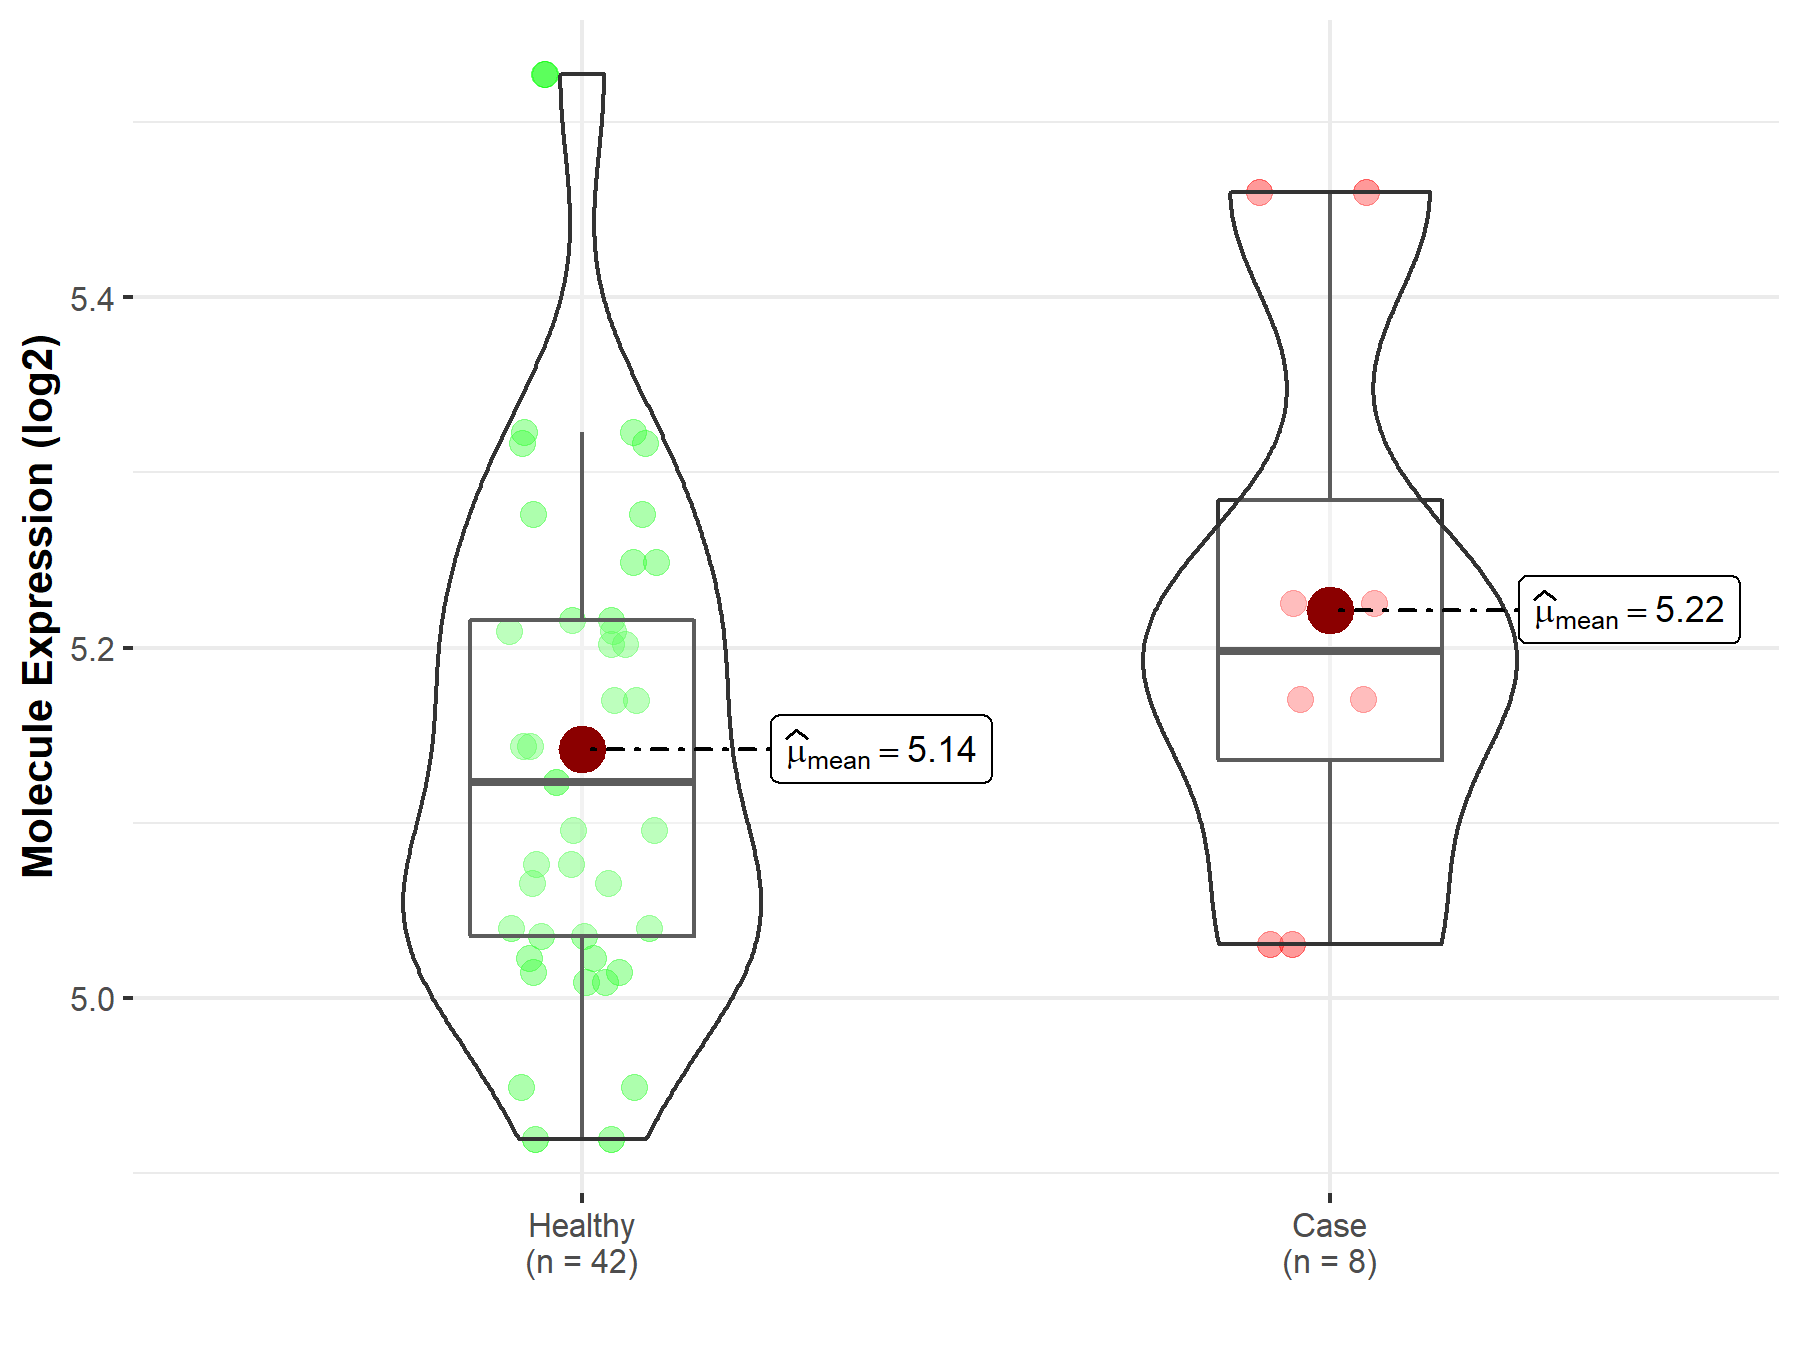
| The Studied Tissue | Whole blood | |
| The Specified Disease | Myelofibrosis | |
| The Expression Level of Disease Section Compare with the Healthy Individual Tissue | p-value: 2.35E-01; Fold-change: 7.49E-02; Z-score: 5.21E-01 | |
|
Molecule expression in the diseased tissue of patients
Molecule expression in the normal tissue of healthy individuals
|
||
| Disease-specific Molecule Abundances |

|
Click to View the Clearer Original Diagram |
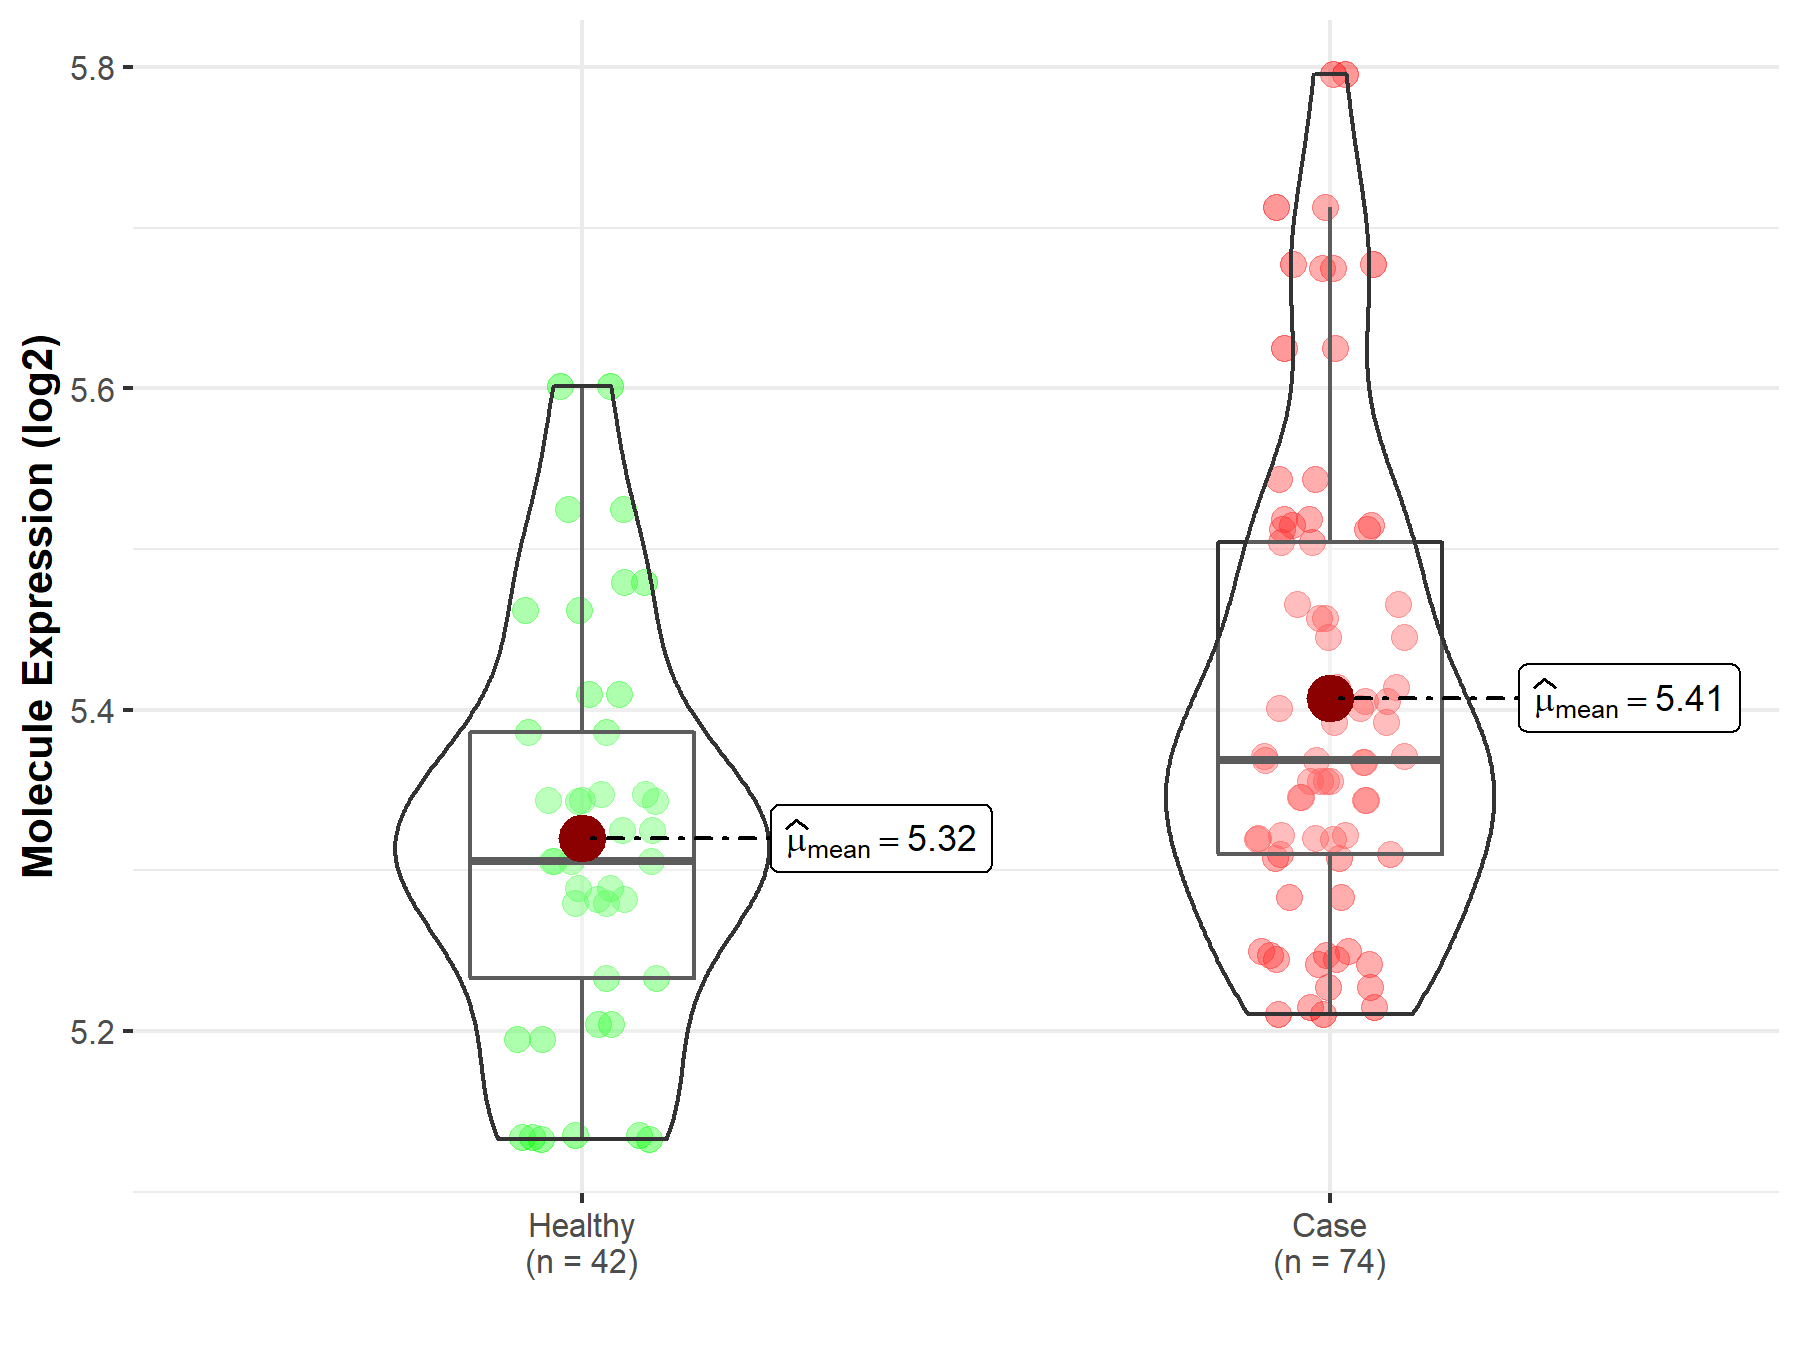
| The Studied Tissue | Whole blood | |
| The Specified Disease | Polycythemia vera | |
| The Expression Level of Disease Section Compare with the Healthy Individual Tissue | p-value: 1.09E-03; Fold-change: 6.29E-02; Z-score: 4.99E-01 | |
|
Molecule expression in the diseased tissue of patients
Molecule expression in the normal tissue of healthy individuals
|
||
| Disease-specific Molecule Abundances |

|
Click to View the Clearer Original Diagram |
| Differential expression of molecule in resistant diseases | ||
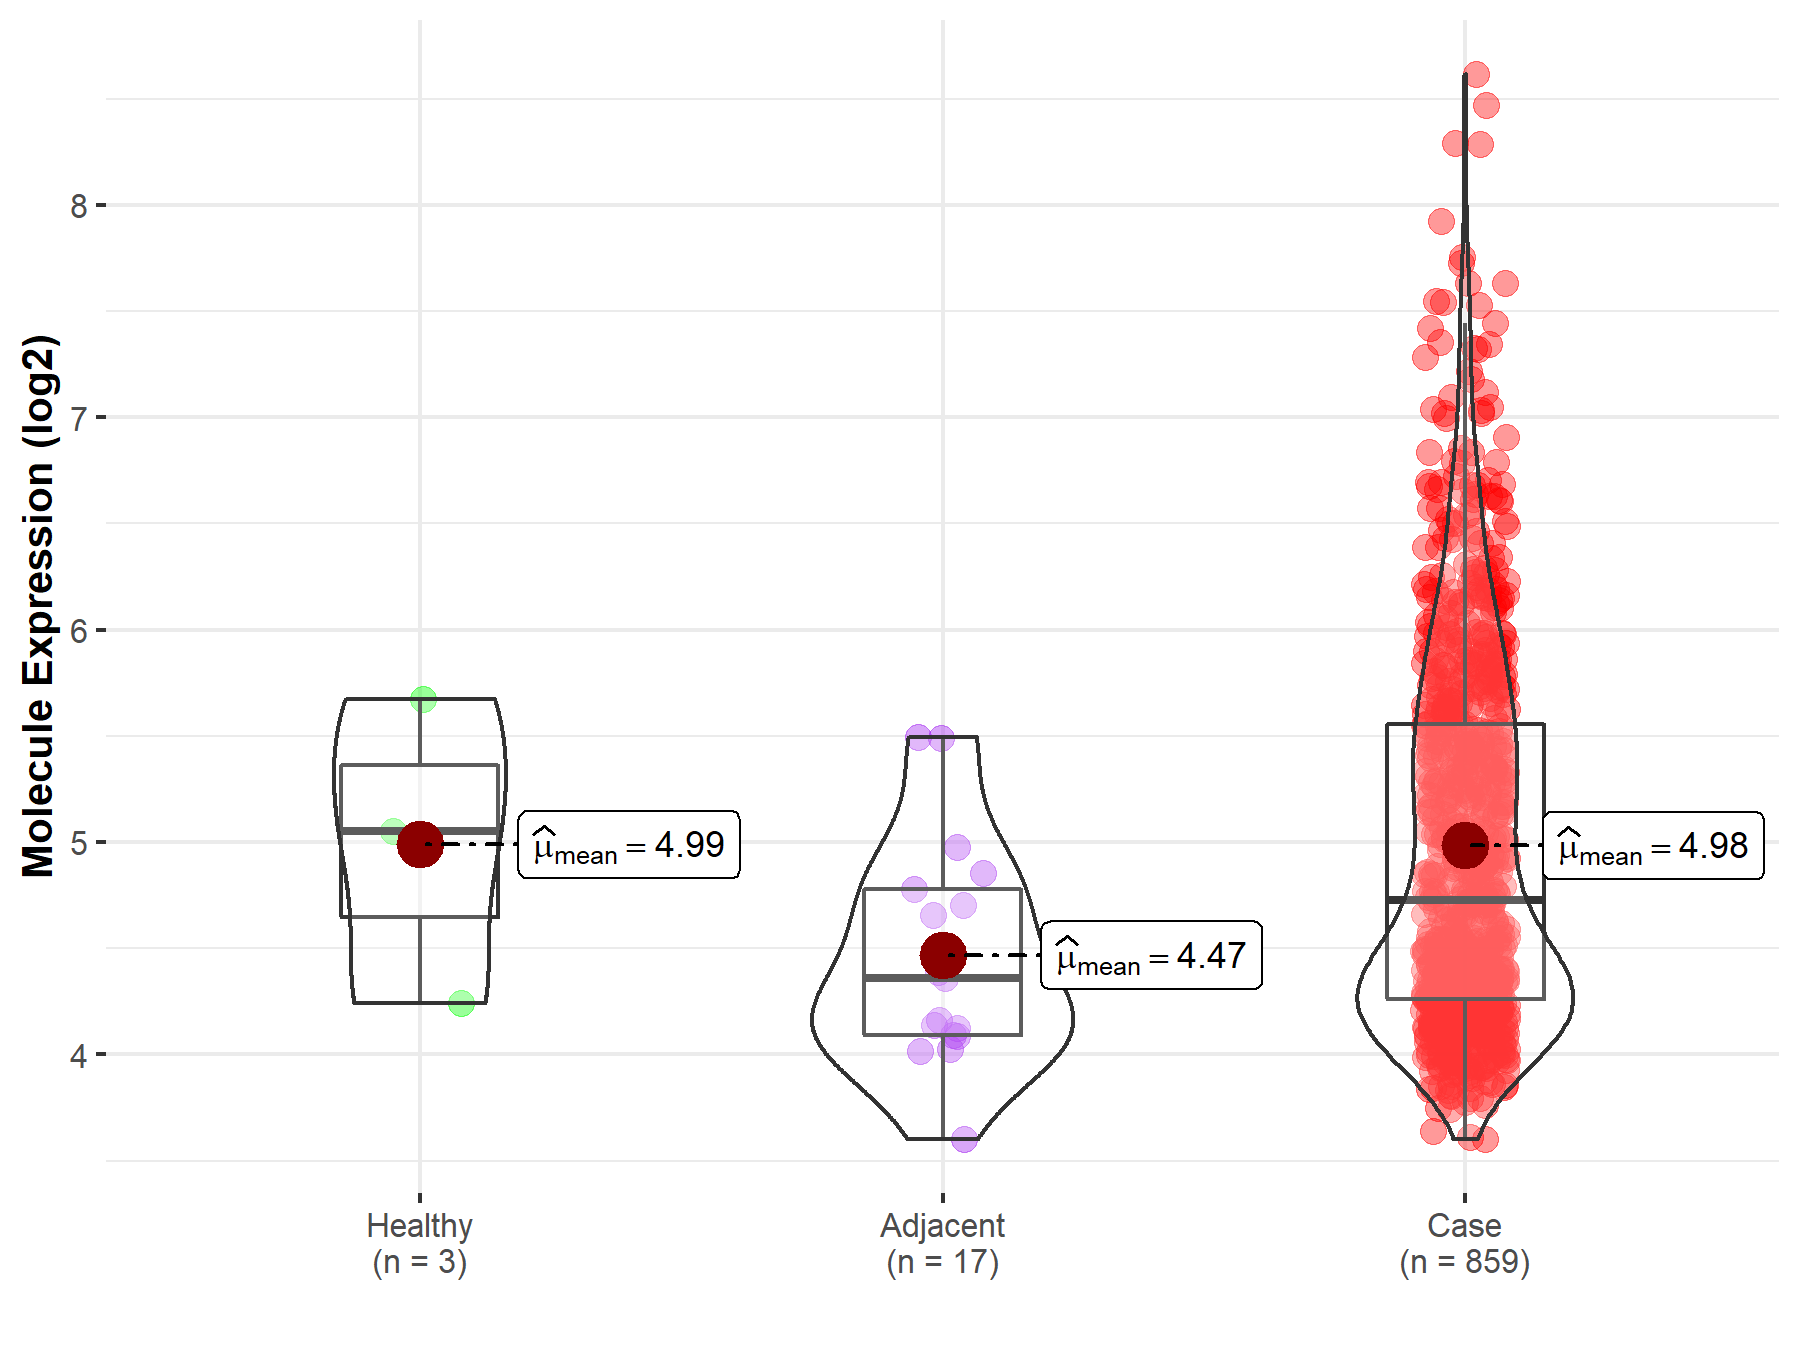
| The Studied Tissue | Gastric tissue | |
| The Specified Disease | Gastric cancer | |
| The Expression Level of Disease Section Compare with the Healthy Individual Tissue | p-value: 9.92E-01; Fold-change: -3.22E-01; Z-score: -4.50E-01 | |
| The Expression Level of Disease Section Compare with the Adjacent Tissue | p-value: 1.03E-03; Fold-change: 3.67E-01; Z-score: 6.93E-01 | |
|
Molecule expression in the normal tissue adjacent to the diseased tissue of patients
Molecule expression in the diseased tissue of patients
Molecule expression in the normal tissue of healthy individuals
|
||
| Disease-specific Molecule Abundances |

|
Click to View the Clearer Original Diagram |
Tissue-specific Molecule Abundances in Healthy Individuals


|
||
References
If you find any error in data or bug in web service, please kindly report it to Dr. Sun and Dr. Yu.
