Molecule Information
General Information of the Molecule (ID: Mol02114)
| Name |
Solute carrier family 5 member 2 (SLC5A2)
,Homo sapiens
|
||||
|---|---|---|---|---|---|
| Synonyms |
Sodium/glucose cotransporter 2 (Na(+)/glucose cotransporter 2) (Low affinity sodium-glucose cotransporter) (Solute carrier family 5 member 2); SLC5A2; SGLT2
Click to Show/Hide
|
||||
| Molecule Type |
Protein
|
||||
| Gene Name |
SLC5A2
|
||||
| Gene ID | |||||
| Location |
Chromosome 16: 31,483,002-31,490,860 forward strand
|
||||
| Sequence |
MEEHTEAGSAPEMGAQKALIDNPADILVIAAYFLLVIGVGLWSMCRTNRGTVGGYFLAGR
SMVWWPVGASLFASNIGSGHFVGLAGTGAASGLAVAGFEWNALFVVLLLGWLFAPVYLTA GVITMPQYLRKRFGGRRIRLYLSVLSLFLYIFTKISVDMFSGAVFIQQALGWNIYASVIA LLGITMIYTVTGGLAALMYTDTVQTFVILGGACILMGYAFHEVGGYSGLFDKYLGAATSL TVSEDPAVGNISSFCYRPRPDSYHLLRHPVTGDLPWPALLLGLTIVSGWYWCSDQVIVQR CLAGKSLTHIKAGCILCGYLKLTPMFLMVMPGMISRILYPDEVACVVPEVCRRVCGTEVG CSNIAYPRLVVKLMPNGLRGLMLAVMLAALMSSLASIFNSSSTLFTMDIYTRLRPRAGDR ELLLVGRLWVVFIVVVSVAWLPVVQAAQGGQLFDYIQAVSSYLAPPVSAVFVLALFVPRV NEQGAFWGLIGGLLMGLARLIPEFSFGSGSCVQPSACPAFLCGVHYLYFAIVLFFCSGLL TLTVSLCTAPIPRKHLHRLVFSLRHSKEEREDLDADEQQGSSLPVQNGCPESAMEMNEPQ APAPSLFRQCLLWFCGMSRGGVGSPPPLTQEEAAAAARRLEDISEDPSWARVVNLNALLM MAVAVFLWGFYA Click to Show/Hide
|
||||
| 3D-structure |
|
||||
| Function |
Electrogenic Na(+)-coupled sugar simporter that actively transports D-glucose at the plasma membrane, with a Na(+) to sugar coupling ratio of 1:1. Transporter activity is driven by a transmembrane Na(+) electrochemical gradient set by the Na(+)/K(+) pump. Has a primary role in D-glucose reabsorption from glomerular filtrate across the brush border of the early proximal tubules of the kidney.
Click to Show/Hide
|
||||
| Uniprot ID | |||||
| Ensembl ID | |||||
| HGNC ID | |||||
| Click to Show/Hide the Complete Species Lineage | |||||
Type(s) of Resistant Mechanism of This Molecule
Drug Resistance Data Categorized by Drug
Approved Drug(s)
1 drug(s) in total
| Drug Sensitivity Data Categorized by Their Corresponding Mechanisms | ||||
|
|
||||
| Disease Class: Type 2 diabetes mellitus [ICD-11: 5A11.0] | [1] | |||
| Sensitive Disease | Type 2 diabetes mellitus [ICD-11: 5A11.0] | |||
| Sensitive Drug | Canagliflozin | |||
| Molecule Alteration | Function | Inhibition |
||
| Experimental Note | Identified from the Human Clinical Data | |||
| Mechanism Description | Treatment with the SGLT2 (sodium-glucose cotransporter 2) inhibitor canagliflozin results in early and sustained reductions in systolic blood pressure in people with type 2 diabetes and chronic kidney disease, regardless of baseline blood pressure, number of blood pressure lowering agents, and history of apparent treatment-resistant hypertension. | |||
| Disease Class: Chronic kidney disease [ICD-11: GB61.0] | [1] | |||
| Sensitive Disease | Chronic kidney disease [ICD-11: GB61.0] | |||
| Sensitive Drug | Canagliflozin | |||
| Molecule Alteration | Function | Inhibition |
||
| Experimental Note | Identified from the Human Clinical Data | |||
| Mechanism Description | Treatment with the SGLT2 (sodium-glucose cotransporter 2) inhibitor canagliflozin results in early and sustained reductions in systolic blood pressure in people with type 2 diabetes and chronic kidney disease, regardless of baseline blood pressure, number of blood pressure lowering agents, and history of apparent treatment-resistant hypertension. | |||
Disease- and Tissue-specific Abundances of This Molecule
ICD Disease Classification 05

| Differential expression of molecule in resistant diseases | ||
| The Studied Tissue | Omental adipose tissue | |
| The Specified Disease | Obesity related type 2 diabetes | |
| The Expression Level of Disease Section Compare with the Healthy Individual Tissue | p-value: 2.23E-01; Fold-change: 9.35E-02; Z-score: 5.84E-01 | |
|
Molecule expression in the diseased tissue of patients
Molecule expression in the normal tissue of healthy individuals
|
||
| Disease-specific Molecule Abundances |

|
Click to View the Clearer Original Diagram |
| The Studied Tissue | Liver | |
| The Specified Disease | Type 2 diabetes mellitus | |
| The Expression Level of Disease Section Compare with the Healthy Individual Tissue | p-value: 3.26E-01; Fold-change: -8.69E-02; Z-score: -3.68E-01 | |
|
Molecule expression in the diseased tissue of patients
Molecule expression in the normal tissue of healthy individuals
|
||
| Disease-specific Molecule Abundances |

|
Click to View the Clearer Original Diagram |
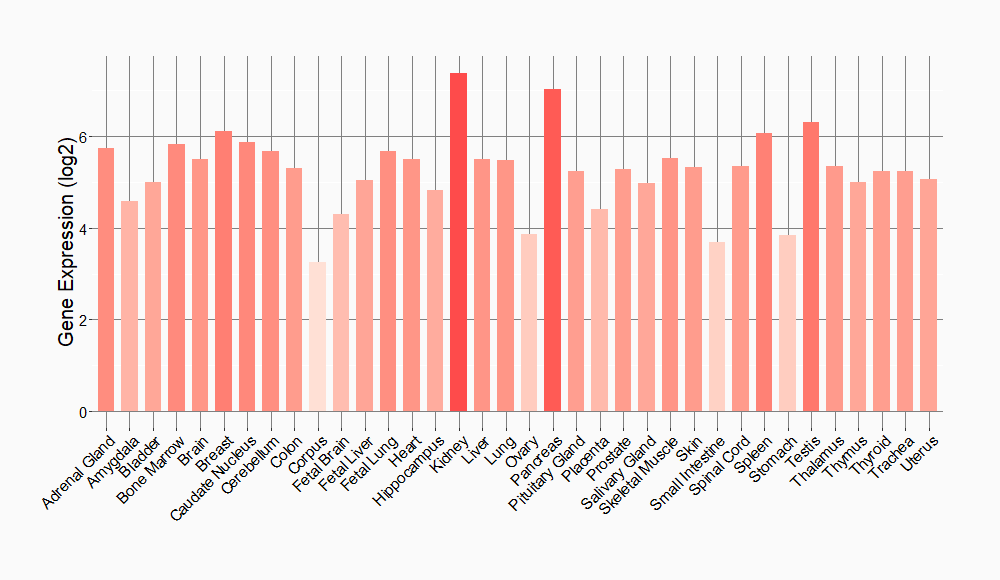
Tissue-specific Molecule Abundances in Healthy Individuals


|
||
References
If you find any error in data or bug in web service, please kindly report it to Dr. Sun and Dr. Yu.
