Molecule Information
General Information of the Molecule (ID: Mol01945)
| Name |
Bile acyl-CoA synthetase (S27A5)
,Homo sapiens
|
||||
|---|---|---|---|---|---|
| Synonyms |
SLC27A5; ACSB; ACSVL6; FACVL3; FATP5
Click to Show/Hide
|
||||
| Molecule Type |
Protein
|
||||
| Gene Name |
S27A5
|
||||
| Gene ID | |||||
| Location |
chr19:58,479,512-58,512,413[-]
|
||||
| Sequence |
MGVRQQLALLLLLLLLLWGLGQPVWPVAVALTLRWLLGDPTCCVLLGLAMLARPWLGPWV
PHGLSLAAAALALTLLPARLPPGLRWLPADVIFLAKILHLGLKIRGCLSRQPPDTFVDAF ERRARAQPGRALLVWTGPGAGSVTFGELDARACQAAWALKAELGDPASLCAGEPTALLVL ASQAVPALCMWLGLAKLGCPTAWINPHGRGMPLAHSVLSSGARVLVVDPDLRESLEEILP KLQAENIRCFYLSHTSPTPGVGALGAALDAAPSHPVPADLRAGITWRSPALFIYTSGTTG LPKPAILTHERVLQMSKMLSLSGATADDVVYTVLPLYHVMGLVVGILGCLDLGATCVLAP KFSTSCFWDDCRQHGVTVILYVGELLRYLCNIPQQPEDRTHTVRLAMGNGLRADVWETFQ QRFGPIRIWEVYGSTEGNMGLVNYVGRCGALGKMSCLLRMLSPFELVQFDMEAAEPVRDN QGFCIPVGLGEPGLLLTKVVSQQPFVGYRGPRELSERKLVRNVRQSGDVYYNTGDVLAMD REGFLYFRDRLGDTFRWKGENVSTHEVEGVLSQVDFLQQVNVYGVCVPGCEGKVGMAAVQ LAPGQTFDGEKLYQHVRAWLPAYATPHFIRIQDAMEVTSTFKLMKTRLVREGFNVGIVVD PLFVLDNRAQSFRPLTAEMYQAVCEGTWRL Click to Show/Hide
|
||||
| Function |
Acyl-CoA synthetase that catalyzes the activation of bile acids via formation of bile acid CoA thioesters which is necessary for their subsequent conjugation with glycine or taurine. Both primary bile acids (cholic acid and chenodeoxycholic acid) and secondary bile acids (deoxycholic acid and lithocholic acid) are the principal substrates. Also exhibits acyl CoA synthetase activity that activates very long-chain fatty acids (VLCFAs) by catalyzing the formation of fatty acyl-CoA. In vitro, also activates 3-alpha,7-alpha,12-alpha-trihydroxy-5-beta-cholestanate (THCA), the C27 precursor of cholic acid deriving from the de novo synthesis from cholesterol. Exhibits long-chain fatty acids (LCFA) transport activity. Plays an important role in hepatic fatty acid uptake and bile acid reconjugation and recycling but not in de novo synthesis of bile acids.
Click to Show/Hide
|
||||
| Uniprot ID | |||||
| Ensembl ID | |||||
| Click to Show/Hide the Complete Species Lineage | |||||
Type(s) of Resistant Mechanism of This Molecule
Drug Resistance Data Categorized by Drug
Approved Drug(s)
1 drug(s) in total
| Drug Sensitivity Data Categorized by Their Corresponding Mechanisms | ||||
|
|
||||
| Disease Class: Type 2 diabetes mellitus [ICD-11: 5A11.0] | [1] | |||
| Sensitive Disease | Type 2 diabetes mellitus [ICD-11: 5A11.0] | |||
| Sensitive Drug | Insulin | |||
| Molecule Alteration | Expression | Down-regulation |
||
| Differential expression of the molecule in resistant disease | ||||
| Classification of Disease | Type 2 diabetes mellitus [ICD-11: 5A11] | |||
| The Specified Disease | Type 2 diabetes | |||
| The Studied Tissue | Liver tissue | |||
| The Expression Level of Disease Section Compare with the Healthy Individual Tissue | p-value: 1.63E-01 Fold-change: -4.50E-02 Z-score: -1.65E+00 |
|||
| Experimental Note | Identified from the Human Clinical Data | |||
| Mechanism Description | Several studies have shown that lipid accumulation in liver and skeletal muscle caused by short-term HFD feeding or lipid/heparin infusions induce insulin resistance in rats. In addition, overexpression of lipoprotein lipase (LPL) in liver or muscle induced peripheral insulin resistance and the accumulation of lipid in respective tissues, and skeletal muscle-specific LPL deletion enhanced insulin signaling in HFD challenged muscle. Furthermore, deleting fat transport proteins such as CD36 or FATP-1 increased insulin-mediated glucose uptake in skeletal muscle, and liver-specific knockdown of FATP2 or FATP5 significantly reduced HFD-induced hepatosteatosis and increased glucose tolerance. | |||
Disease- and Tissue-specific Abundances of This Molecule
ICD Disease Classification 05

| Differential expression of molecule in resistant diseases | ||
| The Studied Tissue | Omental adipose tissue | |
| The Specified Disease | Obesity related type 2 diabetes | |
| The Expression Level of Disease Section Compare with the Healthy Individual Tissue | p-value: 3.39E-01; Fold-change: -1.50E-02; Z-score: -2.39E-01 | |
|
Molecule expression in the diseased tissue of patients
Molecule expression in the normal tissue of healthy individuals
|
||
| Disease-specific Molecule Abundances |

|
Click to View the Clearer Original Diagram |
| The Studied Tissue | Liver | |
| The Specified Disease | Type 2 diabetes mellitus | |
| The Expression Level of Disease Section Compare with the Healthy Individual Tissue | p-value: 1.63E-01; Fold-change: -2.55E-01; Z-score: -6.84E-01 | |
|
Molecule expression in the diseased tissue of patients
Molecule expression in the normal tissue of healthy individuals
|
||
| Disease-specific Molecule Abundances |

|
Click to View the Clearer Original Diagram |
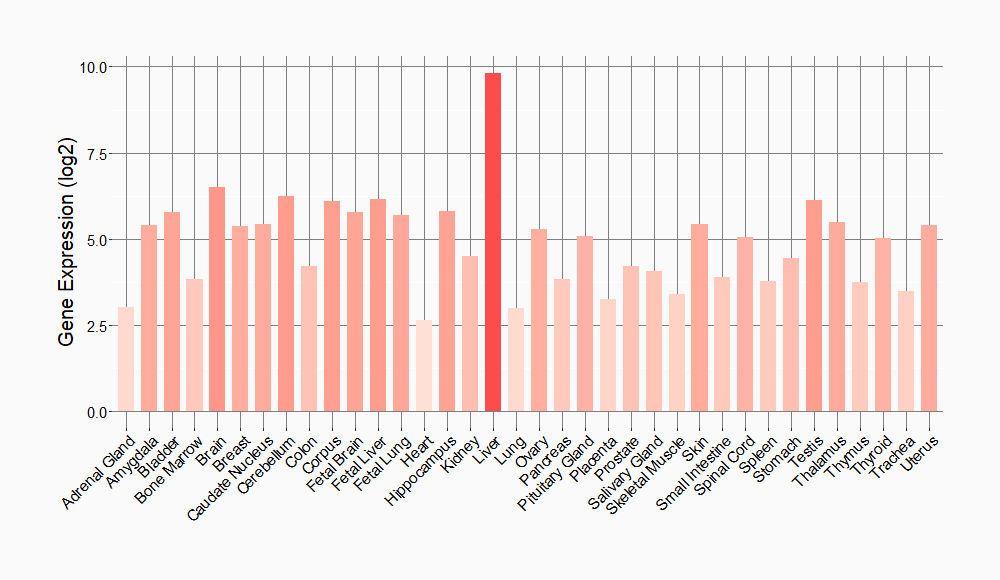
Tissue-specific Molecule Abundances in Healthy Individuals


|
||
References
If you find any error in data or bug in web service, please kindly report it to Dr. Sun and Dr. Yu.
