Molecule Information
General Information of the Molecule (ID: Mol01938)
| Name |
Serine palmitoyltransferase long chain base subunit 2 (SPTLC2)
,Homo sapiens
|
||||
|---|---|---|---|---|---|
| Synonyms |
SPTLC2; KIAA0526; LCB2
Click to Show/Hide
|
||||
| Molecule Type |
Protein
|
||||
| Gene Name |
SPTLC2
|
||||
| Gene ID | |||||
| Location |
chr14:77,505,997-77,616,637[-]
|
||||
| Sequence |
MRPEPGGCCCRRTVRANGCVANGEVRNGYVRSSAAAAAAAAAGQIHHVTQNGGLYKRPFN
EAFEETPMLVAVLTYVGYGVLTLFGYLRDFLRYWRIEKCHHATEREEQKDFVSLYQDFEN FYTRNLYMRIRDNWNRPICSVPGARVDIMERQSHDYNWSFKYTGNIIKGVINMGSYNYLG FARNTGSCQEAAAKVLEEYGAGVCSTRQEIGNLDKHEELEELVARFLGVEAAMAYGMGFA TNSMNIPALVGKGCLILSDELNHASLVLGARLSGATIRIFKHNNMQSLEKLLKDAIVYGQ PRTRRPWKKILILVEGIYSMEGSIVRLPEVIALKKKYKAYLYLDEAHSIGALGPTGRGVV EYFGLDPEDVDVMMGTFTKSFGASGGYIGGKKELIDYLRTHSHSAVYATSLSPPVVEQII TSMKCIMGQDGTSLGKECVQQLAENTRYFRRRLKEMGFIIYGNEDSPVVPLMLYMPAKIG AFGREMLKRNIGVVVVGFPATPIIESRARFCLSAAHTKEILDTALKEIDEVGDLLQLKYS RHRLVPLLDRPFDETTYEETED Click to Show/Hide
|
||||
| 3D-structure |
|
||||
| Function |
Serine palmitoyltransferase (SPT). The heterodimer formed with LCB1/SPTLC1 constitutes the catalytic core. The composition of the serine palmitoyltransferase (SPT) complex determines the substrate preference. The SPTLC1-SPTLC2-SPTSSA complex shows a strong preference for C16-CoA substrate, while the SPTLC1-SPTLC2-SPTSSB complex displays a preference for C18-CoA substrate. Plays an important role in de novo sphyngolipid biosynthesis which is crucial for adipogenesis (By similarity).
Click to Show/Hide
|
||||
| Uniprot ID | |||||
| Ensembl ID | |||||
| HGNC ID | |||||
| Click to Show/Hide the Complete Species Lineage | |||||
Type(s) of Resistant Mechanism of This Molecule
Drug Resistance Data Categorized by Drug
Approved Drug(s)
1 drug(s) in total
| Drug Resistance Data Categorized by Their Corresponding Mechanisms | ||||
|
|
||||
| Disease Class: Type 2 diabetes mellitus [ICD-11: 5A11.0] | [1] | |||
| Resistant Disease | Type 2 diabetes mellitus [ICD-11: 5A11.0] | |||
| Resistant Drug | Insulin | |||
| Molecule Alteration | Expression | Down-regulation |
||
| Experimental Note | Identified from the Human Clinical Data | |||
| Mechanism Description | Adipocyte-specific basic region-leucine zipper (B-ZIP) transcription factor knockout mice, which are called A-ZIP/F-1 fatless mice due to a lack of white fat tissue, are hyperinsulinemic and hyperglycemic, due to severe defects in IRS-1 and -2 associated PI3K activity in muscle and liver. The overexpression of preadipocyte factor-1 (Pref-1), a secreted protein that inhibits adipocyte differentiation, also induced the characteristics of lipodystrophic models, that is, reduced adipose tissue mass, dyslipidemia, and insulin resistance. In addition, the inhibition of de novo sphingolipid biosynthesis by adipocyte-specific knockout of serine palmitoyltransferase 2 (Sptlc2), which catalyzes the first step of de novo sphingolipid synthesis, exhibited impaired adipose tissue development and a lipodystrophic phenotype, which progressed to systemic insulin resistance. The ability to form unilocular lipid droplets in white adipocytes is required to maintain the ability of white adipocytes to store lipids. Knock out mice of fat-specific protein 27 (Fsp27) showed multilocular lipid droplets in adipocytes and increased lipolysis, resulting in hepatic steatosis and insulin resistance. | |||
Disease- and Tissue-specific Abundances of This Molecule
ICD Disease Classification 05

| Differential expression of molecule in resistant diseases | ||
| The Studied Tissue | Omental adipose tissue | |
| The Specified Disease | Obesity related type 2 diabetes | |
| The Expression Level of Disease Section Compare with the Healthy Individual Tissue | p-value: 9.41E-01; Fold-change: -1.31E-01; Z-score: -3.23E-01 | |
|
Molecule expression in the diseased tissue of patients
Molecule expression in the normal tissue of healthy individuals
|
||
| Disease-specific Molecule Abundances |

|
Click to View the Clearer Original Diagram |
| The Studied Tissue | Liver | |
| The Specified Disease | Type 2 diabetes mellitus | |
| The Expression Level of Disease Section Compare with the Healthy Individual Tissue | p-value: 5.30E-02; Fold-change: 2.70E-01; Z-score: 1.12E+00 | |
|
Molecule expression in the diseased tissue of patients
Molecule expression in the normal tissue of healthy individuals
|
||
| Disease-specific Molecule Abundances |

|
Click to View the Clearer Original Diagram |
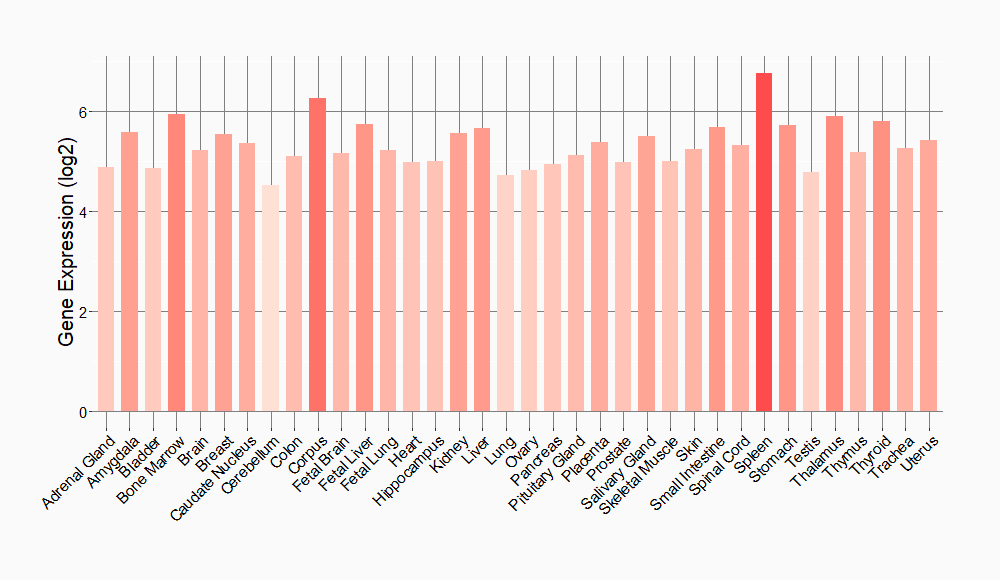
Tissue-specific Molecule Abundances in Healthy Individuals


|
||
References
If you find any error in data or bug in web service, please kindly report it to Dr. Sun and Dr. Yu.
