Molecule Information
General Information of the Molecule (ID: Mol01874)
| Name |
Gamma-aminobutyric acid receptor subunit alpha-1 (GABAARs)
,Homo sapiens
|
||||
|---|---|---|---|---|---|
| Synonyms |
GABRA1
Click to Show/Hide
|
||||
| Molecule Type |
Protein
|
||||
| Gene Name |
GABAARs
|
||||
| Gene ID | |||||
| Location |
chr5:161,847,063-161,899,981[+]
|
||||
| Sequence |
MRKSPGLSDCLWAWILLLSTLTGRSYGQPSLQDELKDNTTVFTRILDRLLDGYDNRLRPG
LGERVTEVKTDIFVTSFGPVSDHDMEYTIDVFFRQSWKDERLKFKGPMTVLRLNNLMASK IWTPDTFFHNGKKSVAHNMTMPNKLLRITEDGTLLYTMRLTVRAECPMHLEDFPMDAHAC PLKFGSYAYTRAEVVYEWTREPARSVVVAEDGSRLNQYDLLGQTVDSGIVQSSTGEYVVM TTHFHLKRKIGYFVIQTYLPCIMTVILSQVSFWLNRESVPARTVFGVTTVLTMTTLSISA RNSLPKVAYATAMDWFIAVCYAFVFSALIEFATVNYFTKRGYAWDGKSVVPEKPKKVKDP LIKKNNTYAPTATSYTPNLARGDPGLATIAKSATIEPKEVKPETKPPEPKKTFNSVSKID RLSRIAFPLLFGIFNLVYWATYLNREPQLKAPTPHQ Click to Show/Hide
|
||||
| 3D-structure |
|
||||
| Function |
Ligand-gated chloride channel which is a component of the heteropentameric receptor for GABA, the major inhibitory neurotransmitter in the brain. Plays an important role in the formation of functional inhibitory GABAergic synapses in addition to mediating synaptic inhibition as a GABA-gated ion channel. The gamma2 subunit is necessary but not sufficient for a rapid formation of active synaptic contacts and the synaptogenic effect of this subunit is influenced by the type of alpha and beta subunits present in the receptor pentamer. The alpha1/beta2/gamma2 receptor and the alpha1/beta3/gamma2 receptor exhibit synaptogenic activity. GABRA1-mediated plasticity in the orbitofrontal cortex regulates context-dependent action selection. Functions also as histamine receptor and mediates cellular responses to histamine.
Click to Show/Hide
|
||||
| Uniprot ID | |||||
| Ensembl ID | |||||
| HGNC ID | |||||
| Click to Show/Hide the Complete Species Lineage | |||||
Type(s) of Resistant Mechanism of This Molecule
Drug Resistance Data Categorized by Drug
Approved Drug(s)
1 drug(s) in total
| Drug Resistance Data Categorized by Their Corresponding Mechanisms | ||||
|
|
||||
| Disease Class: Neuroblastoma [ICD-11: 2A00.11] | [1] | |||
| Resistant Disease | Neuroblastoma [ICD-11: 2A00.11] | |||
| Resistant Drug | Picrotoxin | |||
| Molecule Alteration | Function | Inhibition |
||
| Experimental Note | Revealed Based on the Cell Line Data | |||
| In Vitro Model | SH-1-V7 cells | Esophagus | Homo sapiens (Human) | N.A. |
| Experiment for Molecule Alteration |
Whole-cell patch-clamp recording assay | |||
| Experiment for Drug Resistance |
Slice whole-cell recording | |||
| Mechanism Description | Receptors containing Delta T6'Y had marginally weaker sensitivity to positive allosteric modulators, likely a secondary consequence of differing GABA sensitivity. Overexpression of DeltaT6'Y in neurons resulted in robust PTX-insensitive IPSCs, suggesting that Delta-containing receptors are readily recruited by synaptically released GABA. | |||
Disease- and Tissue-specific Abundances of This Molecule
ICD Disease Classification 02

| Differential expression of molecule in resistant diseases | ||
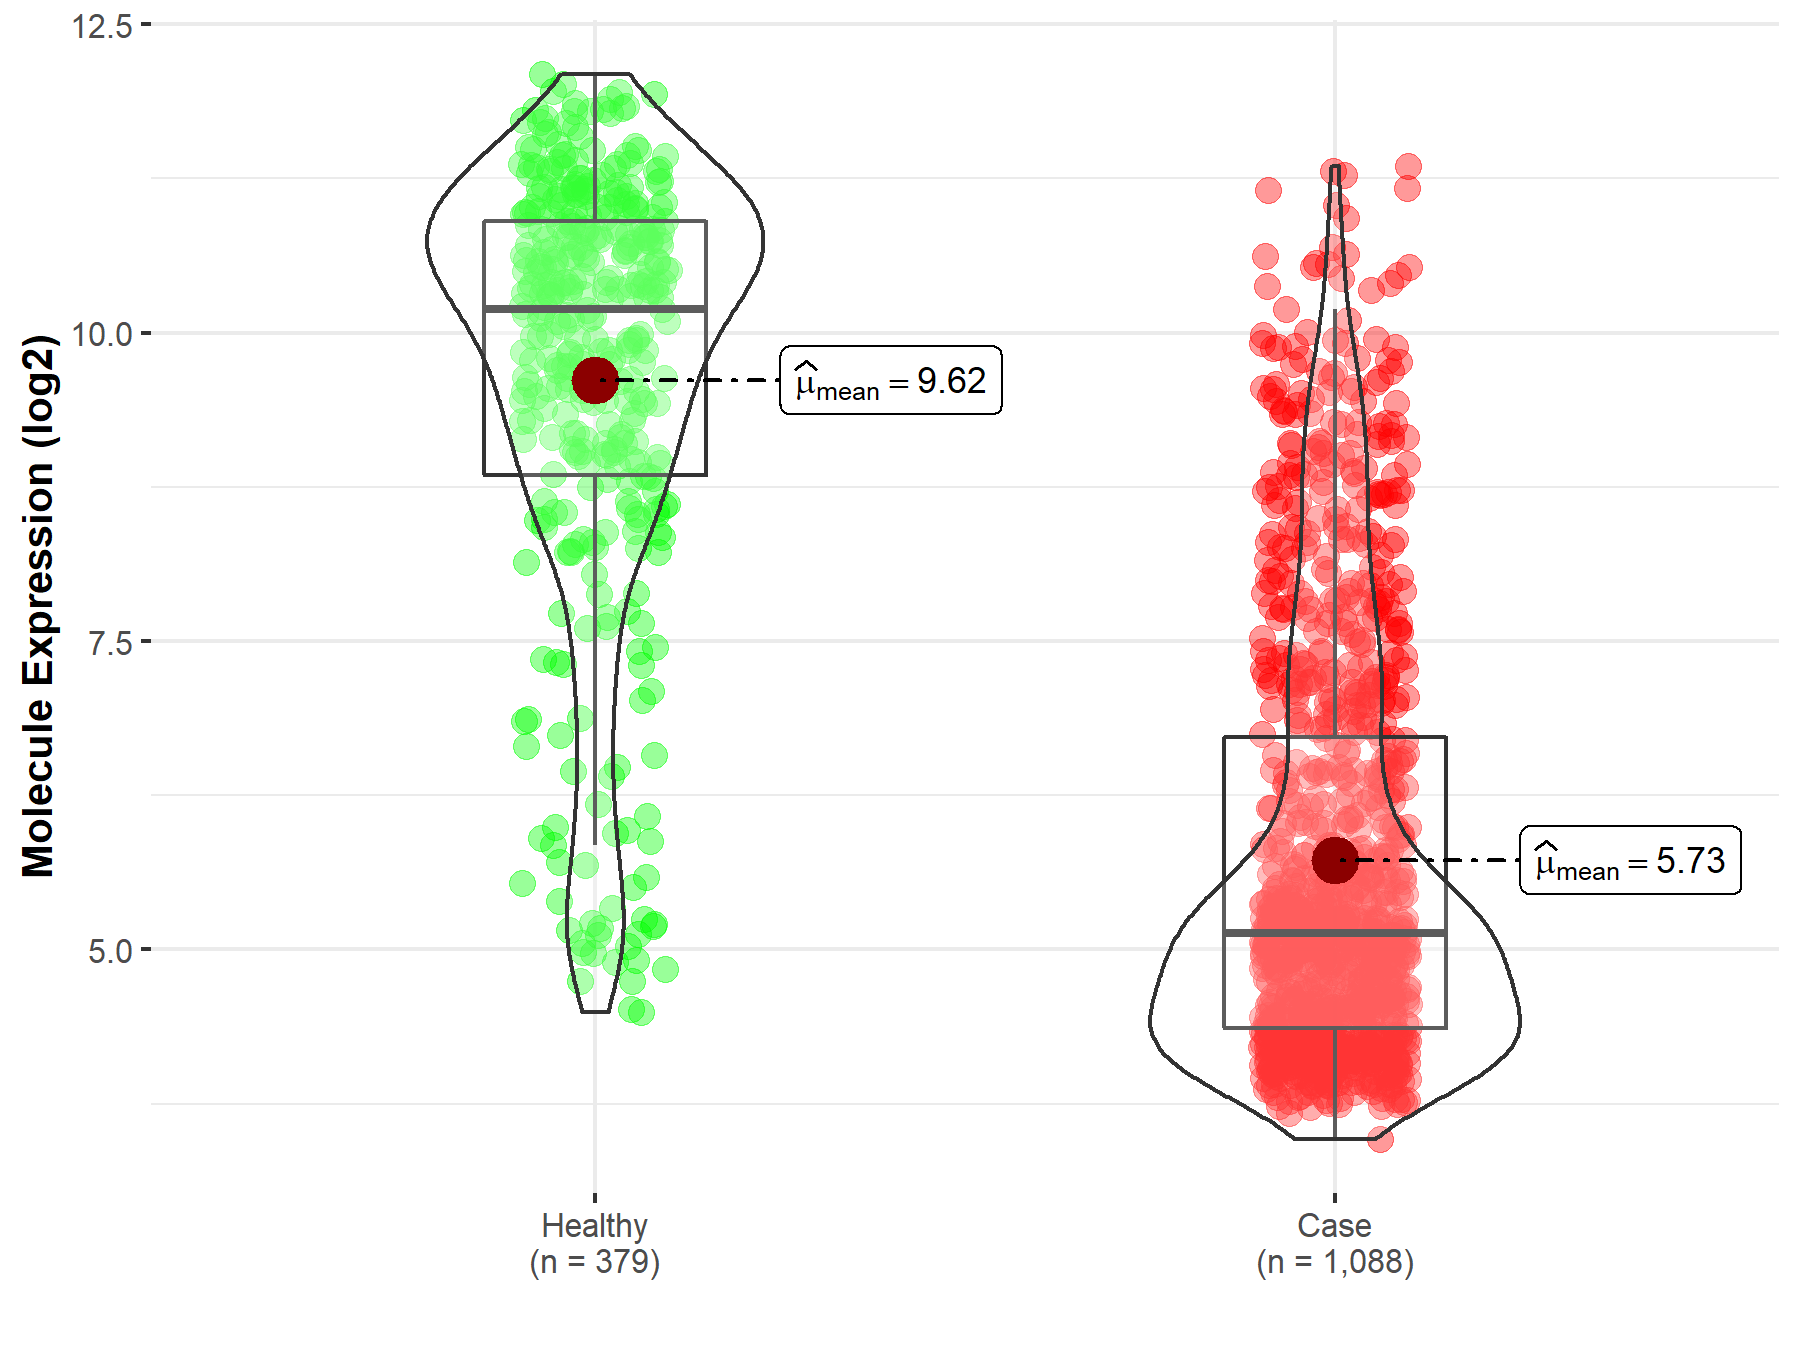
| The Studied Tissue | Nervous tissue | |
| The Specified Disease | Brain cancer | |
| The Expression Level of Disease Section Compare with the Healthy Individual Tissue | p-value: 5.75E-159; Fold-change: -5.05E+00; Z-score: -2.81E+00 | |
|
Molecule expression in the diseased tissue of patients
Molecule expression in the normal tissue of healthy individuals
|
||
| Disease-specific Molecule Abundances |

|
Click to View the Clearer Original Diagram |
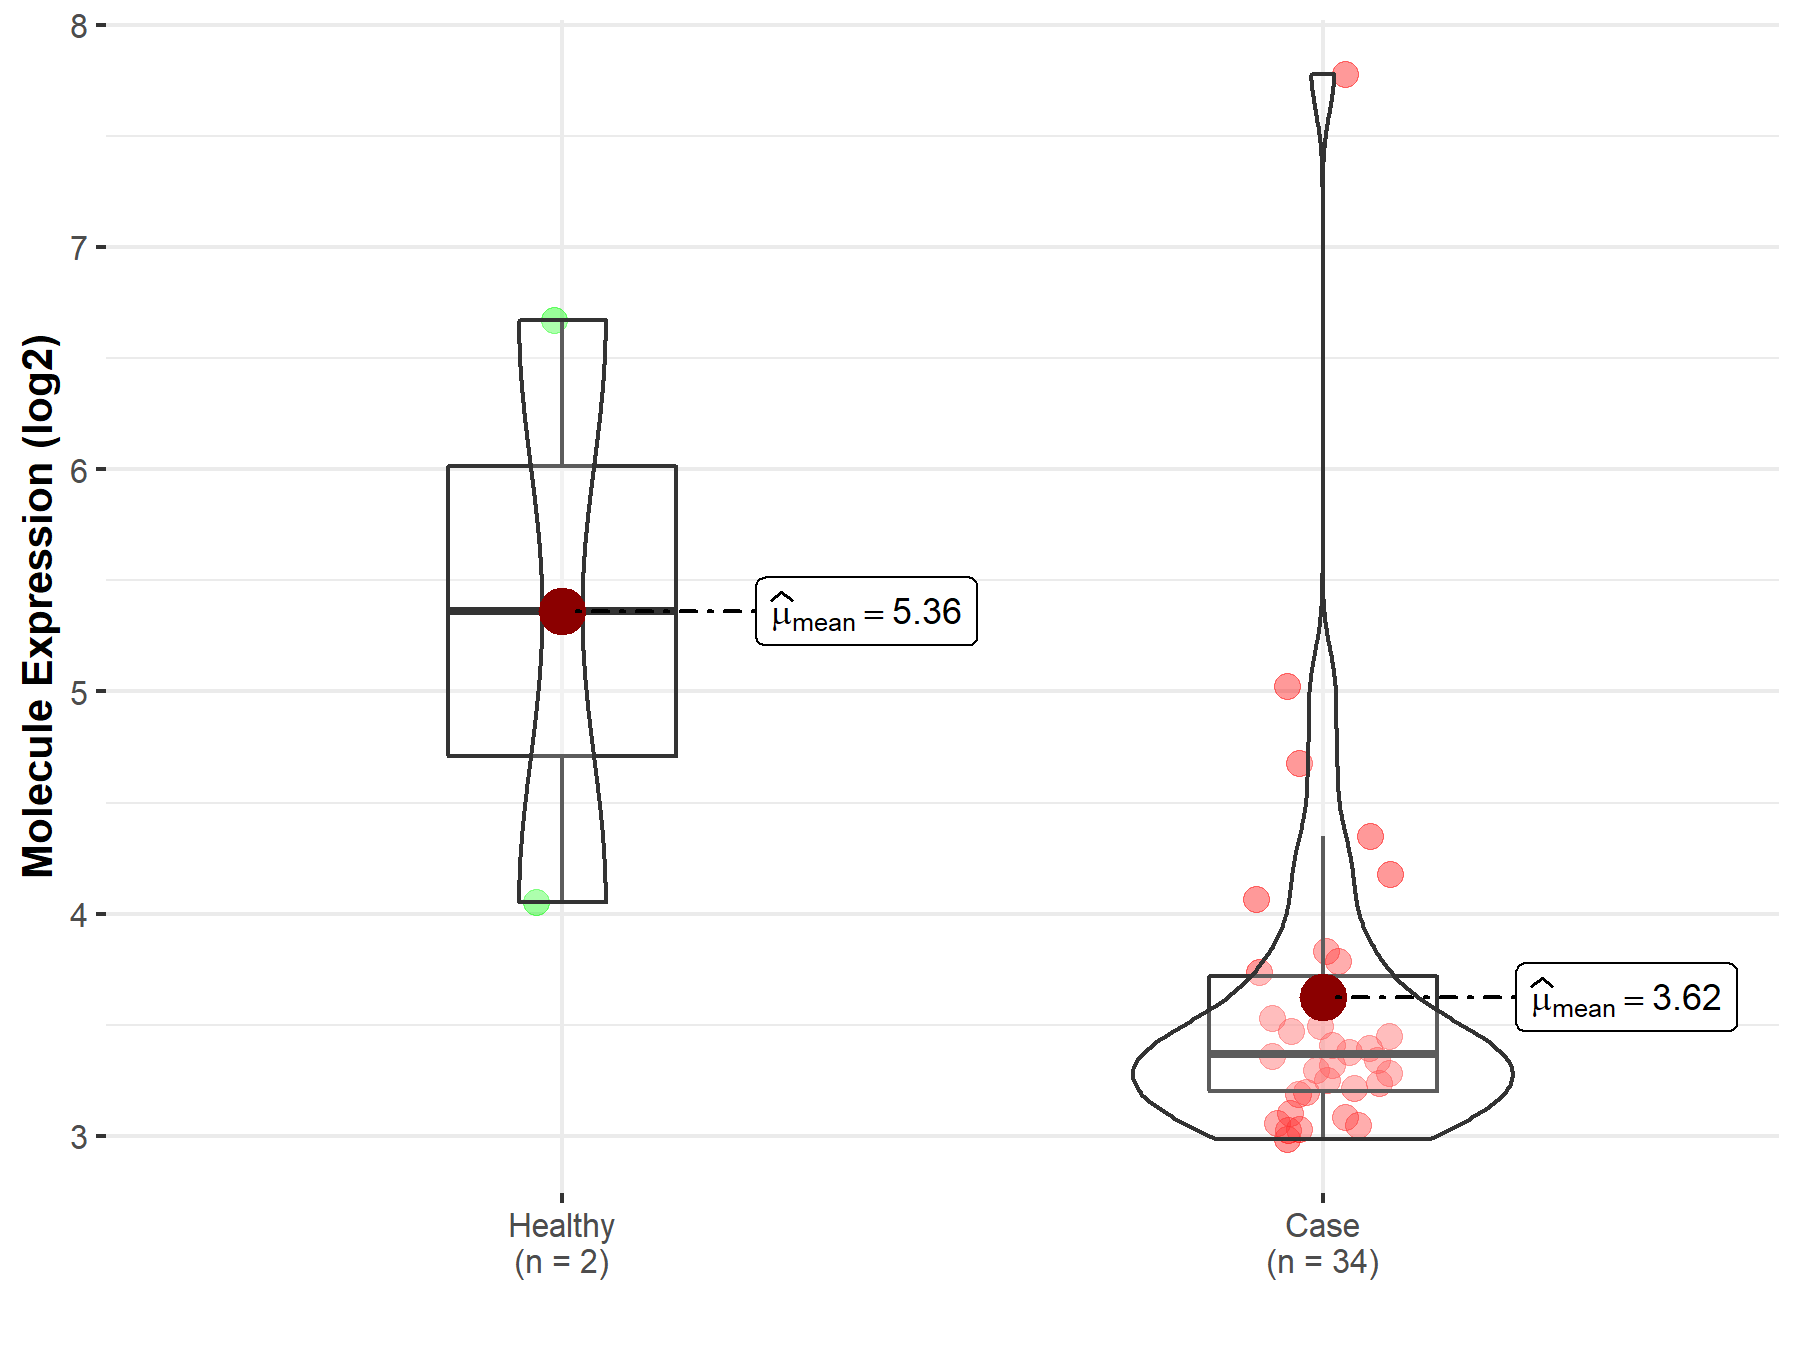
| The Studied Tissue | Brainstem tissue | |
| The Specified Disease | Glioma | |
| The Expression Level of Disease Section Compare with the Healthy Individual Tissue | p-value: 4.09E-01; Fold-change: -1.99E+00; Z-score: -1.08E+00 | |
|
Molecule expression in the diseased tissue of patients
Molecule expression in the normal tissue of healthy individuals
|
||
| Disease-specific Molecule Abundances |

|
Click to View the Clearer Original Diagram |
| The Studied Tissue | White matter | |
| The Specified Disease | Glioma | |
| The Expression Level of Disease Section Compare with the Healthy Individual Tissue | p-value: 1.57E-01; Fold-change: -2.04E-01; Z-score: -9.25E-01 | |
|
Molecule expression in the diseased tissue of patients
Molecule expression in the normal tissue of healthy individuals
|
||
| Disease-specific Molecule Abundances |

|
Click to View the Clearer Original Diagram |
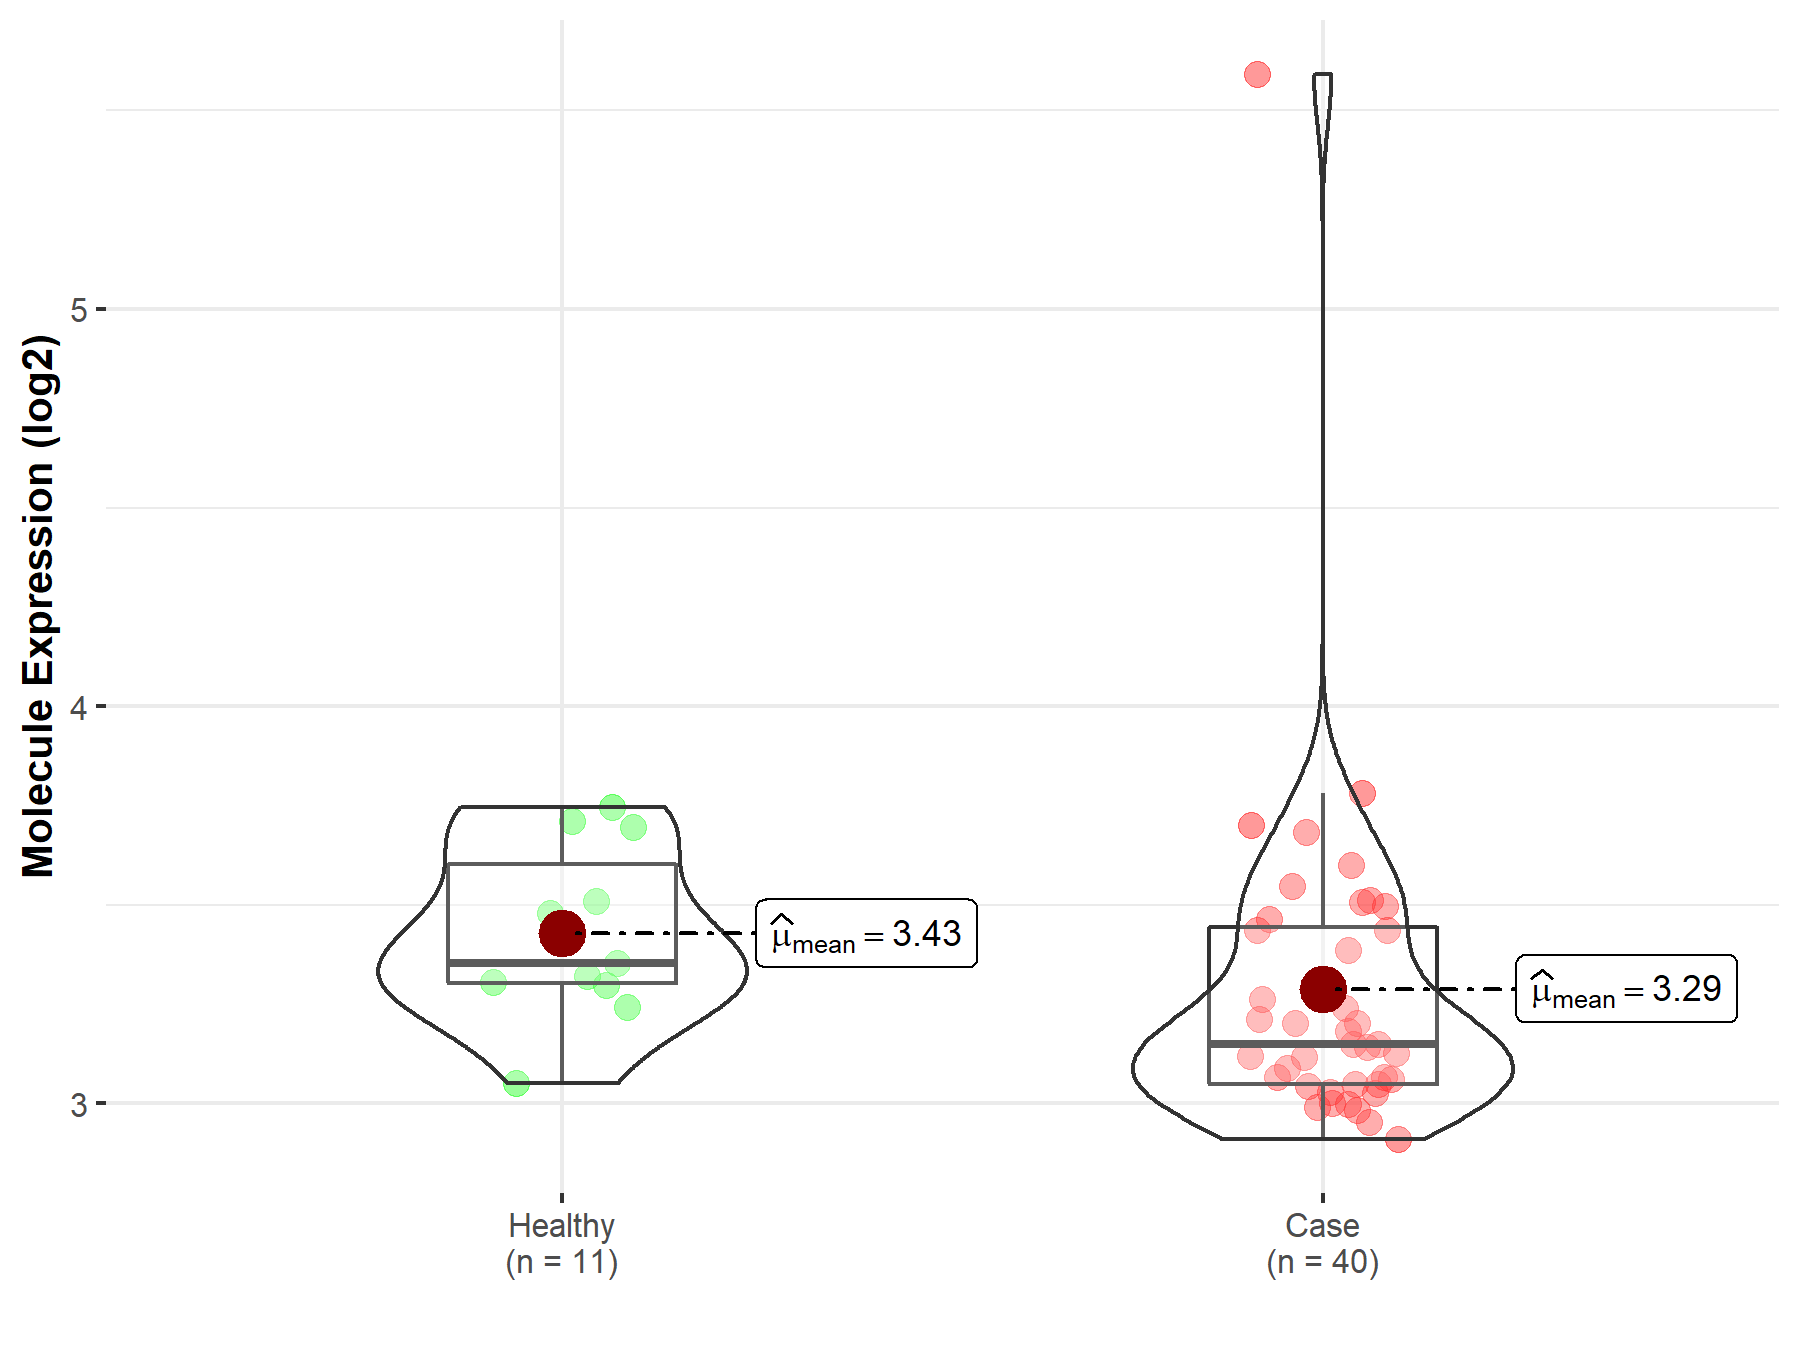
| The Studied Tissue | Brainstem tissue | |
| The Specified Disease | Neuroectodermal tumor | |
| The Expression Level of Disease Section Compare with the Healthy Individual Tissue | p-value: 4.17E-01; Fold-change: -6.05E-01; Z-score: -1.08E+00 | |
|
Molecule expression in the diseased tissue of patients
Molecule expression in the normal tissue of healthy individuals
|
||
| Disease-specific Molecule Abundances |

|
Click to View the Clearer Original Diagram |
Tissue-specific Molecule Abundances in Healthy Individuals


|
||
References
If you find any error in data or bug in web service, please kindly report it to Dr. Sun and Dr. Yu.
