Molecule Information
General Information of the Molecule (ID: Mol01268)
| Name |
NR2F1 antisense RNA 1 (NR2F1-AS1)
,Homo sapiens
|
||||
|---|---|---|---|---|---|
| Synonyms |
NR2F1-AS1
Click to Show/Hide
|
||||
| Molecule Type |
LncRNA
|
||||
| Gene Name |
LINC01458, lncRNA-AC130710
|
||||
| Gene ID | |||||
| Location |
chr5:93360779-93585649[-]
|
||||
| Ensembl ID | |||||
| HGNC ID | |||||
| Click to Show/Hide the Complete Species Lineage | |||||
Type(s) of Resistant Mechanism of This Molecule
 EADR: Epigenetic Alteration of DNA, RNA or Protein
Drug Resistance Data Categorized by Drug
Approved Drug(s)
1 drug(s) in total
| Drug Resistance Data Categorized by Their Corresponding Mechanisms | ||||
|
Epigenetic Alteration of DNA, RNA or Protein (EADR)
|
||||
| Disease Class: Hepatocellular carcinoma [ICD-11: 2C12.2] | [1] | |||
| Resistant Disease | Hepatocellular carcinoma [ICD-11: 2C12.2] | |||
| Resistant Drug | Oxaliplatin | |||
| Molecule Alteration | Expression | Up-regulation |
||
| Differential expression of the molecule in resistant disease | ||||
| Classification of Disease | Liver cancer [ICD-11: 2C12] | |||
| The Specified Disease | Liver hepatocellular carcinoma | |||
| The Studied Tissue | Liver | |||
| The Expression Level of Disease Section Compare with the Healthy Individual Tissue | p-value: 1.95E-01 Fold-change: 1.56E-01 Z-score: 1.30E+00 |
|||
| Experimental Note | Revealed Based on the Cell Line Data | |||
| Cell Pathway Regulation | Cell apoptosis | Inhibition | hsa04210 | |
| Cell invasion | Activation | hsa05200 | ||
| Cell viability | Activation | hsa05200 | ||
| Epithelial mesenchymal transition signaling pathway | Activation | hsa01521 | ||
| NR2F1/AS1/miR363/ABCC1 signaling pathway | Regulation | N.A. | ||
| In Vitro Model | Huh-7 cells | Liver | Homo sapiens (Human) | CVCL_0336 |
| HepG2 cells | Liver | Homo sapiens (Human) | CVCL_0027 | |
| In Vivo Model | Nude mouse xenograft model | Mus musculus | ||
| Experiment for Molecule Alteration |
qRT-PCR | |||
| Experiment for Drug Resistance |
CCK8 assay; Transwell assay | |||
| Mechanism Description | Both NR2F1-AS1 and ABCC1 were up-regulated in oxaliplatin-resistant HCC cells,and miR-363 expression was increased in Huh7/OXA and HepG2/OXA cells transfected with NR2F1-AS1 siRNA compared to empty vector-transfected cells. | |||
Disease- and Tissue-specific Abundances of This Molecule
ICD Disease Classification 02

| Differential expression of molecule in resistant diseases | ||
| The Studied Tissue | Bile duct | |
| The Specified Disease | Cholangiocarcinoma | |
| The Expression Level of Disease Section Compare with the Healthy Individual Tissue | p-value: 9.17E-03; Fold-change: -2.36E-01 | |
|
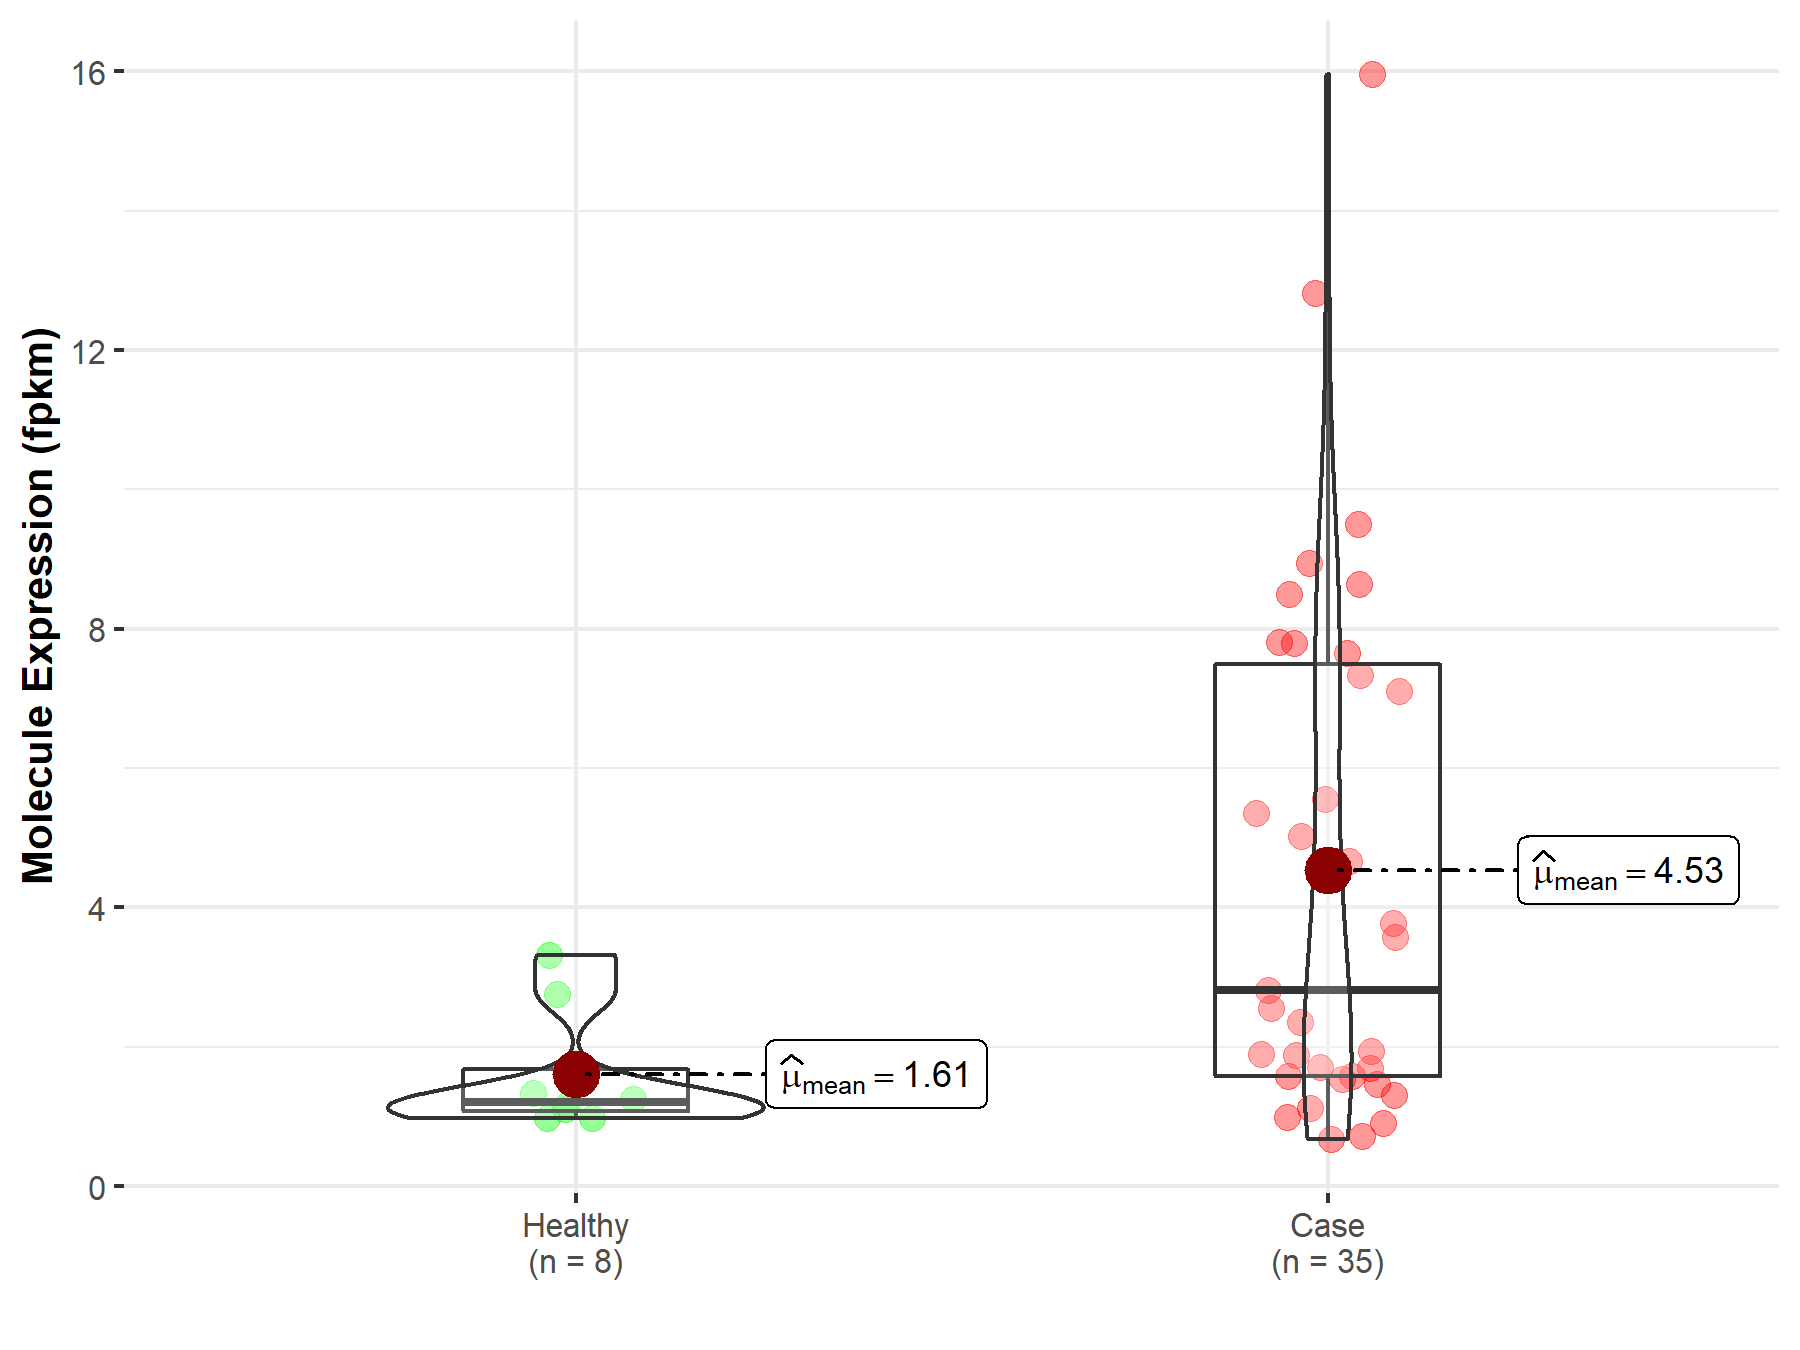
Molecule expression in the diseased tissue of patients
Molecule expression in the normal tissue of healthy individuals
|
||
| Disease-specific Molecule Abundances |
|
Click to View the Clearer Original Diagram |
| The Studied Tissue | Liver | |
| The Specified Disease | Liver hepatocellular carcinoma | |
| The Expression Level of Disease Section Compare with the Healthy Individual Tissue | p-value: 4.55E-01; Fold-change: 1.46E-02 | |
|
Molecule expression in the diseased tissue of patients
Molecule expression in the normal tissue of healthy individuals
|
||
| Disease-specific Molecule Abundances |

|
Click to View the Clearer Original Diagram |
Tissue-specific Molecule Abundances in Healthy Individuals

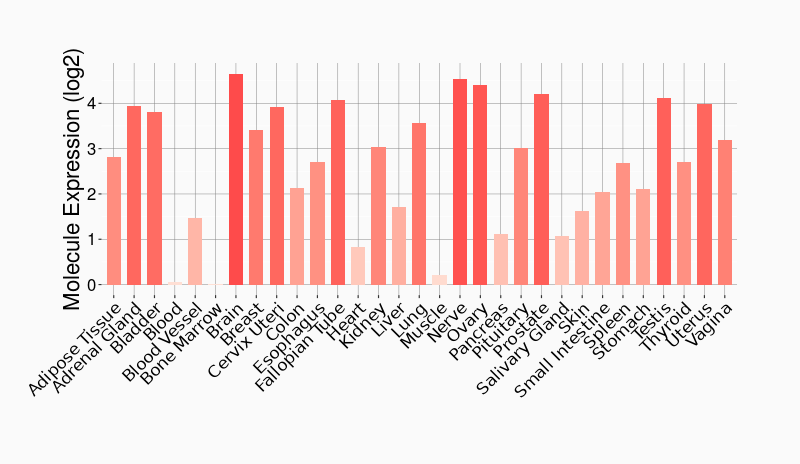
|
||
References
If you find any error in data or bug in web service, please kindly report it to Dr. Sun and Dr. Yu.