Molecule Information
General Information of the Molecule (ID: Mol01259)
| Name |
LncRNA regulator of Akt signaling associated with HCC and RCC (LNCARSR)
,Homo sapiens
|
||||
|---|---|---|---|---|---|
| Synonyms |
LNCARSR
Click to Show/Hide
|
||||
| Molecule Type |
LncRNA
|
||||
| Gene Name |
C7orf40, FLJ38860, Linc-Myo1g, MYO1GUT
|
||||
| Gene ID | |||||
| Location |
chr9:79505804-79567802[-]
|
||||
| Ensembl ID | |||||
| HGNC ID | |||||
| Click to Show/Hide the Complete Species Lineage | |||||
Type(s) of Resistant Mechanism of This Molecule
Drug Resistance Data Categorized by Drug
Approved Drug(s)
4 drug(s) in total
| Drug Resistance Data Categorized by Their Corresponding Mechanisms | ||||
|
|
||||
| Disease Class: Glioblastoma [ICD-11: 2A00.02] | [1] | |||
| Resistant Disease | Glioblastoma [ICD-11: 2A00.02] | |||
| Resistant Drug | Temozolomide | |||
| Molecule Alteration | Expression | Up-regulation |
||
| Differential expression of the molecule in resistant disease | ||||
| Classification of Disease | Brain cancer [ICD-11: 2A00] | |||
| The Specified Disease | Glioblastoma multiforme | |||
| The Studied Tissue | Brain | |||
| The Expression Level of Disease Section Compare with the Healthy Individual Tissue | p-value: 1.06E-05 Fold-change: 7.56E-01 Z-score: 4.51E+00 |
|||
| Experimental Note | Identified from the Human Clinical Data | |||
| Cell Pathway Regulation | Cell apoptosis | Inhibition | hsa04210 | |
| Cell proliferation | Activation | hsa05200 | ||
| c-Met signaling signaling pathway | Inhibition | hsa01521 | ||
| In Vitro Model | HG7 cells | Brain | Homo sapiens (Human) | N.A. |
| LN229 cells | Brain | Homo sapiens (Human) | CVCL_0393 | |
| In Vivo Model | BALB/c nude mouse xenograft model | Mus musculus | ||
| Experiment for Molecule Alteration |
qRT-PCR | |||
| Experiment for Drug Resistance |
CCK8 assay; Colony formation assay; Flow cytometry assay | |||
| Mechanism Description | Lnc-TALC promotes O6-methylguanine-DNA methyltransferase expression via regulating the c-Met pathway by competitively binding with miR-20b-3p. | |||
| Drug Resistance Data Categorized by Their Corresponding Mechanisms | ||||
|
|
||||
| Disease Class: Hepatocellular carcinoma [ICD-11: 2C12.2] | [2] | |||
| Resistant Disease | Hepatocellular carcinoma [ICD-11: 2C12.2] | |||
| Resistant Drug | Doxorubicin | |||
| Molecule Alteration | Expression | Up-regulation |
||
| Differential expression of the molecule in resistant disease | ||||
| Classification of Disease | Liver cancer [ICD-11: 2C12] | |||
| The Specified Disease | Liver hepatocellular carcinoma | |||
| The Studied Tissue | Liver | |||
| The Expression Level of Disease Section Compare with the Healthy Individual Tissue | p-value: 5.01E-01 Fold-change: 3.08E-01 Z-score: 6.79E-01 |
|||
| Experimental Note | Revealed Based on the Cell Line Data | |||
| Cell Pathway Regulation | PI3K/AKT signaling pathway | Activation | hsa04151 | |
| In Vitro Model | HepG2 cells | Liver | Homo sapiens (Human) | CVCL_0027 |
| SMMC7721 cells | Uterus | Homo sapiens (Human) | CVCL_0534 | |
| In Vivo Model | Nude mouse xenograft model | Mus musculus | ||
| Experiment for Molecule Alteration |
qPCR | |||
| Experiment for Drug Resistance |
TUNEL assays | |||
| Mechanism Description | lncARSR physically associates with PTEN mRNA, promotes PTEN mRNA degradation, decreases PTEN expression, and activates PI3k/Akt pathway. Upregulated lncARSR promotes doxorubicin resistance in HCC via modulating PTEN-PI3k/Akt pathway. | |||
| Drug Sensitivity Data Categorized by Their Corresponding Mechanisms | ||||
|
|
||||
| Disease Class: Liver cancer [ICD-11: 2C12.6] | [3] | |||
| Sensitive Disease | Liver cancer [ICD-11: 2C12.6] | |||
| Sensitive Drug | Sorafenib | |||
| Molecule Alteration | Expression | Down-regulation |
||
| Experimental Note | Revealed Based on the Cell Line Data | |||
| Cell Pathway Regulation | Cell apoptosis | Activation | hsa04210 | |
| Cell viability | Inhibition | hsa05200 | ||
| STAT3 signaling pathway | Inhibition | hsa04550 | ||
| In Vitro Model | HCCLM3 cells | Liver | Homo sapiens (Human) | CVCL_6832 |
| SMMC7721 cells | Uterus | Homo sapiens (Human) | CVCL_0534 | |
| In Vivo Model | NOD-SCID mouse xenograft model | Mus musculus | ||
| Experiment for Molecule Alteration |
RT-PCR | |||
| Experiment for Drug Resistance |
CCK8 assay; Flow cytometry assay | |||
| Mechanism Description | Interference lncARSR suppressed liver CSCs expansion and the phosphorylation of the STAT3 molecule was evidently inactivated in both the SMMC7721 si-lncARSR and HCCLM3 si-lncARSR cells. | |||
| Drug Resistance Data Categorized by Their Corresponding Mechanisms | ||||
|
|
||||
| Disease Class: Renal cell carcinoma [ICD-11: 2C90.0] | [4] | |||
| Resistant Disease | Renal cell carcinoma [ICD-11: 2C90.0] | |||
| Resistant Drug | Sunitinib | |||
| Molecule Alteration | Expression | Up-regulation |
||
| Experimental Note | Identified from the Human Clinical Data | |||
| Cell Pathway Regulation | Cell apoptosis | Inhibition | hsa04210 | |
| Cell proliferation | Activation | hsa05200 | ||
| ERK signaling pathway | Regulation | N.A. | ||
| STAT3/AKT signaling pathway | Regulation | N.A. | ||
| In Vitro Model | 771R-luc cells | Kidney | Homo sapiens (Human) | N.A. |
| Experiment for Molecule Alteration |
qPCR; Northern blot analysis | |||
| Experiment for Drug Resistance |
CCK8 assay | |||
| Mechanism Description | Exosome-Transmitted lncARSR Promotes Sunitinib Resistance in Renal Cancer by Acting as a Competing Endogenous RNA. Here we identified an LncRNA, named lncARSR (LncRNA Activated in RCC with Sunitinib Resistance), which correlated with clinically poor sunitinib response. lncARSR promoted sunitinib resistance via competitively binding miR-34/miR-449 to facilitate AXL and c-MET expression in RCC cells. Furthermore, bioactive lncARSR could be incorporated into exosomes and transmitted to sensitive cells, thus disseminating sunitinib resistance. Treatment of sunitinib-resistant RCC with locked nucleic acids targeting lncARSR or an AXL/c-MET inhibitor restored sunitinib response. | |||
Disease- and Tissue-specific Abundances of This Molecule
ICD Disease Classification 02

| Differential expression of molecule in resistant diseases | ||
| The Studied Tissue | Brain | |
| The Specified Disease | Brain lower grade glioma | |
| The Expression Level of Disease Section Compare with the Healthy Individual Tissue | p-value: 1.44E-01; Fold-change: 6.33E-02 | |
|
Molecule expression in the diseased tissue of patients
Molecule expression in the normal tissue of healthy individuals
|
||
| Disease-specific Molecule Abundances |

|
Click to View the Clearer Original Diagram |
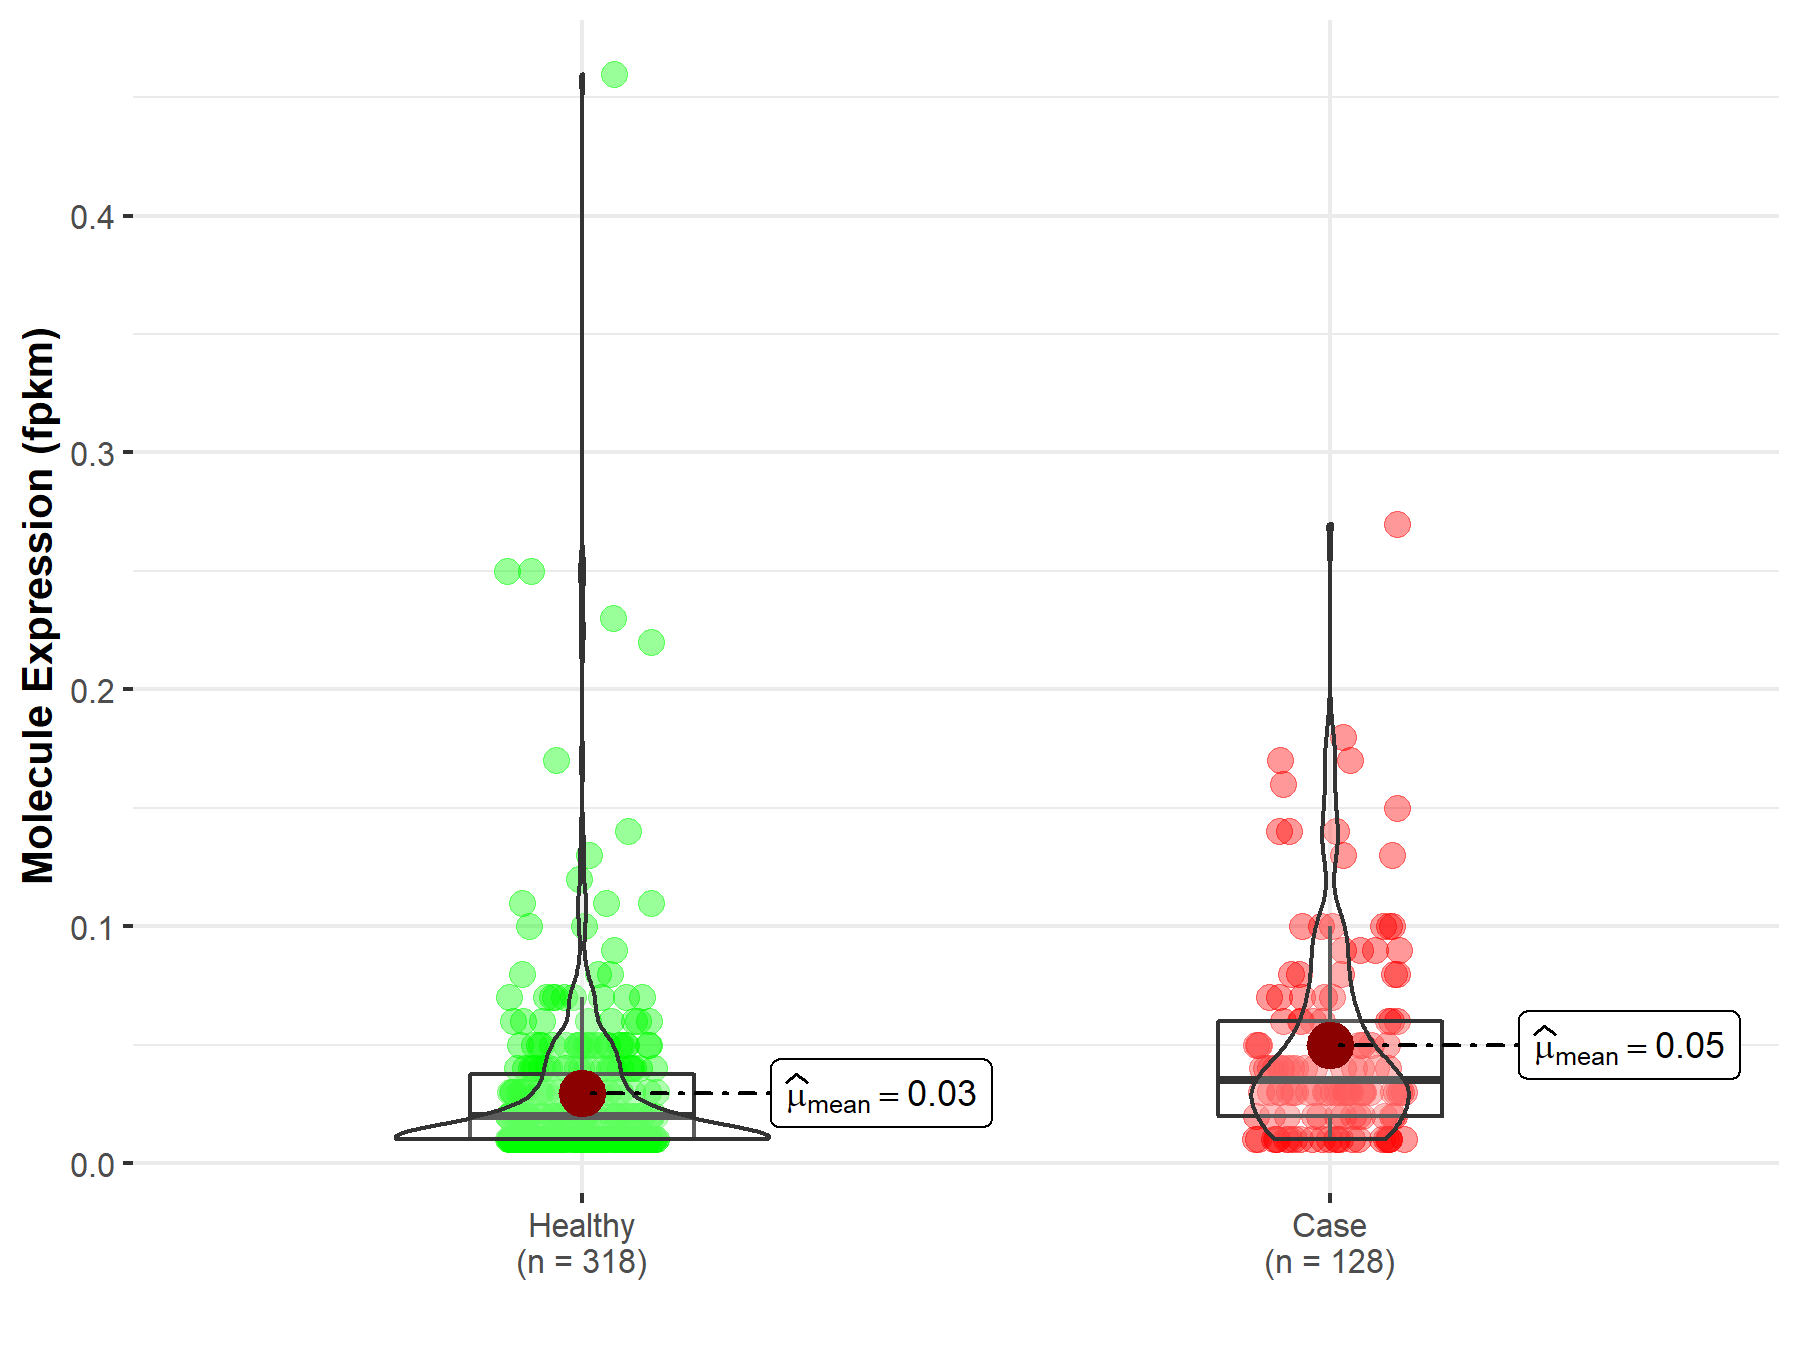
| The Studied Tissue | Brain | |
| The Specified Disease | Glioblastoma multiforme | |
| The Expression Level of Disease Section Compare with the Healthy Individual Tissue | p-value: 5.30E-07; Fold-change: -2.33E-01 | |
|
Molecule expression in the diseased tissue of patients
Molecule expression in the normal tissue of healthy individuals
|
||
| Disease-specific Molecule Abundances |

|
Click to View the Clearer Original Diagram |
| Differential expression of molecule in resistant diseases | ||
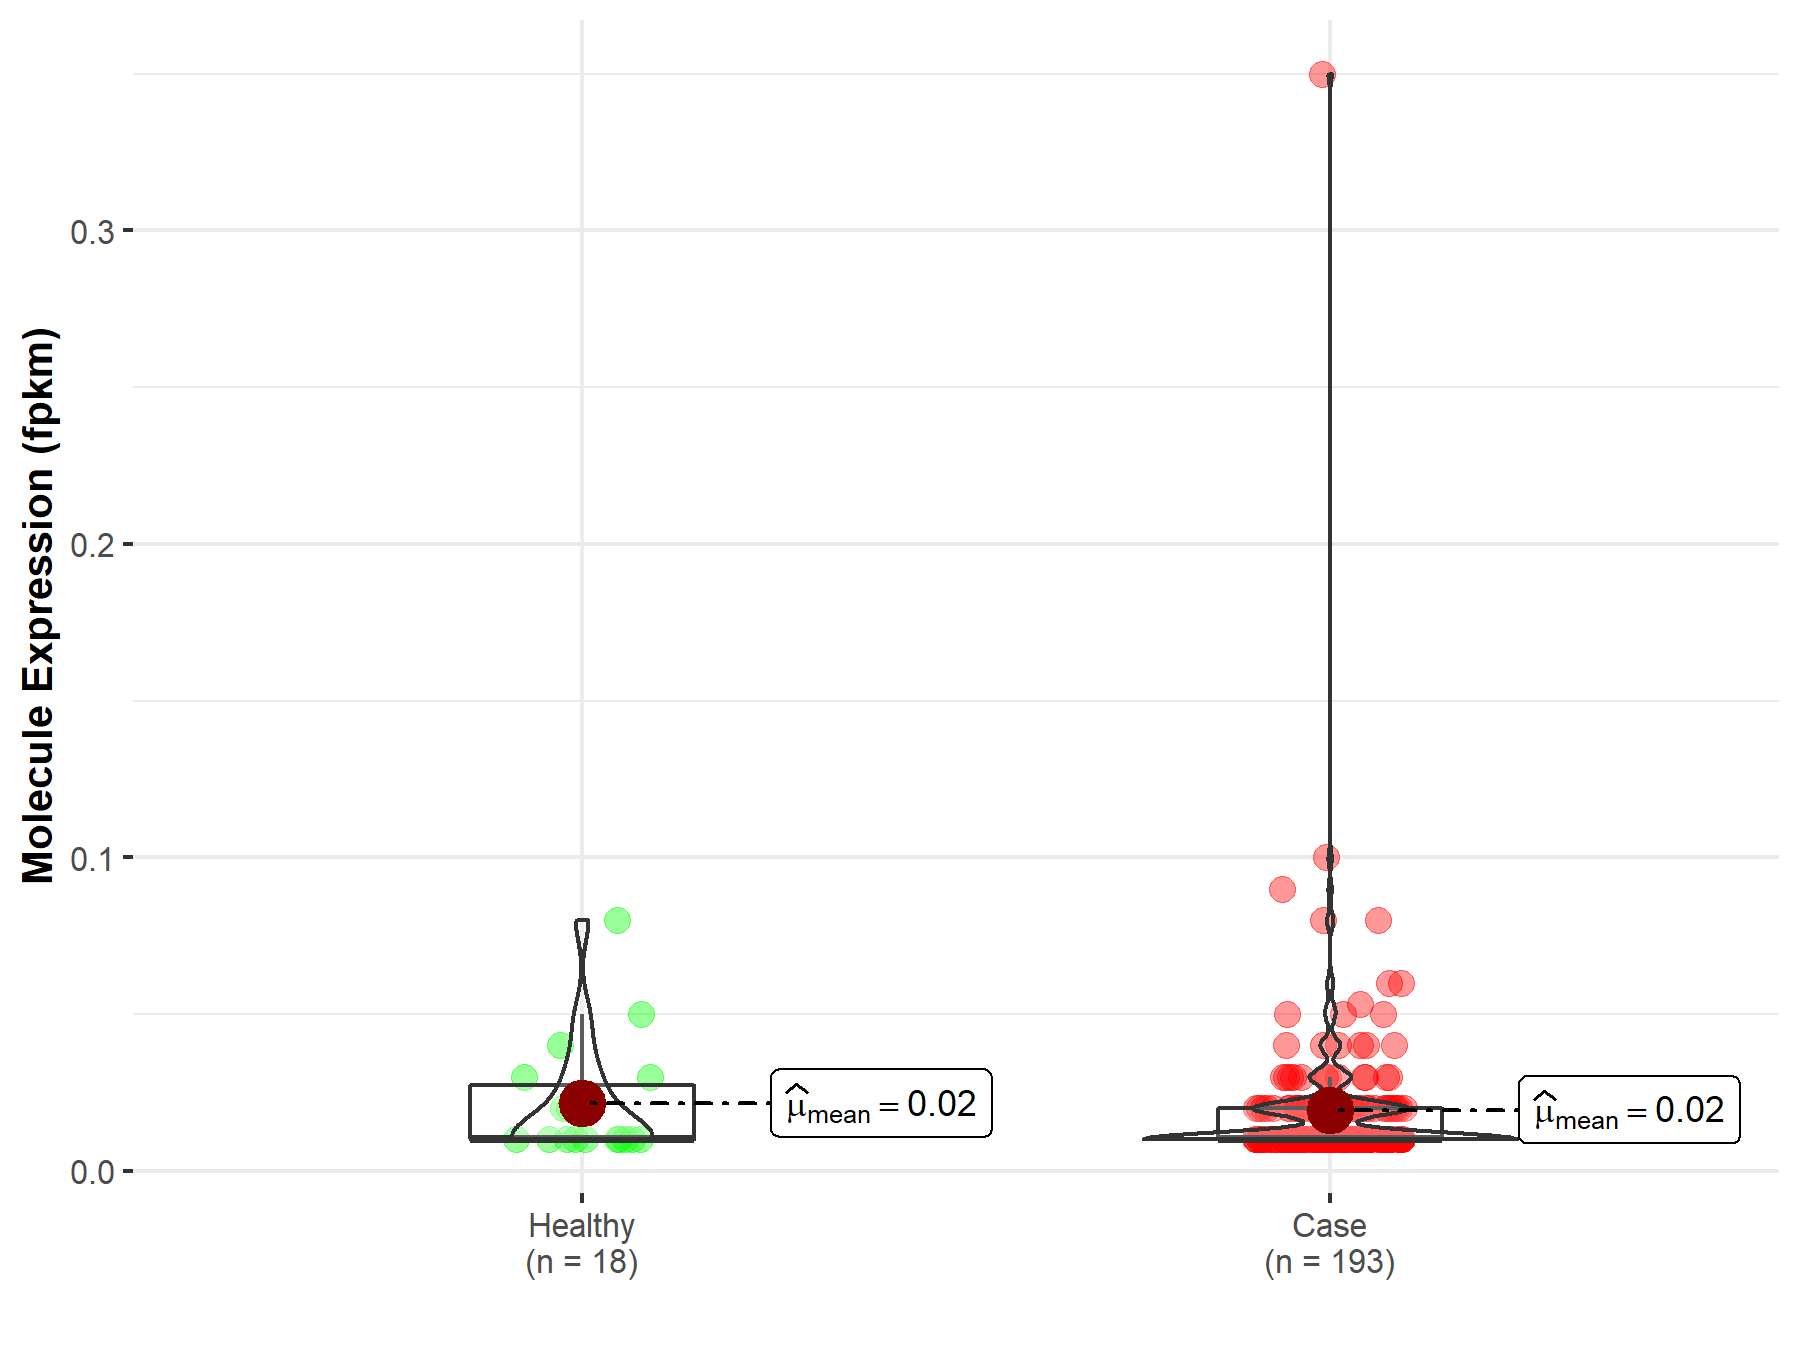
| The Studied Tissue | Liver | |
| The Specified Disease | Liver hepatocellular carcinoma | |
| The Expression Level of Disease Section Compare with the Healthy Individual Tissue | p-value: 7.27E-01; Fold-change: -5.60E-02 | |
|
Molecule expression in the diseased tissue of patients
Molecule expression in the normal tissue of healthy individuals
|
||
| Disease-specific Molecule Abundances |

|
Click to View the Clearer Original Diagram |
| Differential expression of molecule in resistant diseases | ||
| The Studied Tissue | Kidney | |
| The Specified Disease | Kidney clear cell carcinoma | |
| The Expression Level of Disease Section Compare with the Healthy Individual Tissue | p-value: 2.63E-01; Fold-change: 1.31E-01 | |
|
Molecule expression in the diseased tissue of patients
Molecule expression in the normal tissue of healthy individuals
|
||
| Disease-specific Molecule Abundances |

|
Click to View the Clearer Original Diagram |
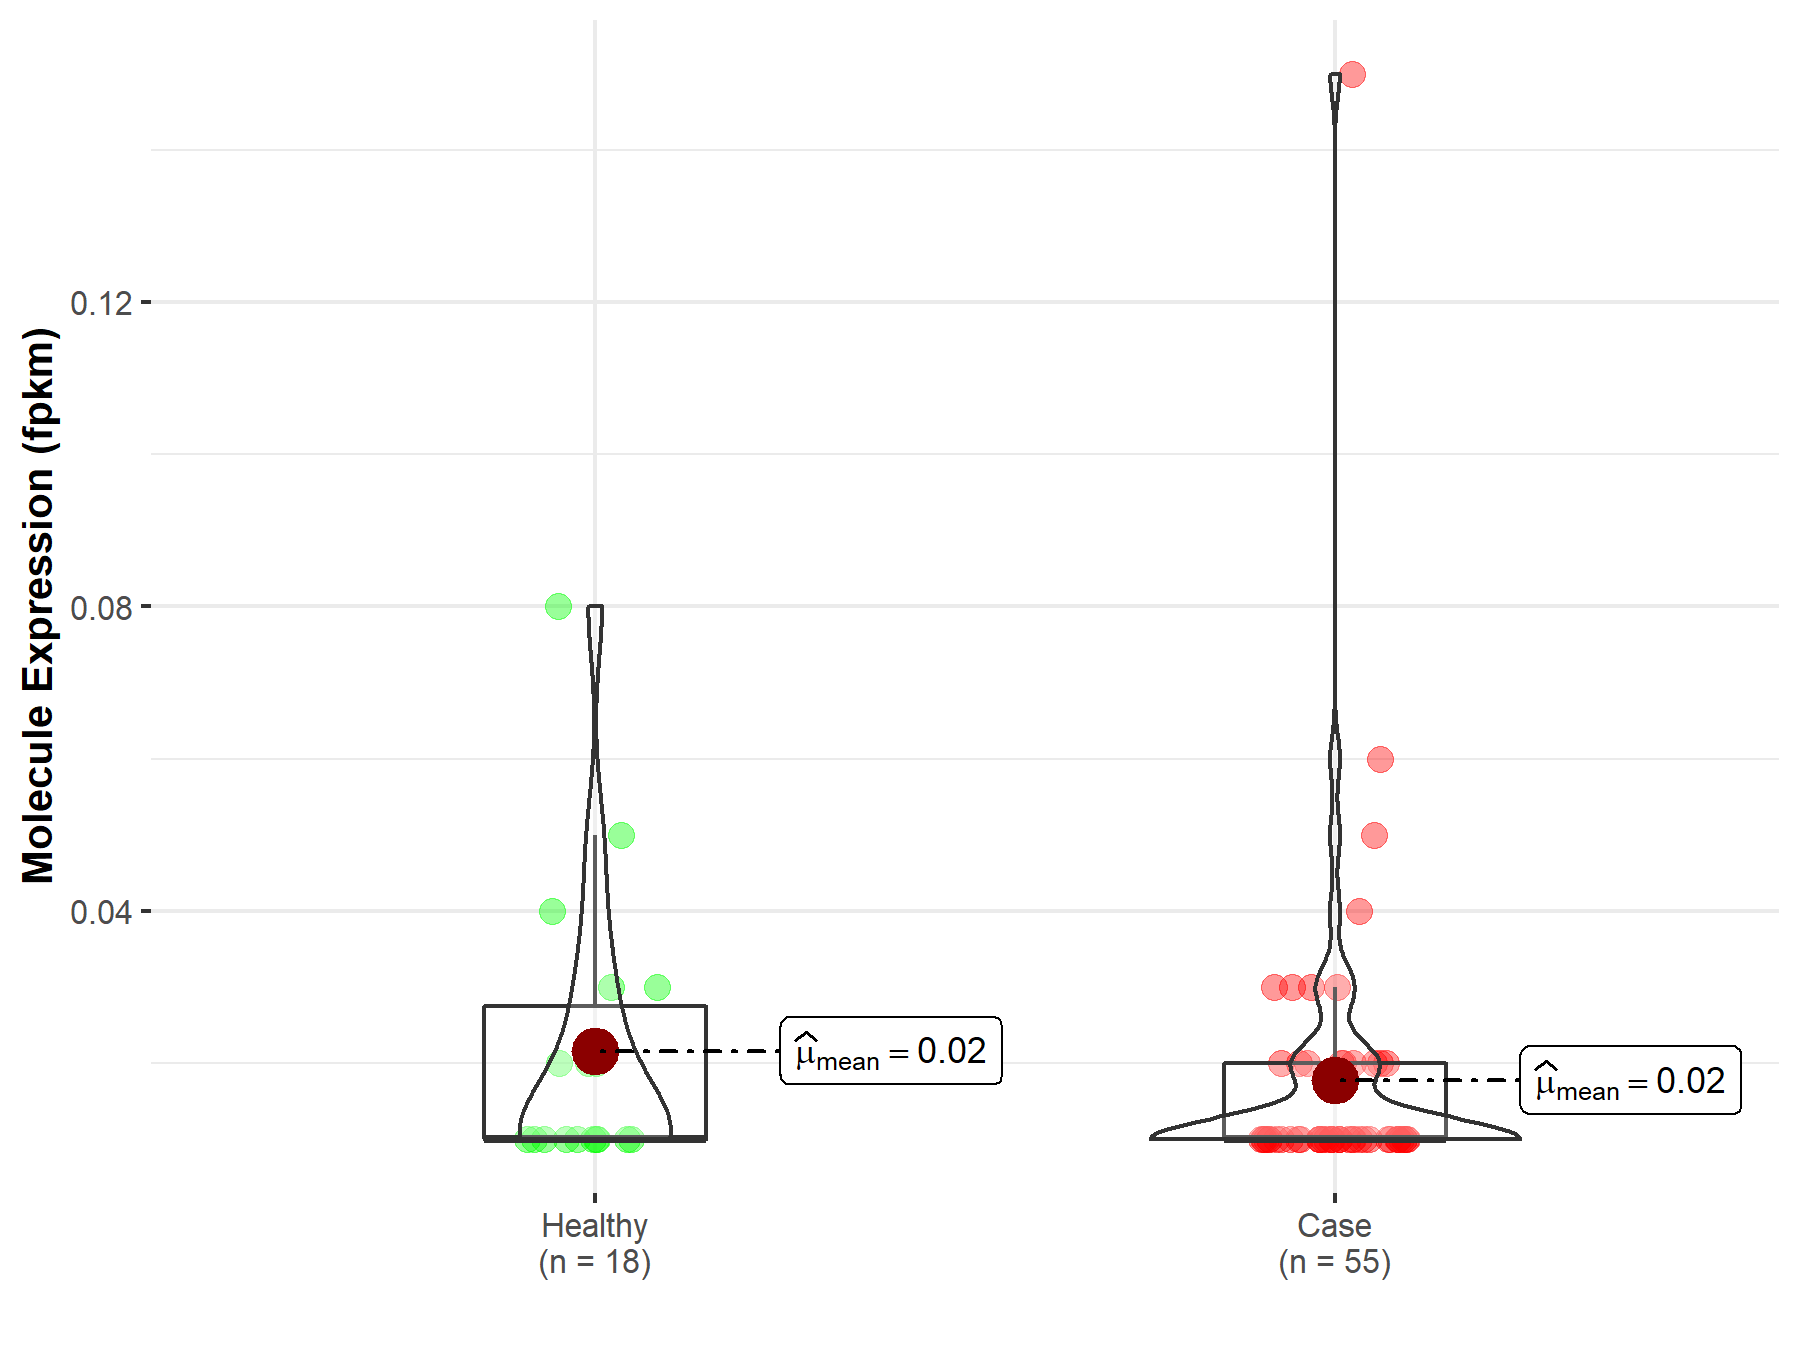
| The Studied Tissue | Kidney | |
| The Specified Disease | Kidney papillary cell carcinoma | |
| The Expression Level of Disease Section Compare with the Healthy Individual Tissue | p-value: 1.63E-01; Fold-change: 1.62E-01 | |
|
Molecule expression in the diseased tissue of patients
Molecule expression in the normal tissue of healthy individuals
|
||
| Disease-specific Molecule Abundances |

|
Click to View the Clearer Original Diagram |
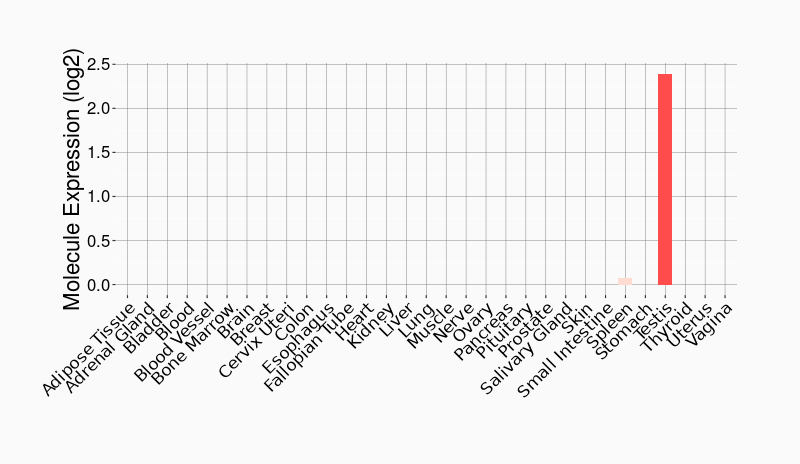
Tissue-specific Molecule Abundances in Healthy Individuals


|
||
References
If you find any error in data or bug in web service, please kindly report it to Dr. Sun and Dr. Yu.
