Molecule Information
General Information of the Molecule (ID: Mol01214)
| Name |
Long non-protein coding RNA 1116 (LINC01116)
,Homo sapiens
|
||||
|---|---|---|---|---|---|
| Synonyms |
LINC01116
Click to Show/Hide
|
||||
| Molecule Type |
LncRNA
|
||||
| Gene Name |
CCTalpha, CT, CTPCT, PCYT1
|
||||
| Gene ID | |||||
| Location |
chr2:176611464-176637931[-]
|
||||
| Ensembl ID | |||||
| HGNC ID | |||||
| Click to Show/Hide the Complete Species Lineage | |||||
Type(s) of Resistant Mechanism of This Molecule
Drug Resistance Data Categorized by Drug
Approved Drug(s)
1 drug(s) in total
| Drug Resistance Data Categorized by Their Corresponding Mechanisms | ||||
|
|
||||
| Disease Class: Prostate cancer [ICD-11: 2C82.0] | [1] | |||
| Resistant Disease | Prostate cancer [ICD-11: 2C82.0] | |||
| Resistant Drug | Sulforaphane | |||
| Molecule Alteration | Expression | Up-regulation |
||
| Experimental Note | Revealed Based on the Cell Line Data | |||
| Cell Pathway Regulation | Cell proliferation | Activation | hsa05200 | |
| In Vitro Model | LNCaP cells | Prostate | Homo sapiens (Human) | CVCL_0395 |
| PC3 cells | Prostate | Homo sapiens (Human) | CVCL_0035 | |
| Experiment for Molecule Alteration |
Sequencing assay; qRT-PCR | |||
| Experiment for Drug Resistance |
Cell proliferation assay | |||
| Mechanism Description | Knockdown of LINC01116 with siRNA decreased proliferation of prostate cancer cells, and significantly upregulated several genes including GAPDH (regulates glycolysis), MAP1LC3B2 (autophagy) and H2AFY (chromatin structure) and LncRNA LINC01116 is upregulated in a human prostate cancer cell line, is decreased by SFN treatment, and promotes cell proliferation in a human cancer cell line. | |||
Disease- and Tissue-specific Abundances of This Molecule
ICD Disease Classification 02

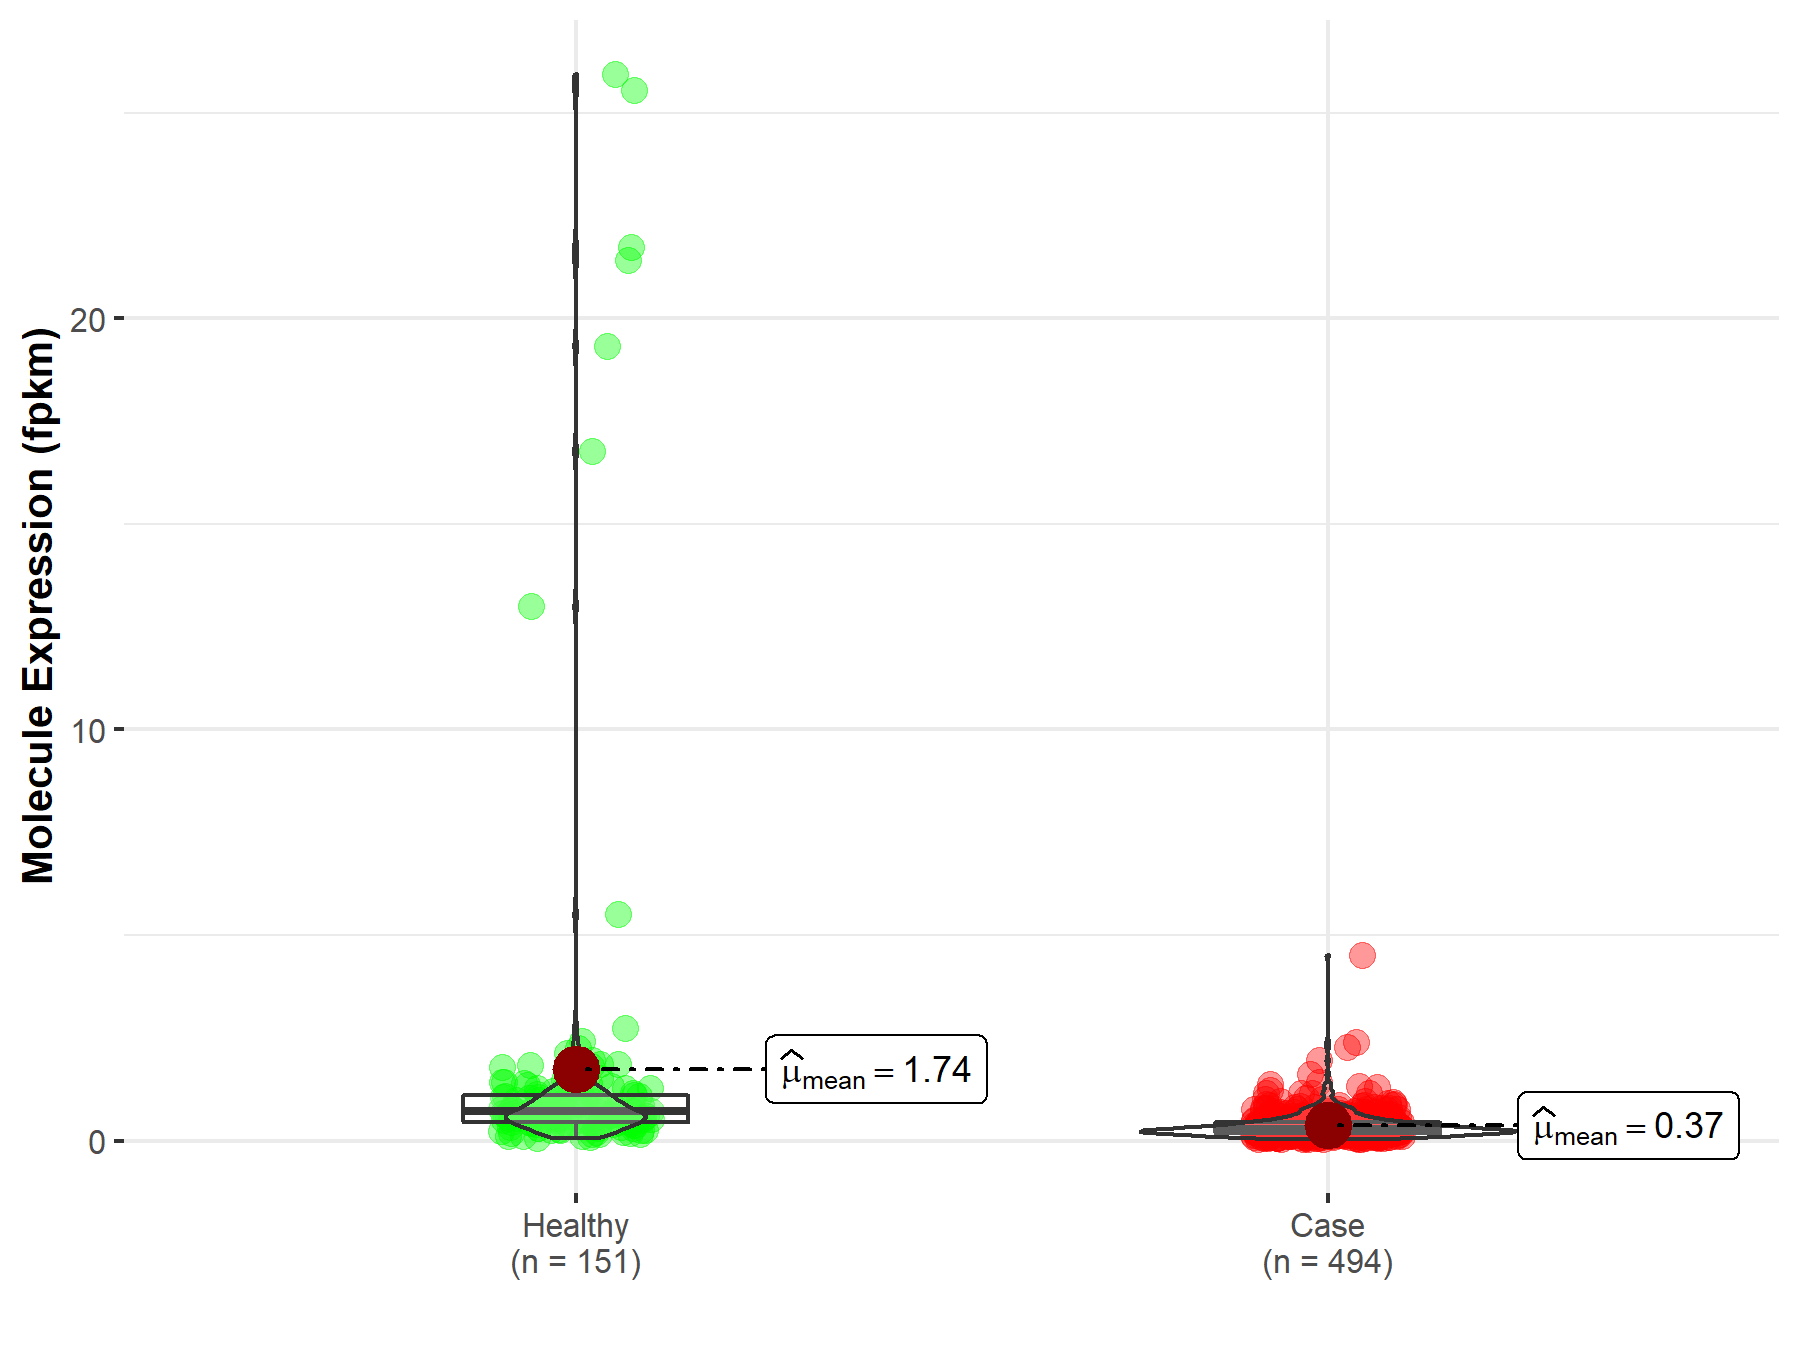
| Differential expression of molecule in resistant diseases | ||
| The Studied Tissue | Prostate | |
| The Specified Disease | Prostate adenocarcinoma | |
| The Expression Level of Disease Section Compare with the Healthy Individual Tissue | p-value: 1.35E-31; Fold-change: 3.59E-01 | |
|
Molecule expression in the diseased tissue of patients
Molecule expression in the normal tissue of healthy individuals
|
||
| Disease-specific Molecule Abundances |

|
Click to View the Clearer Original Diagram |
Tissue-specific Molecule Abundances in Healthy Individuals


|
||
References
If you find any error in data or bug in web service, please kindly report it to Dr. Sun and Dr. Yu.
