Molecule Information
General Information of the Molecule (ID: Mol00979)
| Name |
Isocitrate dehydrogenase NAD 3 alpha (IDH3A)
,Homo sapiens
|
||||
|---|---|---|---|---|---|
| Synonyms |
Isocitric dehydrogenase subunit alpha; NAD(+)-specific ICDH subunit alpha
Click to Show/Hide
|
||||
| Molecule Type |
Protein
|
||||
| Gene Name |
IDH3A
|
||||
| Gene ID | |||||
| Location |
chr15:78131498-78171945[+]
|
||||
| Sequence |
MAGPAWISKVSRLLGAFHNPKQVTRGFTGGVQTVTLIPGDGIGPEISAAVMKIFDAAKAP
IQWEERNVTAIQGPGGKWMIPSEAKESMDKNKMGLKGPLKTPIAAGHPSMNLLLRKTFDL YANVRPCVSIEGYKTPYTDVNIVTIRENTEGEYSGIEHVIVDGVVQSIKLITEGASKRIA EFAFEYARNNHRSNVTAVHKANIMRMSDGLFLQKCREVAESCKDIKFNEMYLDTVCLNMV QDPSQFDVLVMPNLYGDILSDLCAGLIGGLGVTPSGNIGANGVAIFESVHGTAPDIAGKD MANPTALLLSAVMMLRHMGLFDHAARIEAACFATIKDGKSLTKDLGGNAKCSDFTEEICR RVKDLD Click to Show/Hide
|
||||
| 3D-structure |
|
||||
| Function |
Catalytic subunit of the enzyme which catalyzes the decarboxylation of isocitrate (ICT) into alpha-ketoglutarate. The heterodimer composed of the alpha (IDH3A) and beta (IDH3B) subunits and the heterodimer composed of the alpha (IDH3A) and gamma (IDH3G) subunits, have considerable basal activity but the full activity of the heterotetramer (containing two subunits of IDH3A, one of IDH3B and one of IDH3G) requires the assembly and cooperative function of both heterodimers.
Click to Show/Hide
|
||||
| Uniprot ID | |||||
| Ensembl ID | |||||
| HGNC ID | |||||
| Click to Show/Hide the Complete Species Lineage | |||||
Type(s) of Resistant Mechanism of This Molecule
Drug Resistance Data Categorized by Drug
Approved Drug(s)
2 drug(s) in total
| Drug Sensitivity Data Categorized by Their Corresponding Mechanisms | ||||
|
|
||||
| Disease Class: Liver cancer [ICD-11: 2C12.6] | [1] | |||
| Sensitive Disease | Liver cancer [ICD-11: 2C12.6] | |||
| Sensitive Drug | Methotrexate | |||
| Molecule Alteration | Expression | Down-regulation |
||
| Differential expression of the molecule in resistant disease | ||||
| Classification of Disease | Liver cancer [ICD-11: 2C12] | |||
| The Specified Disease | Liver cancer | |||
| The Studied Tissue | Liver tissue | |||
| The Expression Level of Disease Section Compare with the Healthy Individual Tissue | p-value: 6.42E-01 Fold-change: -9.83E-03 Z-score: -4.67E-01 |
|||
| Experimental Note | Revealed Based on the Cell Line Data | |||
| Cell Pathway Regulation | Cell proliferation | Inhibition | hsa05200 | |
| In Vitro Model | HepG2 cells | Liver | Homo sapiens (Human) | CVCL_0027 |
| Experiment for Molecule Alteration |
Western blot analysis | |||
| Experiment for Drug Resistance |
MTT assay | |||
| Mechanism Description | Curcumin mediated the amputation of chemoresistance by repressing the hyperglycolytic behavior of malignant cells via modulated expression of metabolic enzymes (HkII, PFk1, GAPDH, PkM2, LDH, SDH, IDH, and FASN), transporters (GLUT-1, MCT-1, and MCT-4), and their regulators. Along altered constitution of extracellular milieu, these molecular changes culminated into improved drug accumulation, chromatin condensation, and induction of cell death. | |||
| Drug Sensitivity Data Categorized by Their Corresponding Mechanisms | ||||
|
|
||||
| Disease Class: Liver cancer [ICD-11: 2C12.6] | [1] | |||
| Sensitive Disease | Liver cancer [ICD-11: 2C12.6] | |||
| Sensitive Drug | Doxorubicin | |||
| Molecule Alteration | Expression | Down-regulation |
||
| Experimental Note | Revealed Based on the Cell Line Data | |||
| Cell Pathway Regulation | Cell proliferation | Inhibition | hsa05200 | |
| In Vitro Model | HepG2 cells | Liver | Homo sapiens (Human) | CVCL_0027 |
| Experiment for Molecule Alteration |
Western blot analysis | |||
| Experiment for Drug Resistance |
MTT assay | |||
| Mechanism Description | Curcumin mediated the amputation of chemoresistance by repressing the hyperglycolytic behavior of malignant cells via modulated expression of metabolic enzymes (HkII, PFk1, GAPDH, PkM2, LDH, SDH, IDH, and FASN), transporters (GLUT-1, MCT-1, and MCT-4), and their regulators. Along altered constitution of extracellular milieu, these molecular changes culminated into improved drug accumulation, chromatin condensation, and induction of cell death. | |||
Disease- and Tissue-specific Abundances of This Molecule
ICD Disease Classification 02

| Differential expression of molecule in resistant diseases | ||
| The Studied Tissue | Liver | |
| The Specified Disease | Liver cancer | |
| The Expression Level of Disease Section Compare with the Healthy Individual Tissue | p-value: 6.42E-01; Fold-change: 1.01E-01; Z-score: 1.64E-01 | |
| The Expression Level of Disease Section Compare with the Adjacent Tissue | p-value: 5.61E-03; Fold-change: -1.56E-01; Z-score: -2.89E-01 | |
| The Expression Level of Disease Section Compare with the Other Disease Section | p-value: 1.74E-01; Fold-change: -1.84E-01; Z-score: -5.43E-01 | |
|
Molecule expression in the normal tissue adjacent to the diseased tissue of patients
Molecule expression in the diseased tissue of patients
Molecule expression in the normal tissue of healthy individuals
Molecule expression in tissue other than the diseased tissue of patients
|
||
| Disease-specific Molecule Abundances |

|
Click to View the Clearer Original Diagram |
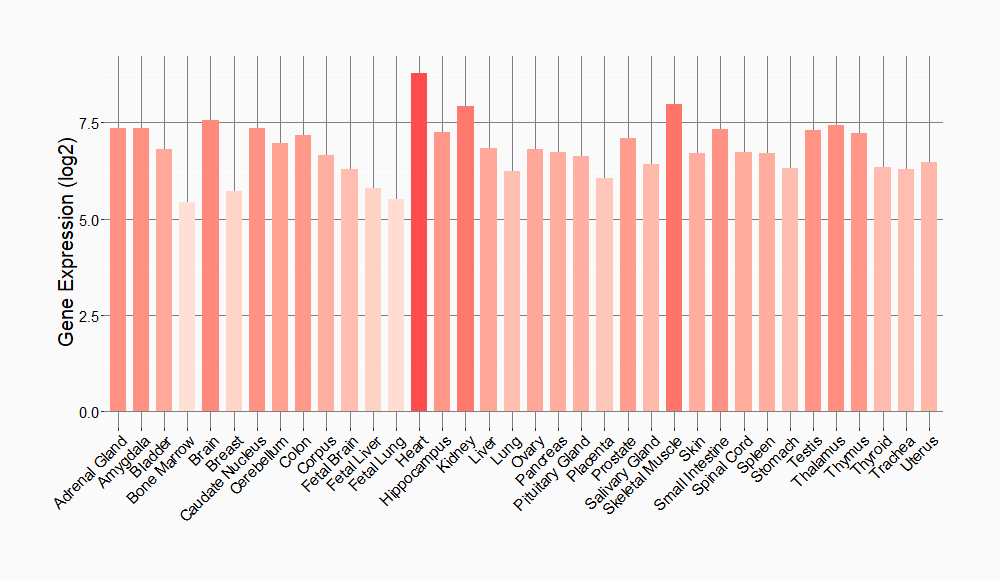
Tissue-specific Molecule Abundances in Healthy Individuals


|
||
References
If you find any error in data or bug in web service, please kindly report it to Dr. Sun and Dr. Yu.
