Molecule Information
General Information of the Molecule (ID: Mol00712)
| Name |
DNA repair protein XRCC4 (XRCC4)
,Homo sapiens
|
||||
|---|---|---|---|---|---|
| Synonyms |
hXRCC4; X-ray repair cross-complementing protein 4; XRCC4/C
Click to Show/Hide
|
||||
| Molecule Type |
Protein
|
||||
| Gene Name |
XRCC4
|
||||
| Gene ID | |||||
| Location |
chr5:83077498-83353787[+]
|
||||
| Sequence |
MERKISRIHLVSEPSITHFLQVSWEKTLESGFVITLTDGHSAWTGTVSESEISQEADDMA
MEKGKYVGELRKALLSGAGPADVYTFNFSKESCYFFFEKNLKDVSFRLGSFNLEKVENPA EVIRELICYCLDTIAENQAKNEHLQKENERLLRDWNDVQGRFEKCVSAKEALETDLYKRF ILVLNEKKTKIRSLHNKLLNAAQEREKDIKQEGETAICSEMTADRDPVYDESTDEESENQ TDLSGLASAAVSKDDSIISSLDVTDIAPSRKRRQRMQRNLGTEPKMAPQENQLQEKENSR PDSSLPETSKKEHISAENMSLETLRNSSPEDLFDEI Click to Show/Hide
|
||||
| 3D-structure |
|
||||
| Function |
[DNA repair protein XRCC4]: DNA non-homologous end joining (NHEJ) core factor, required for double-strand break repair and V(D)J recombination. Acts as a scaffold protein that regulates recruitment of other proteins to DNA double-strand breaks (DSBs). Associates with NHEJ1/XLF to form alternating helical filaments that bridge DNA and act like a bandage, holding together the broken DNA until it is repaired. The XRCC4-NHEJ1/XLF subcomplex binds to the DNA fragments of a DSB in a highly diffusive manner and robustly bridges two independent DNA molecules, holding the broken DNA fragments in close proximity to one other. The mobility of the bridges ensures that the ends remain accessible for further processing by other repair factors. Plays a key role in the NHEJ ligation step of the broken DNA during DSB repair via direct interaction with DNA ligase IV (LIG4): the LIG4-XRCC4 subcomplex reseals the DNA breaks after the gap filling is completed. XRCC4 stabilizes LIG4, regulates its subcellular localization and enhances LIG4's joining activity. Binding of the LIG4-XRCC4 subcomplex to DNA ends is dependent on the assembly of the DNA-dependent protein kinase complex DNA-PK to these DNA ends. Promotes displacement of PNKP from processed strand break termini.
Click to Show/Hide
|
||||
| Uniprot ID | |||||
| Ensembl ID | |||||
| HGNC ID | |||||
| Click to Show/Hide the Complete Species Lineage | |||||
Type(s) of Resistant Mechanism of This Molecule
Drug Resistance Data Categorized by Drug
Approved Drug(s)
1 drug(s) in total
| Drug Resistance Data Categorized by Their Corresponding Mechanisms | ||||
|
|
||||
| Disease Class: Glioblastoma [ICD-11: 2A00.02] | [1] | |||
| Resistant Disease | Glioblastoma [ICD-11: 2A00.02] | |||
| Resistant Drug | Temozolomide | |||
| Molecule Alteration | Expression | Up-regulation |
||
| Differential expression of the molecule in resistant disease | ||||
| Classification of Disease | Brain cancer [ICD-11: 2A00] | |||
| The Specified Disease | Brain cancer | |||
| The Studied Tissue | Nervous tissue | |||
| The Expression Level of Disease Section Compare with the Healthy Individual Tissue | p-value: 5.31E-104 Fold-change: 1.22E-01 Z-score: 2.42E+01 |
|||
| Experimental Note | Identified from the Human Clinical Data | |||
| Cell Pathway Regulation | Cell apoptosis | Inhibition | hsa04210 | |
| Cell colony | Activation | hsa05200 | ||
| Cell viability | Activation | hsa05200 | ||
| In Vitro Model | U251 cells | Brain | Homo sapiens (Human) | CVCL_0021 |
| LN229 cells | Brain | Homo sapiens (Human) | CVCL_0393 | |
| A172 cells | Brain | Homo sapiens (Human) | CVCL_0131 | |
| U87 cells | Brain | Homo sapiens (Human) | CVCL_0022 | |
| T98G cells | Brain | Homo sapiens (Human) | CVCL_0556 | |
| In Vivo Model | Nude mouse xenograft model | Mus musculus | ||
| Experiment for Molecule Alteration |
Western blot analysis | |||
| Experiment for Drug Resistance |
CCK8 assay; Flow cytometry assay | |||
| Mechanism Description | Inhibiting miR-151a leads to increased XRCC4 levels, resulting in activated DNA repair and subsequent resistance to TMZ. | |||
Disease- and Tissue-specific Abundances of This Molecule
ICD Disease Classification 02

| Differential expression of molecule in resistant diseases | ||
| The Studied Tissue | Nervous tissue | |
| The Specified Disease | Brain cancer | |
| The Expression Level of Disease Section Compare with the Healthy Individual Tissue | p-value: 5.31E-104; Fold-change: 4.16E-01; Z-score: 1.53E+00 | |
|
Molecule expression in the diseased tissue of patients
Molecule expression in the normal tissue of healthy individuals
|
||
| Disease-specific Molecule Abundances |

|
Click to View the Clearer Original Diagram |
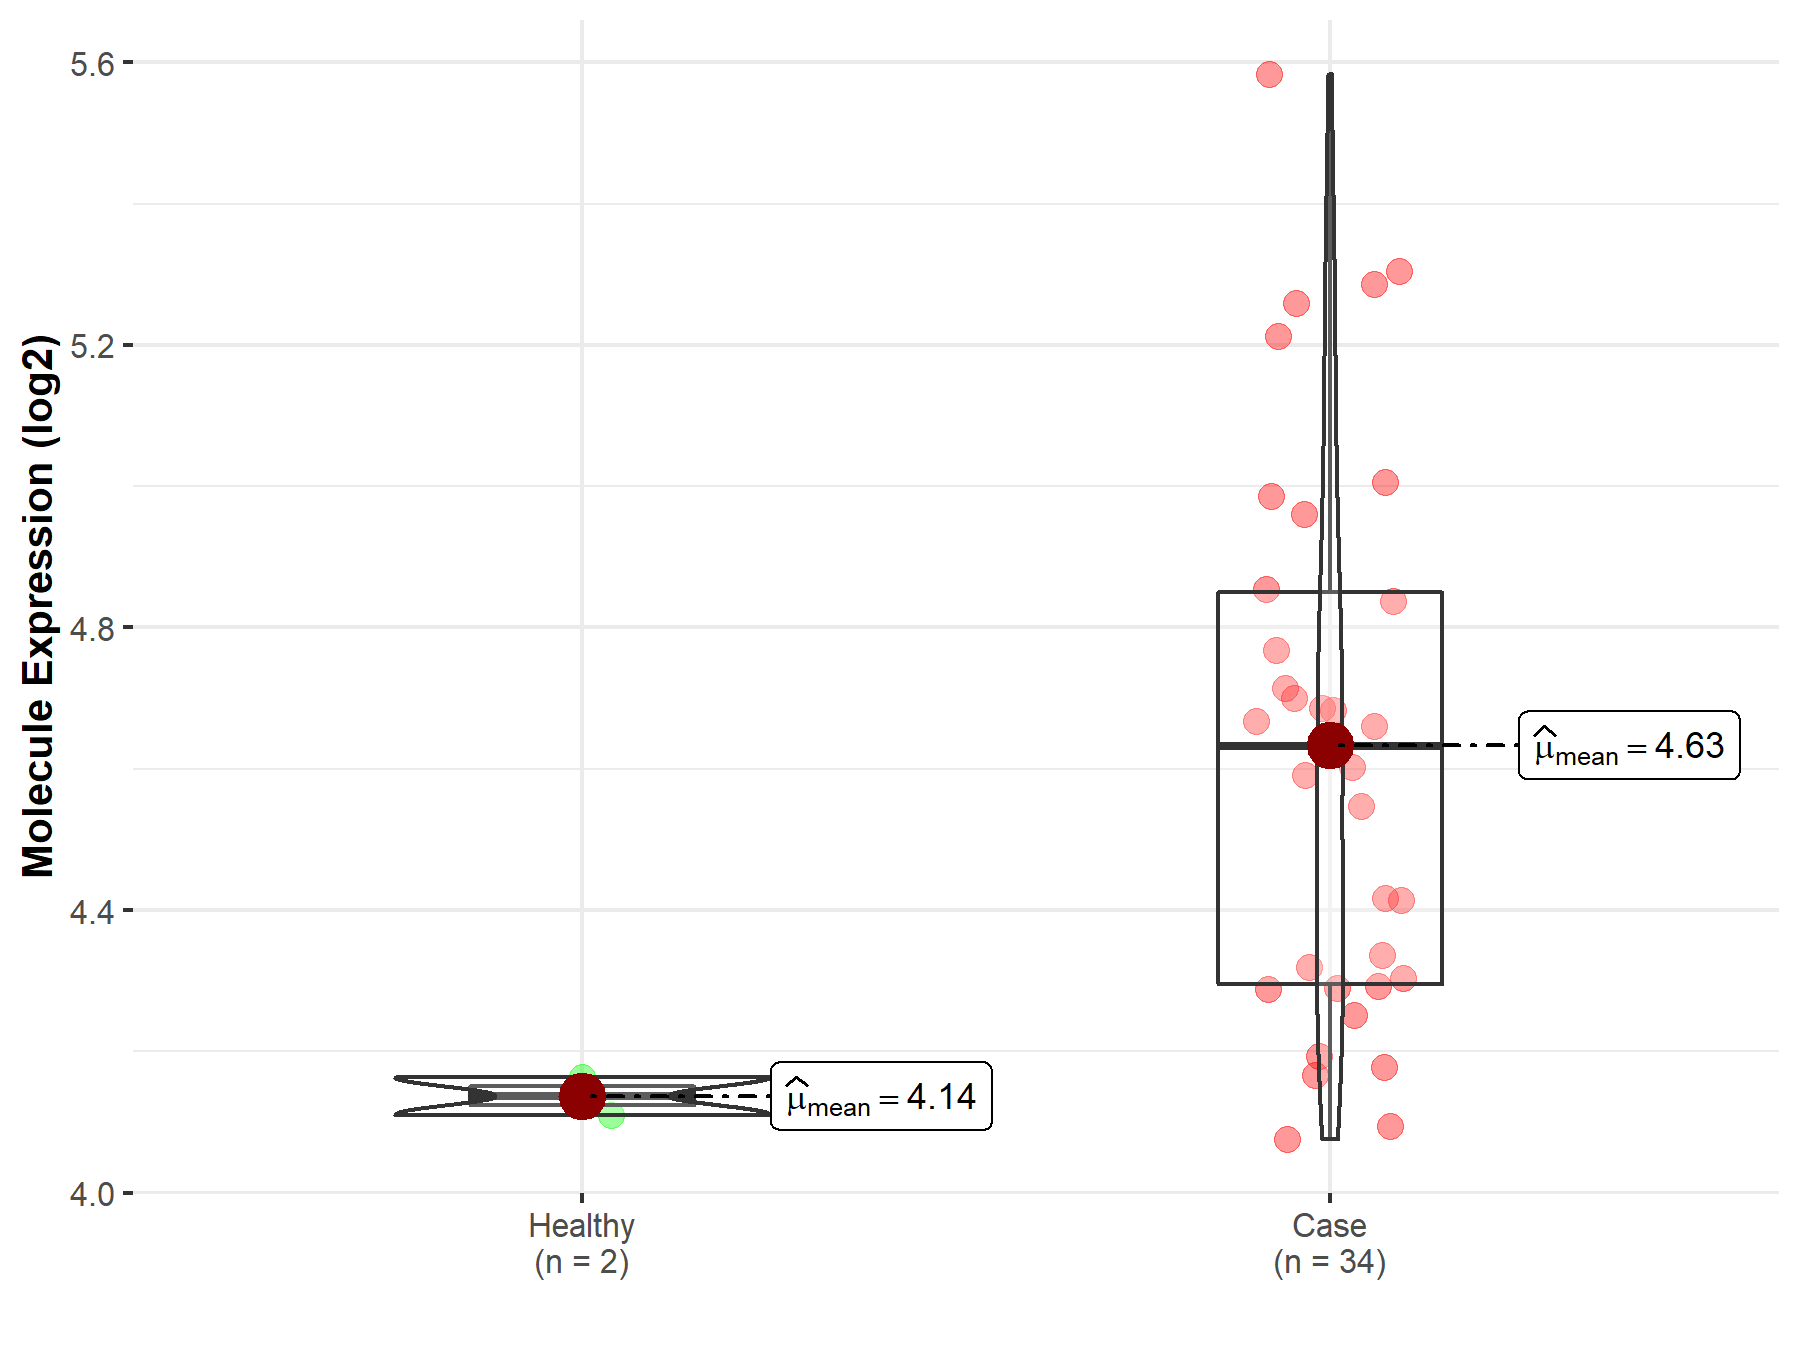
| The Studied Tissue | Brainstem tissue | |
| The Specified Disease | Glioma | |
| The Expression Level of Disease Section Compare with the Healthy Individual Tissue | p-value: 3.98E-07; Fold-change: 4.95E-01; Z-score: 1.32E+01 | |
|
Molecule expression in the diseased tissue of patients
Molecule expression in the normal tissue of healthy individuals
|
||
| Disease-specific Molecule Abundances |

|
Click to View the Clearer Original Diagram |
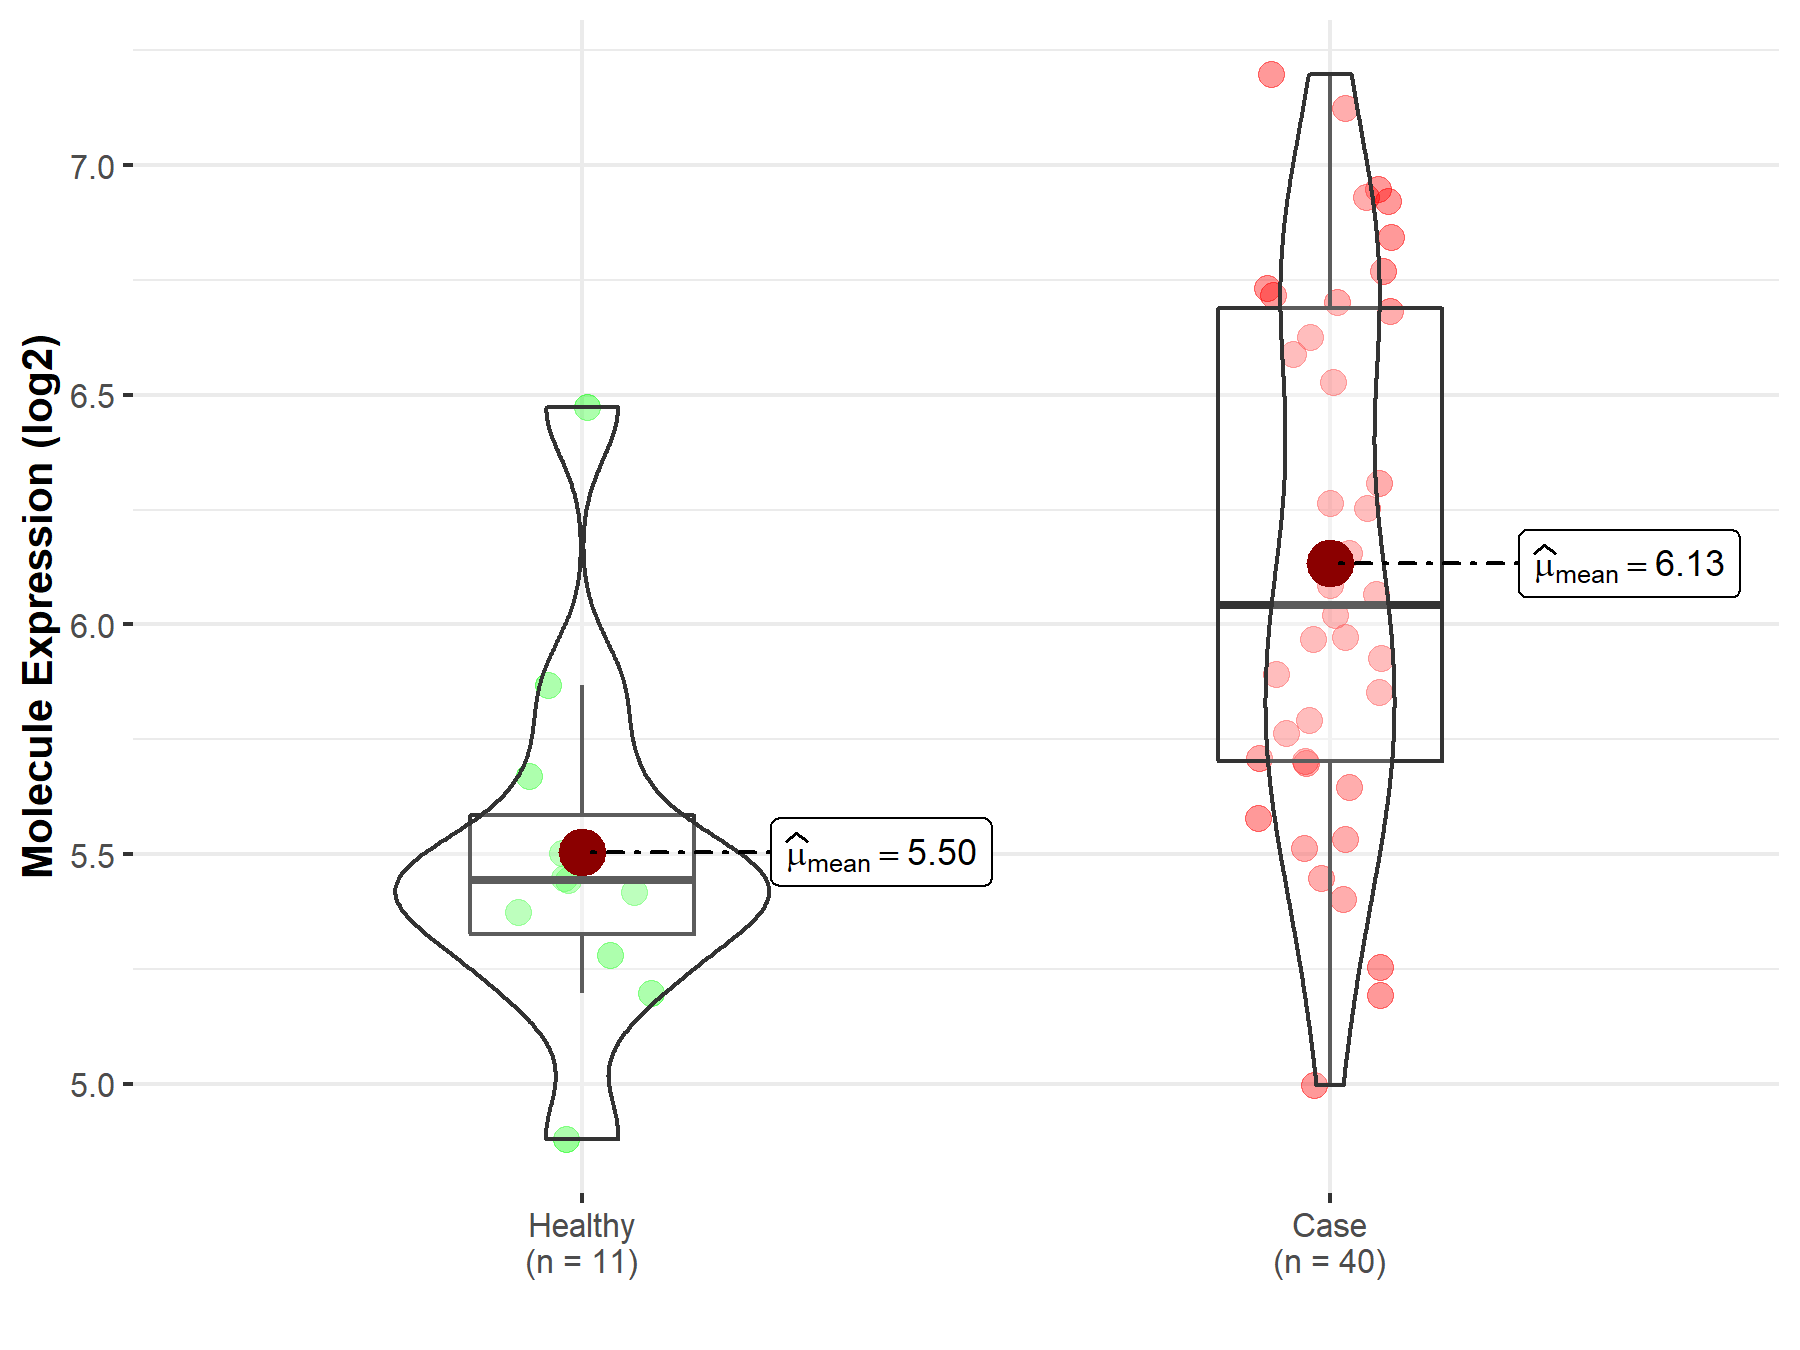
| The Studied Tissue | White matter | |
| The Specified Disease | Glioma | |
| The Expression Level of Disease Section Compare with the Healthy Individual Tissue | p-value: 4.69E-04; Fold-change: 6.00E-01; Z-score: 1.47E+00 | |
|
Molecule expression in the diseased tissue of patients
Molecule expression in the normal tissue of healthy individuals
|
||
| Disease-specific Molecule Abundances |

|
Click to View the Clearer Original Diagram |
| The Studied Tissue | Brainstem tissue | |
| The Specified Disease | Neuroectodermal tumor | |
| The Expression Level of Disease Section Compare with the Healthy Individual Tissue | p-value: 7.81E-17; Fold-change: 1.27E+00; Z-score: 7.65E+00 | |
|
Molecule expression in the diseased tissue of patients
Molecule expression in the normal tissue of healthy individuals
|
||
| Disease-specific Molecule Abundances |

|
Click to View the Clearer Original Diagram |
Tissue-specific Molecule Abundances in Healthy Individuals


|
||
References
If you find any error in data or bug in web service, please kindly report it to Dr. Sun and Dr. Yu.
