Molecule Information
General Information of the Molecule (ID: Mol00690)
| Name |
Transcriptional repressor protein YY1 (TYY1)
,Homo sapiens
|
||||
|---|---|---|---|---|---|
| Synonyms |
Delta transcription factor; INO80 complex subunit S; NF-E1; Yin and yang 1; YY-1; INO80S
Click to Show/Hide
|
||||
| Molecule Type |
Protein
|
||||
| Gene Name |
YY1
|
||||
| Gene ID | |||||
| Location |
chr14:100238298-100282788[+]
|
||||
| Sequence |
MASGDTLYIATDGSEMPAEIVELHEIEVETIPVETIETTVVGEEEEEDDDDEDGGGGDHG
GGGGHGHAGHHHHHHHHHHHPPMIALQPLVTDDPTQVHHHQEVILVQTREEVVGGDDSDG LRAEDGFEDQILIPVPAPAGGDDDYIEQTLVTVAAAGKSGGGGSSSSGGGRVKKGGGKKS GKKSYLSGGAGAAGGGGADPGNKKWEQKQVQIKTLEGEFSVTMWSSDEKKDIDHETVVEE QIIGENSPPDYSEYMTGKKLPPGGIPGIDLSDPKQLAEFARMKPRKIKEDDAPRTIACPH KGCTKMFRDNSAMRKHLHTHGPRVHVCAECGKAFVESSKLKRHQLVHTGEKPFQCTFEGC GKRFSLDFNLRTHVRIHTGDRPYVCPFDGCNKKFAQSTNLKSHILTHAKAKNNQ Click to Show/Hide
|
||||
| 3D-structure |
|
||||
| Function |
Multifunctional transcription factor that exhibits positive and negative control on a large number of cellular and viral genes by binding to sites overlapping the transcription start site. Binds to the consensus sequence 5'-CCGCCATNTT-3'; some genes have been shown to contain a longer binding motif allowing enhanced binding; the initial CG dinucleotide can be methylated greatly reducing the binding affinity. The effect on transcription regulation is depending upon the context in which it binds and diverse mechanisms of action include direct activation or repression, indirect activation or repression via cofactor recruitment, or activation or repression by disruption of binding sites or conformational DNA changes. Its activity is regulated by transcription factors and cytoplasmic proteins that have been shown to abrogate or completely inhibit YY1-mediated activation or repression. For example, it acts as a repressor in absence of adenovirus E1A protein but as an activator in its presence. Acts synergistically with the SMAD1 and SMAD4 in bone morphogenetic protein (BMP)-mediated cardiac-specific gene expression. Binds to SMAD binding elements (SBEs) (5'-GTCT/AGAC-3') within BMP response element (BMPRE) of cardiac activating regions. May play an important role in development and differentiation. Proposed to recruit the PRC2/EED-EZH2 complex to target genes that are transcriptional repressed. Involved in DNA repair. In vitro, binds to DNA recombination intermediate structures (Holliday junctions). Plays a role in regulating enhancer activation.
Click to Show/Hide
|
||||
| Uniprot ID | |||||
| Ensembl ID | |||||
| HGNC ID | |||||
| Click to Show/Hide the Complete Species Lineage | |||||
Type(s) of Resistant Mechanism of This Molecule
Drug Resistance Data Categorized by Drug
Approved Drug(s)
2 drug(s) in total
| Drug Sensitivity Data Categorized by Their Corresponding Mechanisms | ||||
|
|
||||
| Disease Class: Glioblastoma [ICD-11: 2A00.02] | [1] | |||
| Sensitive Disease | Glioblastoma [ICD-11: 2A00.02] | |||
| Sensitive Drug | Cisplatin | |||
| Molecule Alteration | Expression | Down-regulation |
||
| Differential expression of the molecule in resistant disease | ||||
| Classification of Disease | Brain cancer [ICD-11: 2A00] | |||
| The Specified Disease | Brain cancer | |||
| The Studied Tissue | Nervous tissue | |||
| The Expression Level of Disease Section Compare with the Healthy Individual Tissue | p-value: 1.99E-02 Fold-change: -8.78E-03 Z-score: -2.33E+00 |
|||
| Experimental Note | Revealed Based on the Cell Line Data | |||
| Cell Pathway Regulation | Cell viability | Inhibition | hsa05200 | |
| In Vitro Model | LN229 cells | Brain | Homo sapiens (Human) | CVCL_0393 |
| U87MG cells | Brain | Homo sapiens (Human) | CVCL_GP63 | |
| Experiment for Molecule Alteration |
Western blot analysis | |||
| Experiment for Drug Resistance |
MTT assay | |||
| Mechanism Description | miR 186 reverses cisplatin resistance and inhibits the formation of the GIC phenotype by degrading YY1 in glioblastoma. | |||
| Drug Sensitivity Data Categorized by Their Corresponding Mechanisms | ||||
|
|
||||
| Disease Class: Glioblastoma [ICD-11: 2A00.02] | [2] | |||
| Sensitive Disease | Glioblastoma [ICD-11: 2A00.02] | |||
| Sensitive Drug | Temozolomide | |||
| Molecule Alteration | Expression | Down-regulation |
||
| Experimental Note | Revealed Based on the Cell Line Data | |||
| Cell Pathway Regulation | Cell apoptosis | Activation | hsa04210 | |
| Cell colony | Inhibition | hsa05200 | ||
| Cell viability | Inhibition | hsa05200 | ||
| In Vitro Model | LN229 cells | Brain | Homo sapiens (Human) | CVCL_0393 |
| In Vivo Model | Nude mouse xenograft model | Mus musculus | ||
| Experiment for Molecule Alteration |
Western blot analysis | |||
| Experiment for Drug Resistance |
CCK8 assay | |||
| Mechanism Description | miR-7-5p suppresses stemness and enhances temozolomide sensitivity of drug-resistant glioblastoma cells by targeting Yin Yang 1. | |||
Disease- and Tissue-specific Abundances of This Molecule
ICD Disease Classification 02

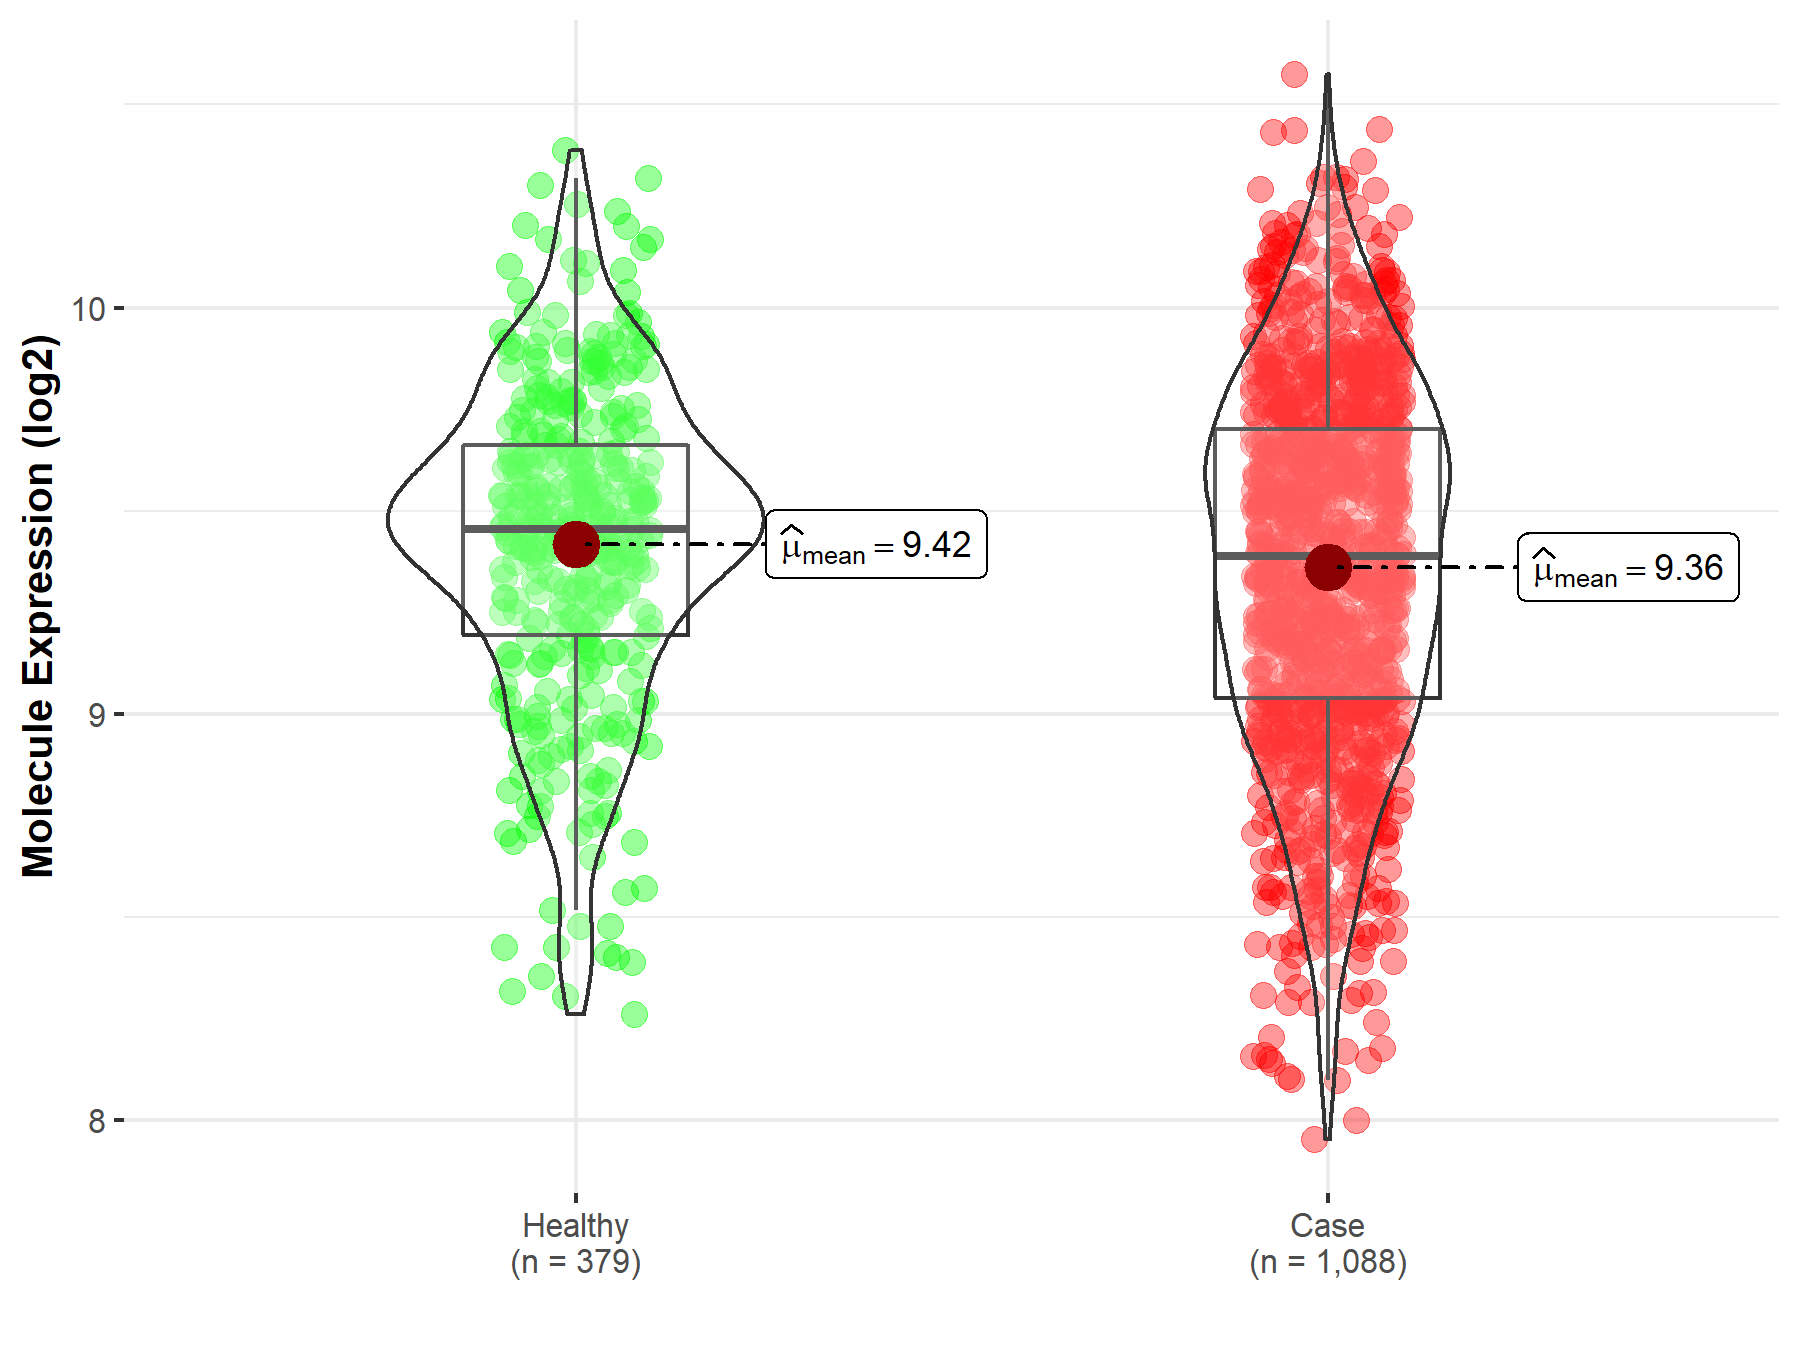
| Differential expression of molecule in resistant diseases | ||
| The Studied Tissue | Nervous tissue | |
| The Specified Disease | Brain cancer | |
| The Expression Level of Disease Section Compare with the Healthy Individual Tissue | p-value: 1.99E-02; Fold-change: -6.70E-02; Z-score: -1.71E-01 | |
|
Molecule expression in the diseased tissue of patients
Molecule expression in the normal tissue of healthy individuals
|
||
| Disease-specific Molecule Abundances |

|
Click to View the Clearer Original Diagram |
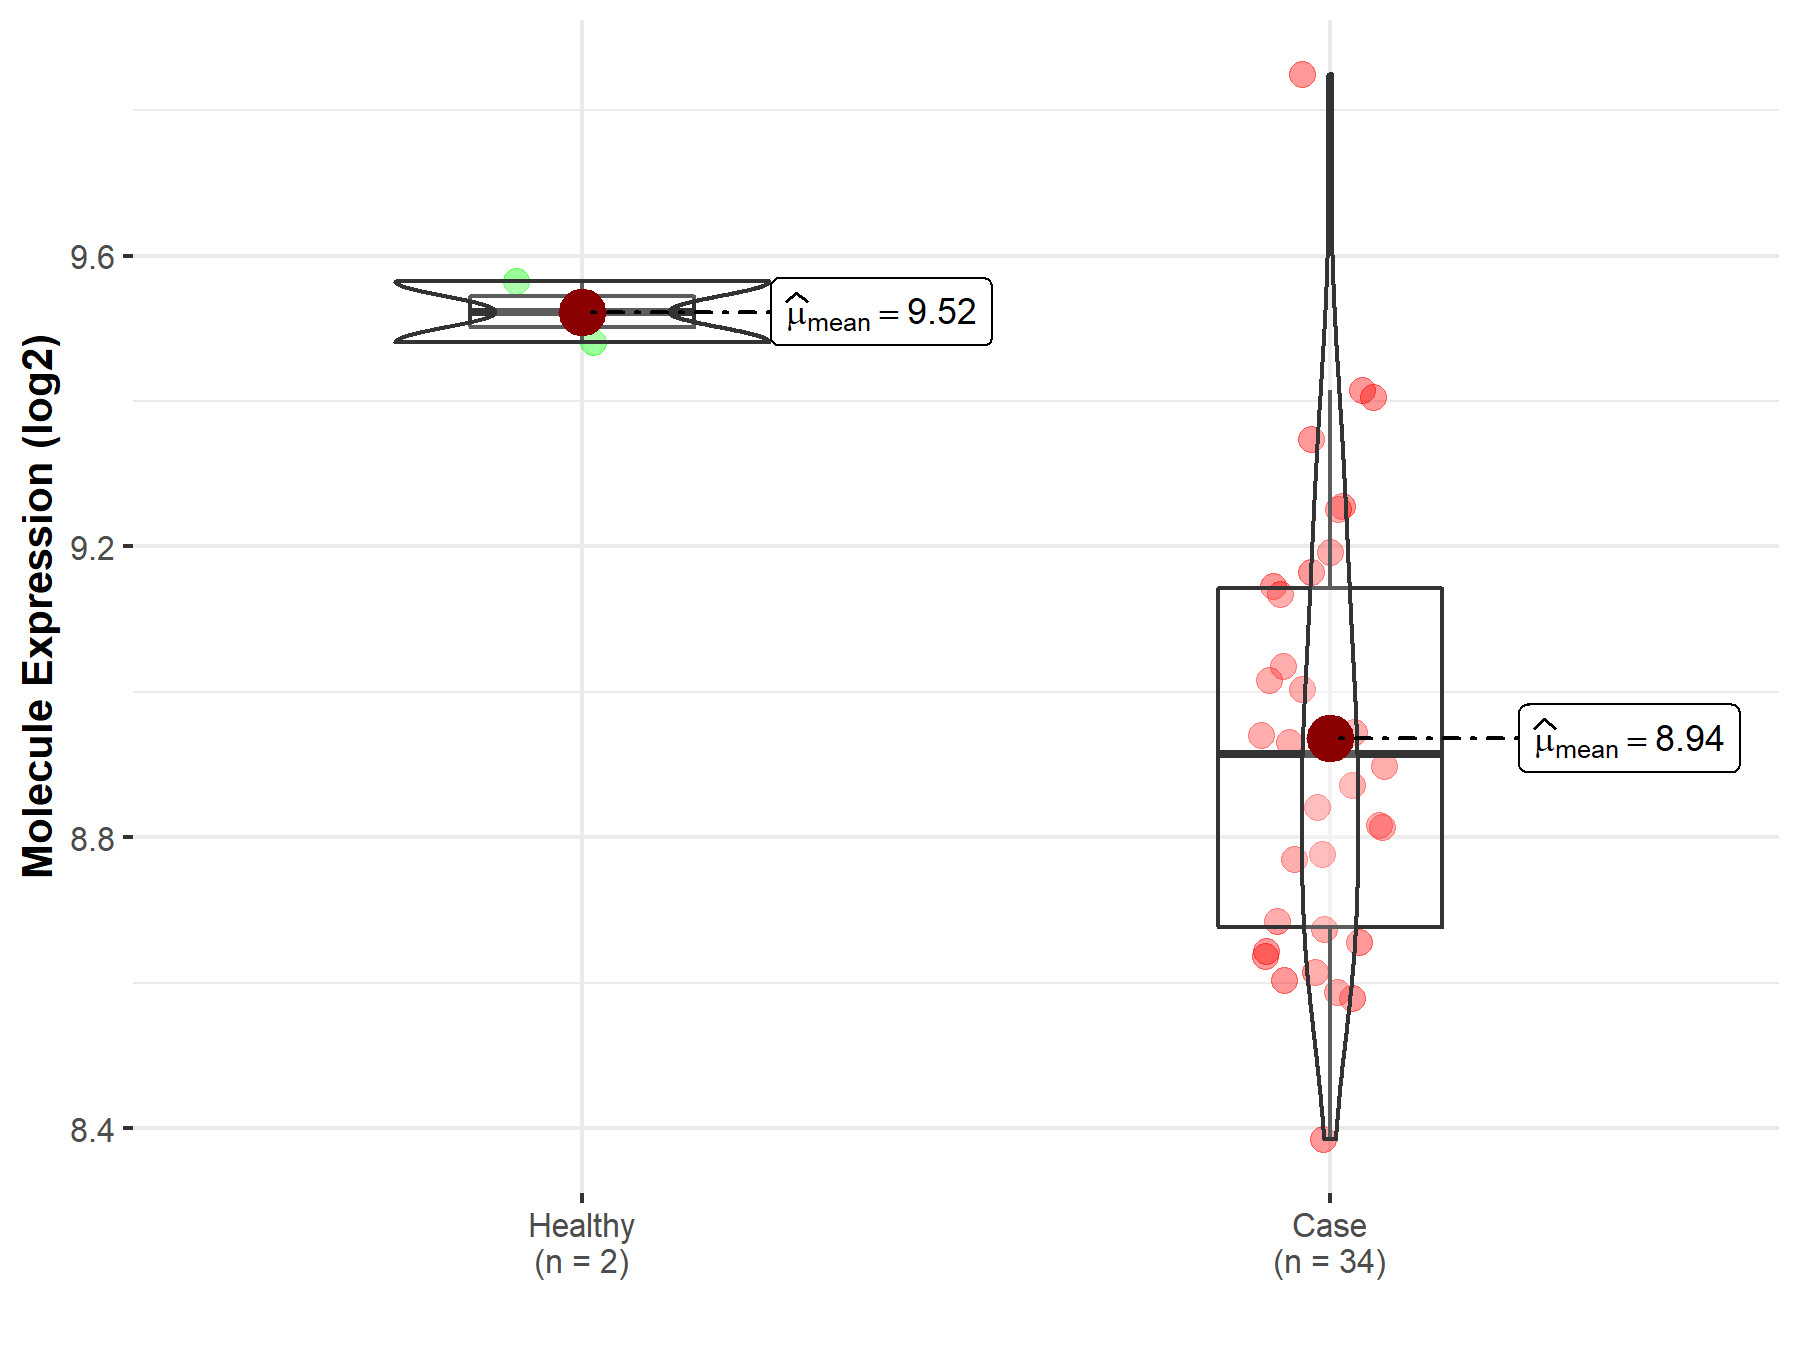
| The Studied Tissue | Brainstem tissue | |
| The Specified Disease | Glioma | |
| The Expression Level of Disease Section Compare with the Healthy Individual Tissue | p-value: 1.25E-04; Fold-change: -6.08E-01; Z-score: -1.01E+01 | |
|
Molecule expression in the diseased tissue of patients
Molecule expression in the normal tissue of healthy individuals
|
||
| Disease-specific Molecule Abundances |

|
Click to View the Clearer Original Diagram |
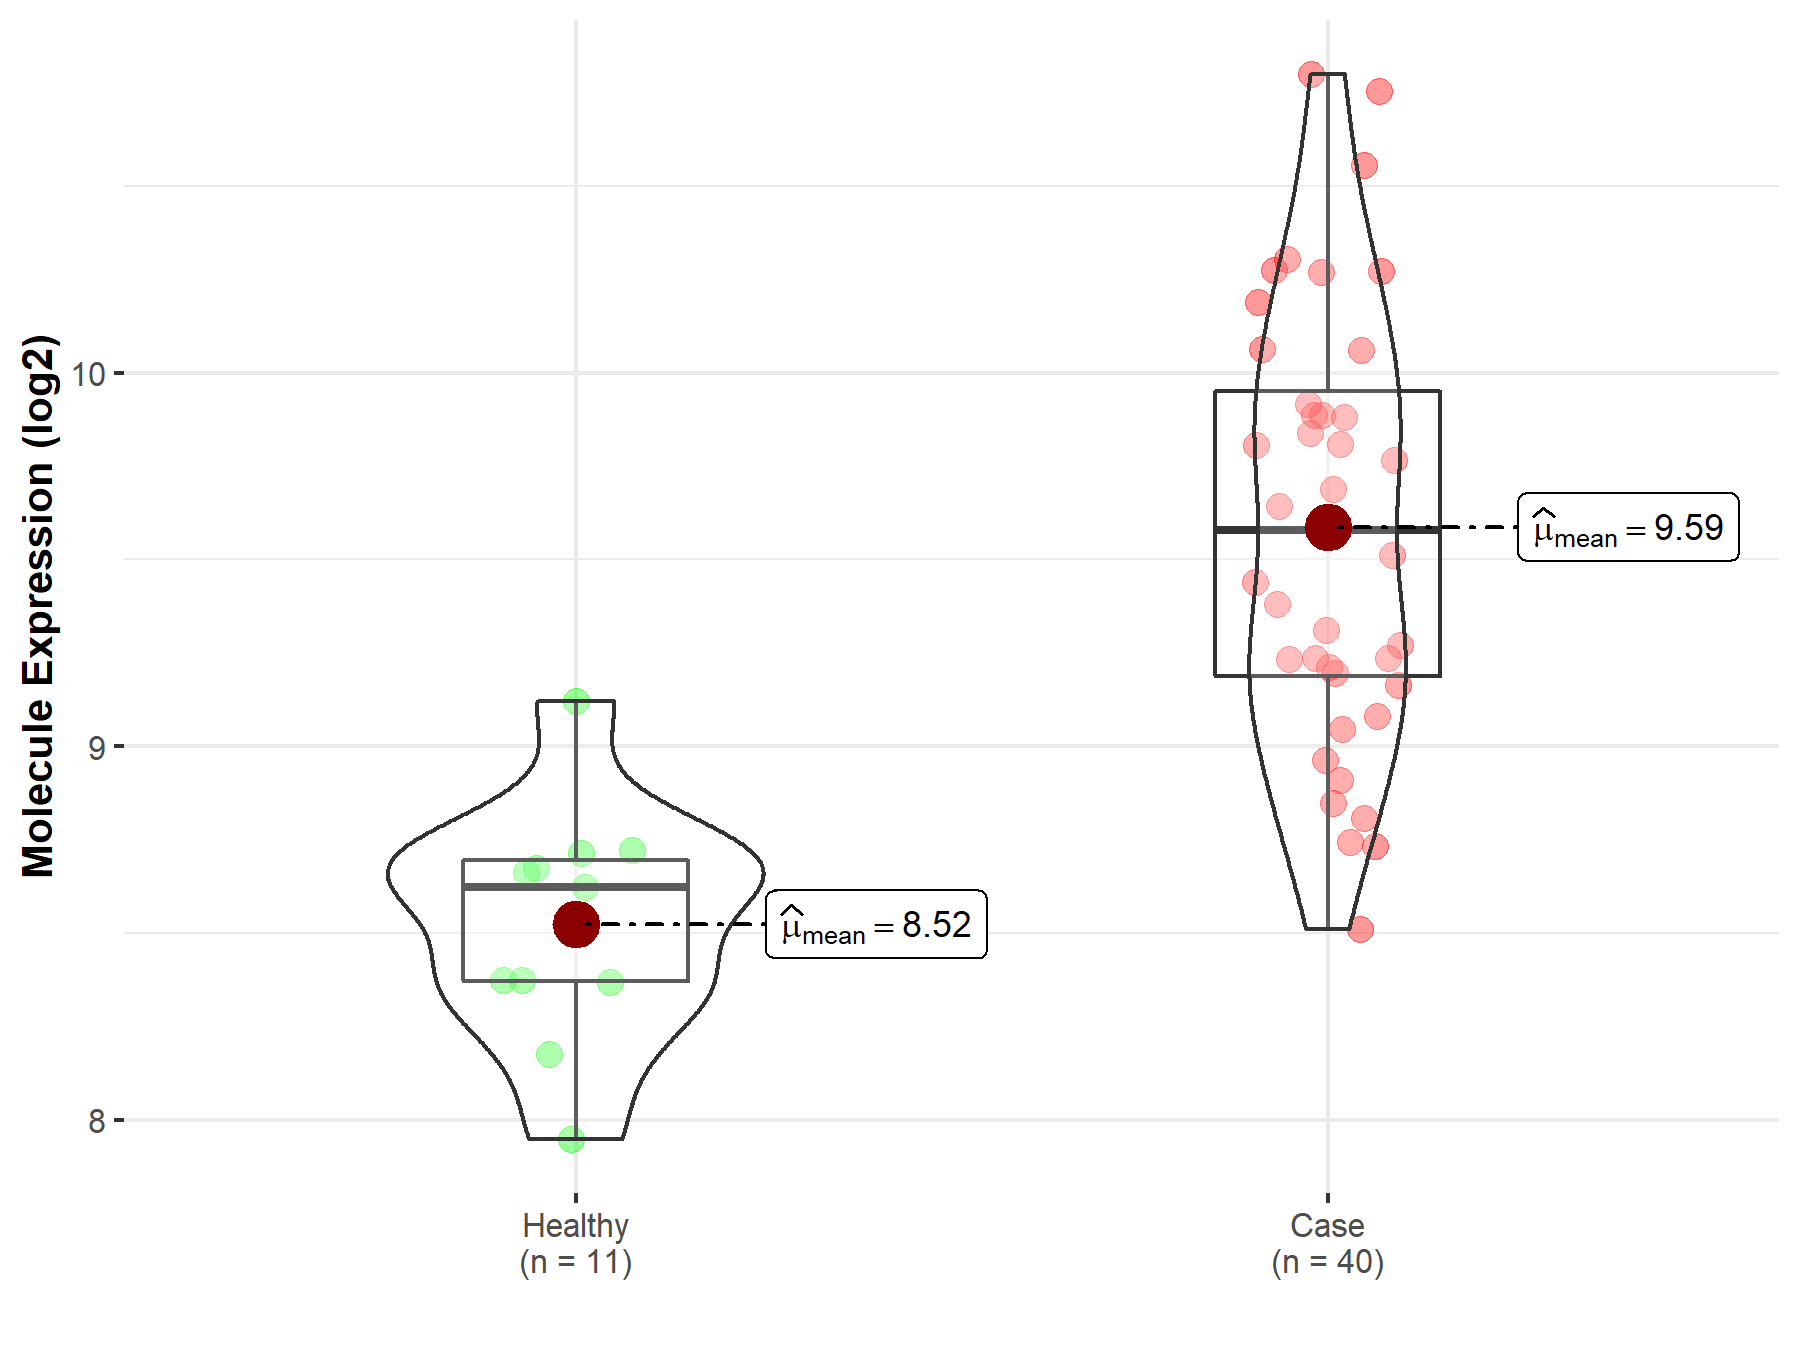
| The Studied Tissue | White matter | |
| The Specified Disease | Glioma | |
| The Expression Level of Disease Section Compare with the Healthy Individual Tissue | p-value: 5.39E-09; Fold-change: 9.54E-01; Z-score: 3.01E+00 | |
|
Molecule expression in the diseased tissue of patients
Molecule expression in the normal tissue of healthy individuals
|
||
| Disease-specific Molecule Abundances |

|
Click to View the Clearer Original Diagram |
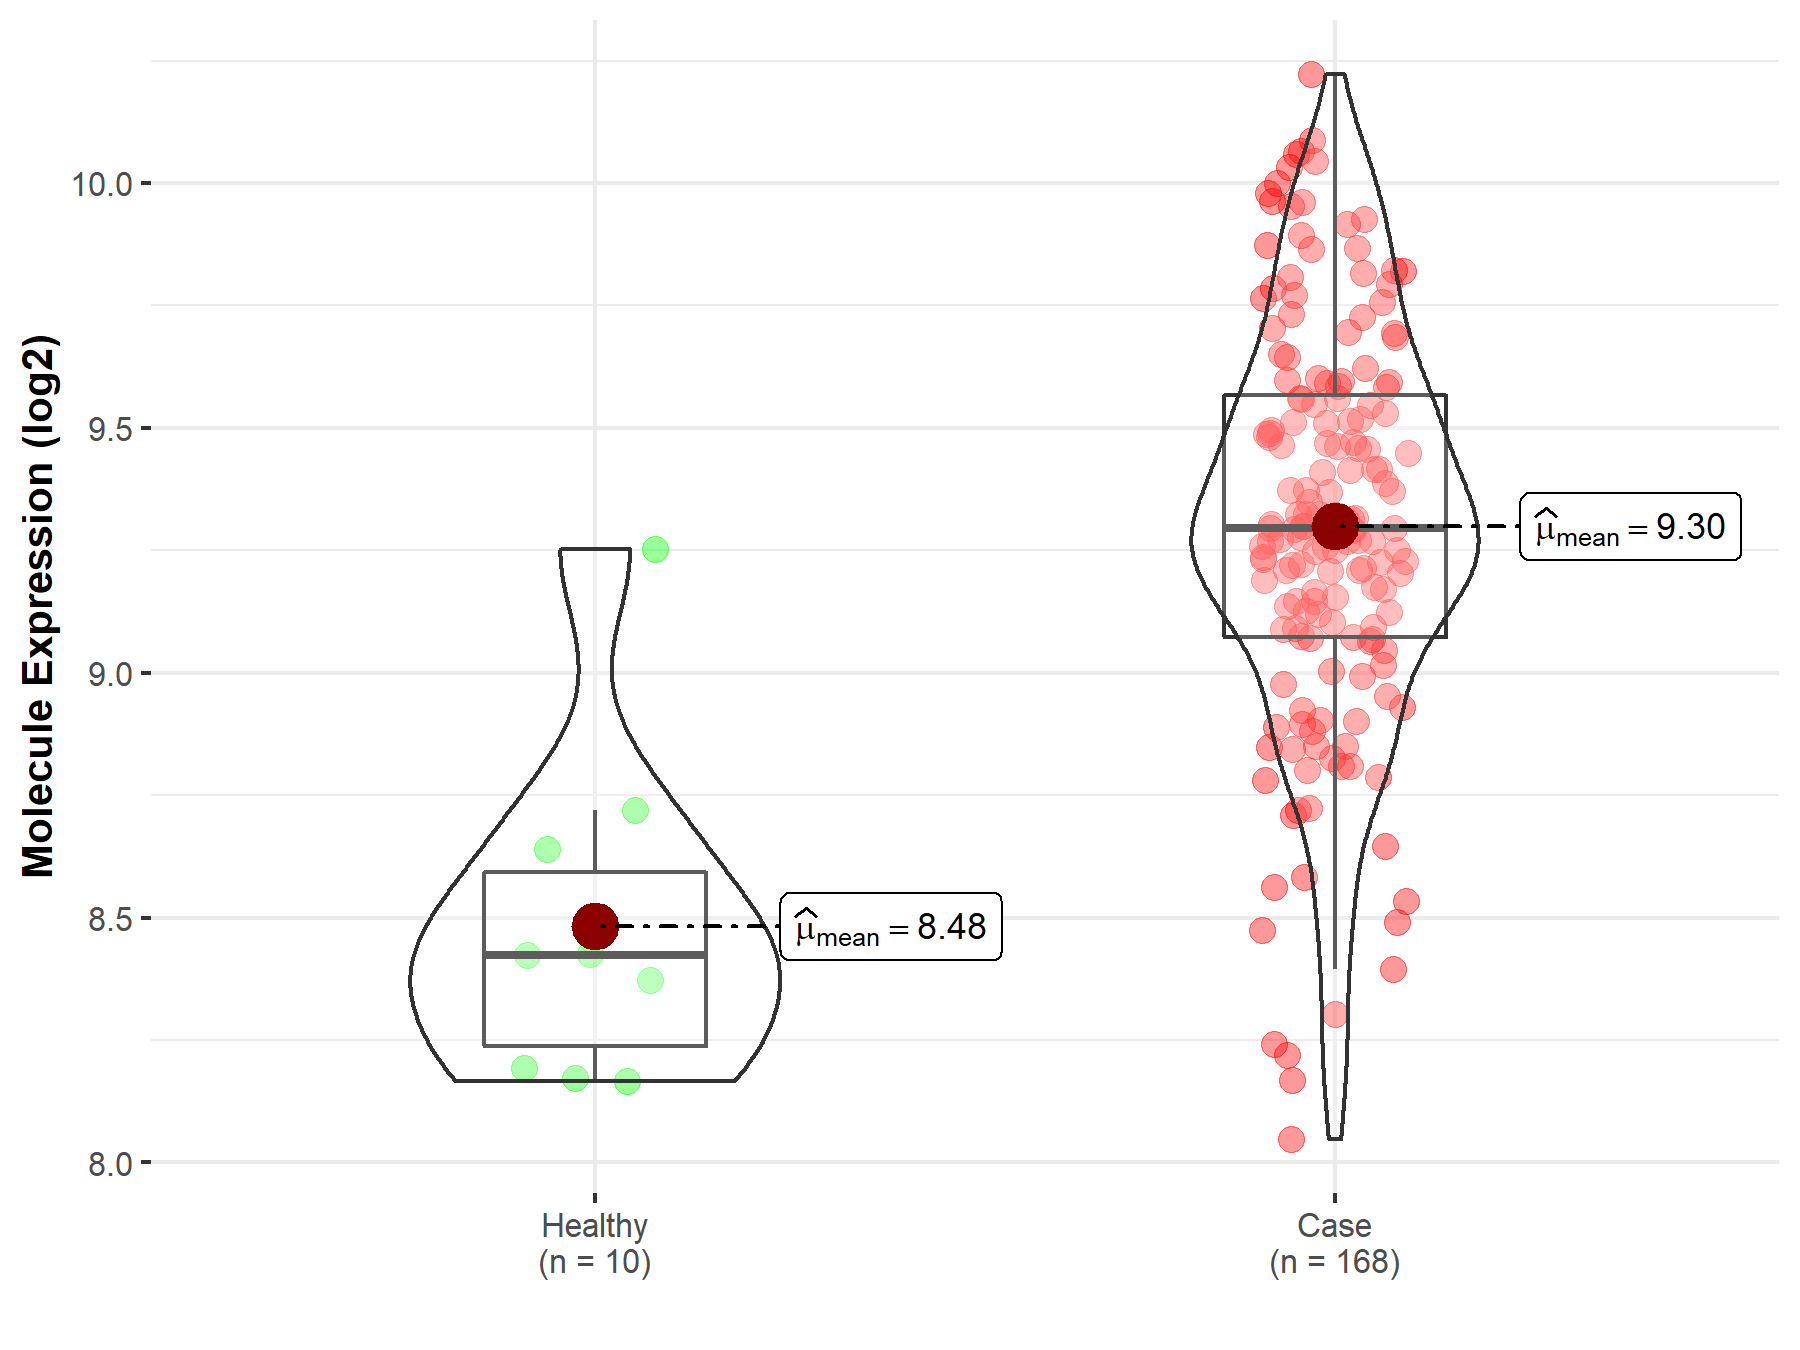
| The Studied Tissue | Brainstem tissue | |
| The Specified Disease | Neuroectodermal tumor | |
| The Expression Level of Disease Section Compare with the Healthy Individual Tissue | p-value: 1.33E-05; Fold-change: 8.70E-01; Z-score: 2.64E+00 | |
|
Molecule expression in the diseased tissue of patients
Molecule expression in the normal tissue of healthy individuals
|
||
| Disease-specific Molecule Abundances |

|
Click to View the Clearer Original Diagram |
Tissue-specific Molecule Abundances in Healthy Individuals


|
||
References
If you find any error in data or bug in web service, please kindly report it to Dr. Sun and Dr. Yu.
