Molecule Information
General Information of the Molecule (ID: Mol00671)
| Name |
Fructose-2,6-bisphosphatase TIGAR (TIGAR)
,Homo sapiens
|
||||
|---|---|---|---|---|---|
| Synonyms |
TP53-induced glycolysis and apoptosis regulator; TP53-induced glycolysis regulatory phosphatase; C12orf5
Click to Show/Hide
|
||||
| Molecule Type |
Protein
|
||||
| Gene Name |
TIGAR
|
||||
| Gene ID | |||||
| Location |
chr12:4307763-4360028[+]
|
||||
| Sequence |
MARFALTVVRHGETRFNKEKIIQGQGVDEPLSETGFKQAAAAGIFLNNVKFTHAFSSDLM
RTKQTMHGILERSKFCKDMTVKYDSRLRERKYGVVEGKALSELRAMAKAAREECPVFTPP GGETLDQVKMRGIDFFEFLCQLILKEADQKEQFSQGSPSNCLETSLAEIFPLGKNHSSKV NSDSGIPGLAASVLVVSHGAYMRSLFDYFLTDLKCSLPATLSRSELMSVTPNTGMSLFII NFEEGREVKPTVQCICMNLQDHLNGLTETR Click to Show/Hide
|
||||
| Function |
Fructose-bisphosphatase hydrolyzing fructose-2,6-bisphosphate as well as fructose-1,6-bisphosphate. Acts as a negative regulator of glycolysis by lowering intracellular levels of fructose-2,6-bisphosphate in a p53/TP53-dependent manner, resulting in the pentose phosphate pathway (PPP) activation and NADPH production. Contributes to the generation of reduced glutathione to cause a decrease in intracellular reactive oxygen species (ROS) content, correlating with its ability to protect cells from oxidative or metabolic stress-induced cell death. Plays a role in promoting protection against cell death during hypoxia by decreasing mitochondria ROS levels in a HK2-dependent manner through a mechanism that is independent of its fructose-bisphosphatase activity. In response to cardiac damage stress, mediates p53-induced inhibition of myocyte mitophagy through ROS levels reduction and the subsequent inactivation of BNIP3. Reduced mitophagy results in an enhanced apoptotic myocyte cell death, and exacerbates cardiac damage. Plays a role in adult intestinal regeneration; contributes to the growth, proliferation and survival of intestinal crypts following tissue ablation. Plays a neuroprotective role against ischemic brain damage by enhancing PPP flux and preserving mitochondria functions. Protects glioma cells from hypoxia- and ROS-induced cell death by inhibiting glycolysis and activating mitochondrial energy metabolism and oxygen consumption in a TKTL1-dependent and p53/TP53-independent manner. Plays a role in cancer cell survival by promoting DNA repair through activating PPP flux in a CDK5-ATM-dependent signaling pathway during hypoxia and/or genome stress-induced DNA damage responses. Involved in intestinal tumor progression.
Click to Show/Hide
|
||||
| Uniprot ID | |||||
| Ensembl ID | |||||
| HGNC ID | |||||
| Click to Show/Hide the Complete Species Lineage | |||||
Type(s) of Resistant Mechanism of This Molecule
Drug Resistance Data Categorized by Drug
Approved Drug(s)
1 drug(s) in total
| Drug Resistance Data Categorized by Their Corresponding Mechanisms | ||||
|
|
||||
| Disease Class: Glioblastoma [ICD-11: 2A00.02] | [1] | |||
| Resistant Disease | Glioblastoma [ICD-11: 2A00.02] | |||
| Resistant Drug | Dichloroacetate | |||
| Molecule Alteration | Expression | Up-regulation |
||
| Differential expression of the molecule in resistant disease | ||||
| Classification of Disease | Brain cancer [ICD-11: 2A00] | |||
| The Specified Disease | Brain cancer | |||
| The Studied Tissue | Nervous tissue | |||
| The Expression Level of Disease Section Compare with the Healthy Individual Tissue | p-value: 1.23E-47 Fold-change: 1.44E-01 Z-score: 1.54E+01 |
|||
| Experimental Note | Identified from the Human Clinical Data | |||
| Cell Pathway Regulation | Cell migration | Activation | hsa04670 | |
| Cell proliferation | Activation | hsa05200 | ||
| In Vitro Model | DBTRG cells | Brain | Homo sapiens (Human) | CVCL_1169 |
| Experiment for Molecule Alteration |
Western blot analysis; RT-qPCR | |||
| Experiment for Drug Resistance |
Colorimetric SRB assay | |||
| Mechanism Description | The potential of miR-144 overexpression to reduce GB cell malignancy, both by decreasing Cell migration and invasion abilities and by sensitizing resistant tumor cells to chemotherapy, paving the way to a novel and more effective GB therapy. | |||
Disease- and Tissue-specific Abundances of This Molecule
ICD Disease Classification 02

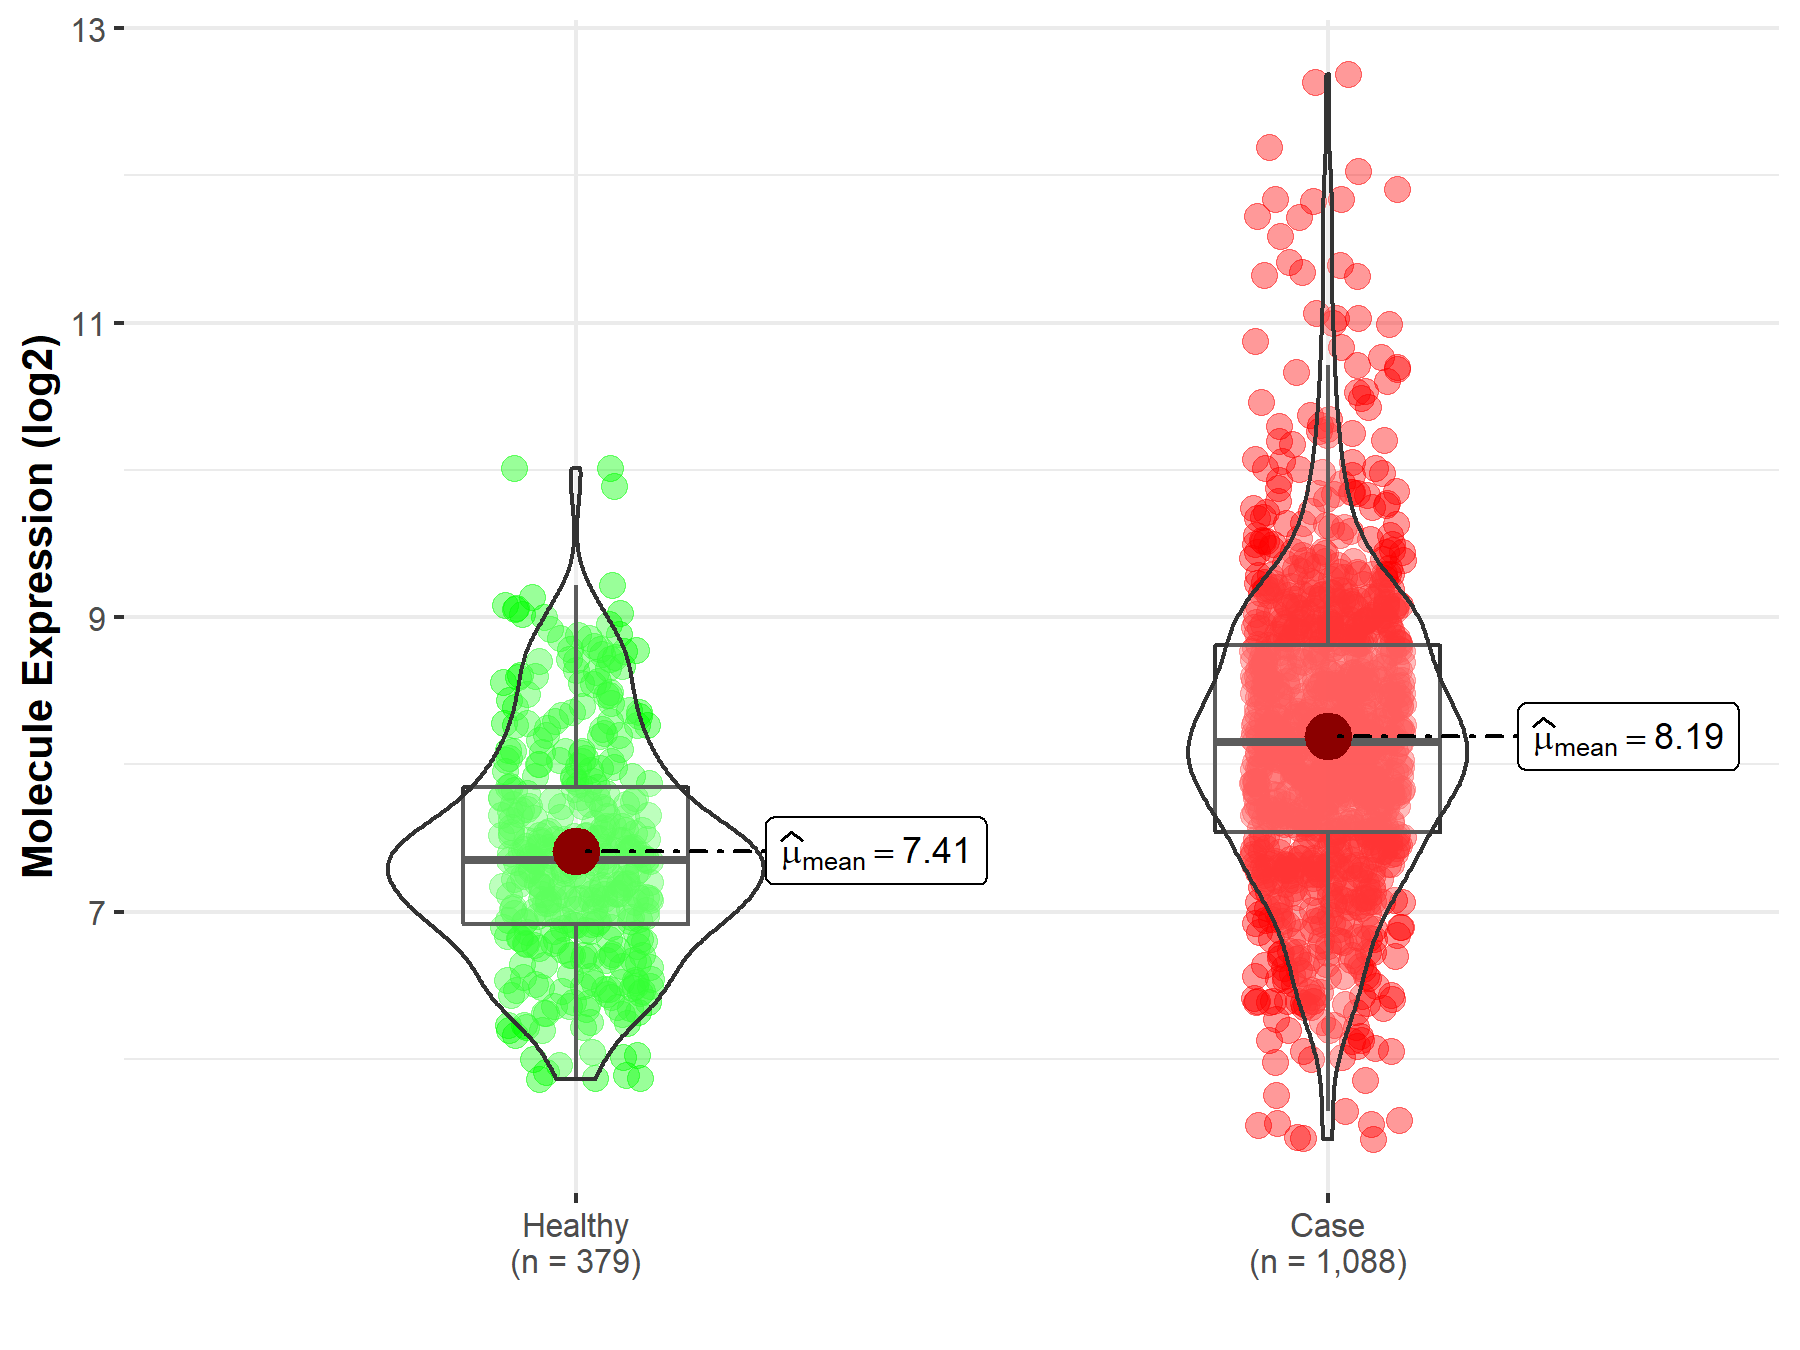
| Differential expression of molecule in resistant diseases | ||
| The Studied Tissue | Nervous tissue | |
| The Specified Disease | Brain cancer | |
| The Expression Level of Disease Section Compare with the Healthy Individual Tissue | p-value: 1.23E-47; Fold-change: 8.04E-01; Z-score: 1.05E+00 | |
|
Molecule expression in the diseased tissue of patients
Molecule expression in the normal tissue of healthy individuals
|
||
| Disease-specific Molecule Abundances |

|
Click to View the Clearer Original Diagram |
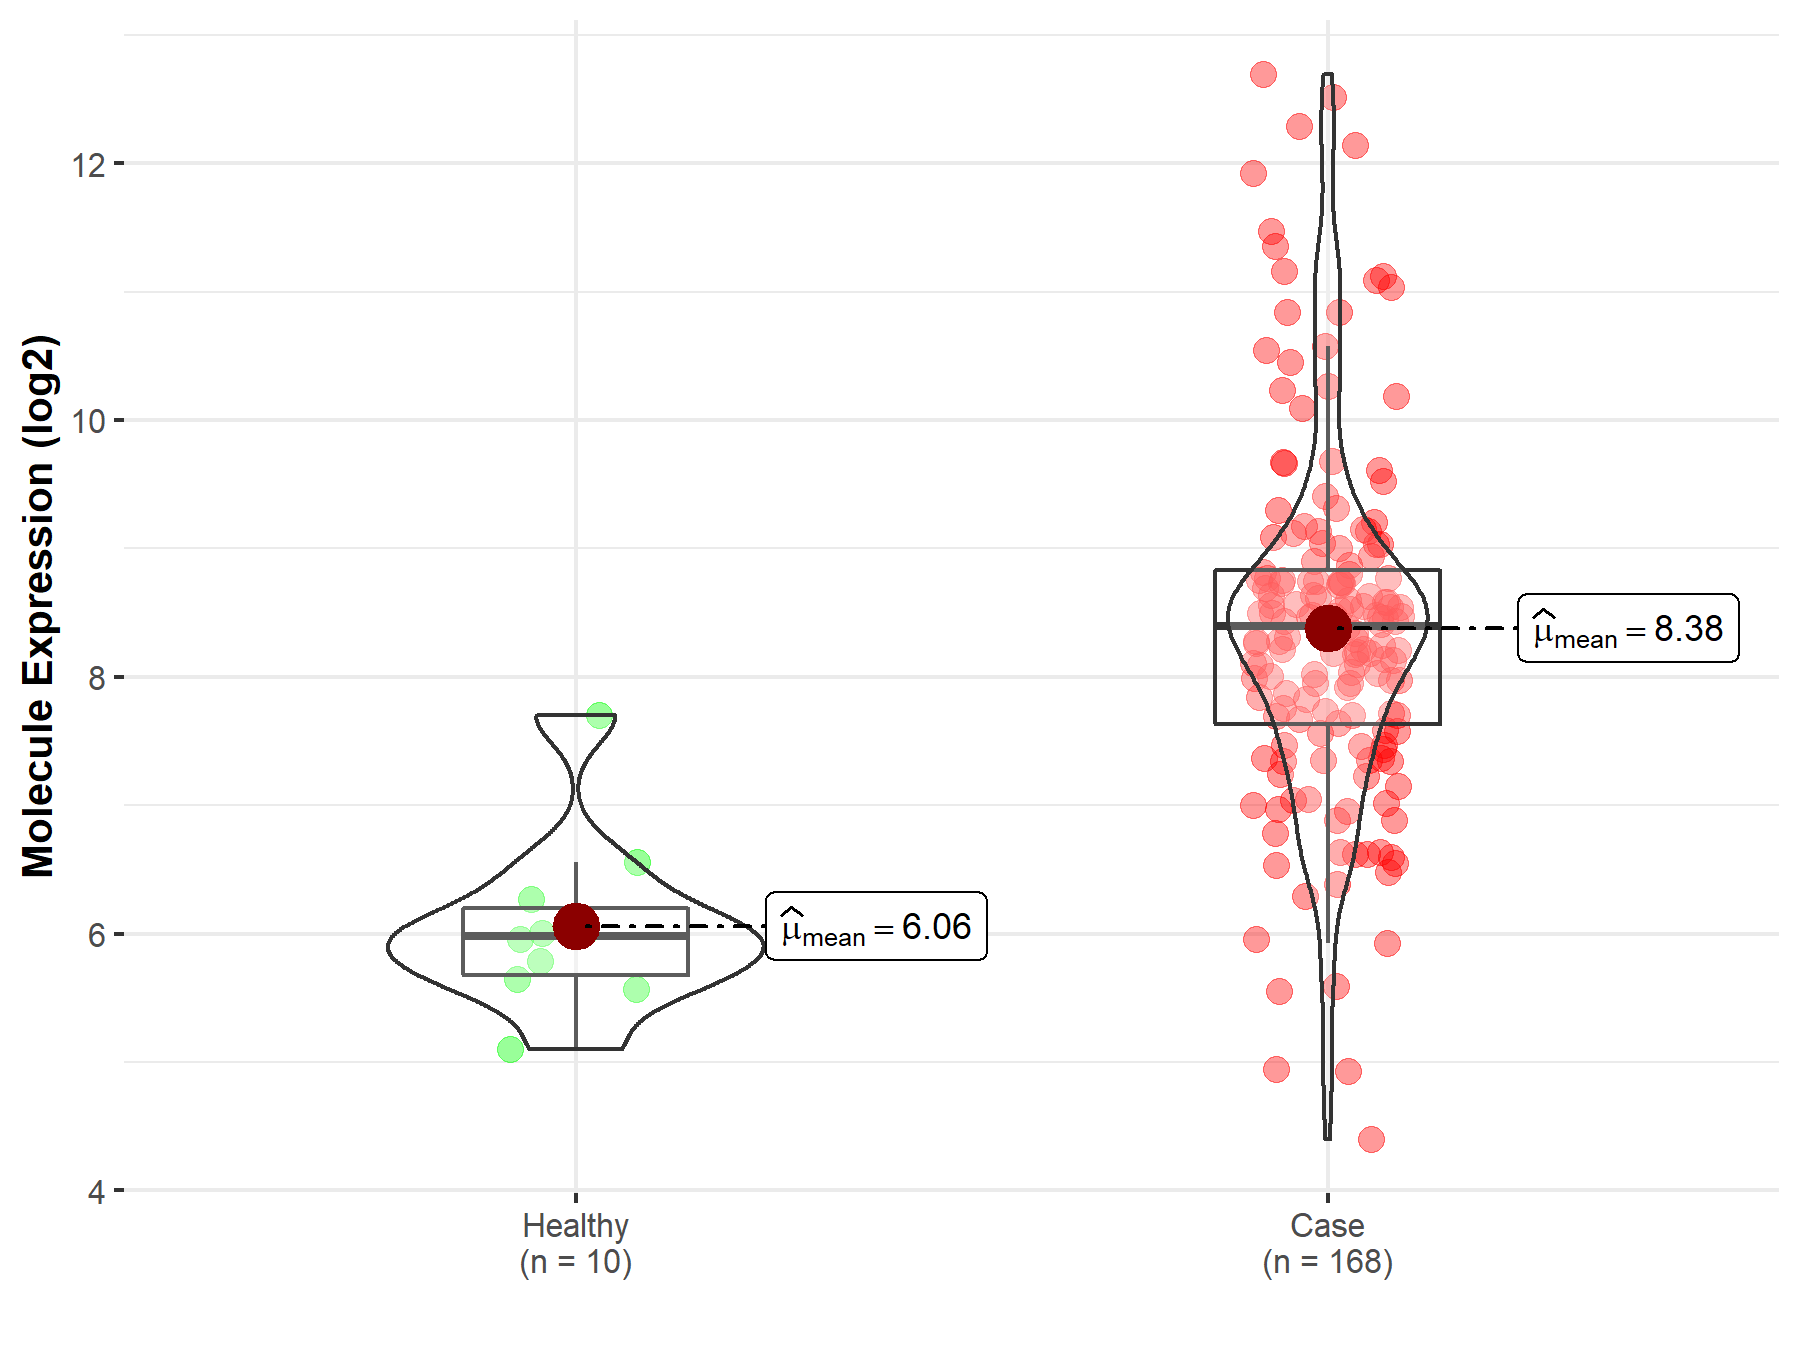
| The Studied Tissue | Brainstem tissue | |
| The Specified Disease | Glioma | |
| The Expression Level of Disease Section Compare with the Healthy Individual Tissue | p-value: 7.01E-01; Fold-change: 1.98E-02; Z-score: 7.19E-02 | |
|
Molecule expression in the diseased tissue of patients
Molecule expression in the normal tissue of healthy individuals
|
||
| Disease-specific Molecule Abundances |

|
Click to View the Clearer Original Diagram |
| The Studied Tissue | White matter | |
| The Specified Disease | Glioma | |
| The Expression Level of Disease Section Compare with the Healthy Individual Tissue | p-value: 5.87E-02; Fold-change: 4.77E-01; Z-score: 9.04E-01 | |
|
Molecule expression in the diseased tissue of patients
Molecule expression in the normal tissue of healthy individuals
|
||
| Disease-specific Molecule Abundances |

|
Click to View the Clearer Original Diagram |
| The Studied Tissue | Brainstem tissue | |
| The Specified Disease | Neuroectodermal tumor | |
| The Expression Level of Disease Section Compare with the Healthy Individual Tissue | p-value: 2.28E-07; Fold-change: 2.42E+00; Z-score: 3.45E+00 | |
|
Molecule expression in the diseased tissue of patients
Molecule expression in the normal tissue of healthy individuals
|
||
| Disease-specific Molecule Abundances |

|
Click to View the Clearer Original Diagram |
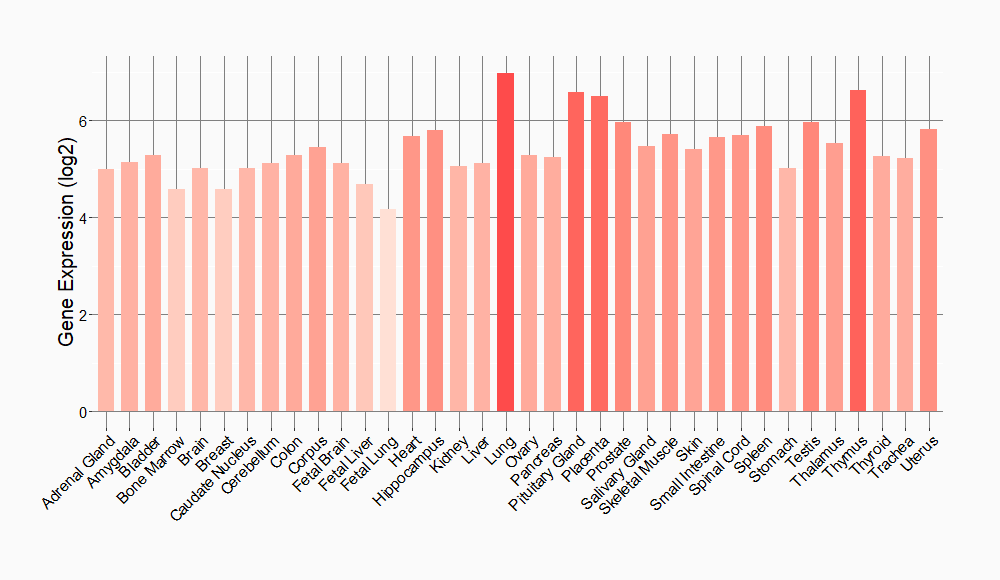
Tissue-specific Molecule Abundances in Healthy Individuals


|
||
References
If you find any error in data or bug in web service, please kindly report it to Dr. Sun and Dr. Yu.
