Molecule Information
General Information of the Molecule (ID: Mol00656)
| Name |
Steroidogenic factor 1 (STF1)
,Homo sapiens
|
||||
|---|---|---|---|---|---|
| Synonyms |
SF-1; STF-1; hSF-1; Adrenal 4-binding protein; Fushi tarazu factor homolog 1; Nuclear receptor subfamily 5 group A member 1; Steroid hormone receptor Ad4BP; AD4BP; FTZF1; SF1
Click to Show/Hide
|
||||
| Molecule Type |
Protein
|
||||
| Gene Name |
NR5A1
|
||||
| Gene ID | |||||
| Location |
chr9:124481236-124507420[-]
|
||||
| Sequence |
MDYSYDEDLDELCPVCGDKVSGYHYGLLTCESCKGFFKRTVQNNKHYTCTESQSCKIDKT
QRKRCPFCRFQKCLTVGMRLEAVRADRMRGGRNKFGPMYKRDRALKQQKKAQIRANGFKL ETGPPMGVPPPPPPAPDYVLPPSLHGPEPKGLAAGPPAGPLGDFGAPALPMAVPGAHGPL AGYLYPAFPGRAIKSEYPEPYASPPQPGLPYGYPEPFSGGPNVPELILQLLQLEPDEDQV RARILGCLQEPTKSRPDQPAAFGLLCRMADQTFISIVDWARRCMVFKELEVADQMTLLQN CWSELLVFDHIYRQVQHGKEGSILLVTGQEVELTTVATQAGSLLHSLVLRAQELVLQLLA LQLDRQEFVCLKFIILFSLDLKFLNNHILVKDAQEKANAALLDYTLCHYPHCGDKFQQLL LCLVEVRALSMQAKEYLYHKHLGNEMPRNNLLIEMLQAKQT Click to Show/Hide
|
||||
| 3D-structure |
|
||||
| Function |
Transcriptional activator. Essential for sexual differentiation and formation of the primary steroidogenic tissues. Binds to the Ad4 site found in the promoter region of steroidogenic P450 genes such as CYP11A, CYP11B and CYP21B. Also regulates the AMH/Muellerian inhibiting substance gene as well as the AHCH and STAR genes. 5'-YCAAGGYC-3' and 5'-RRAGGTCA-3' are the consensus sequences for the recognition by NR5A1. The SFPQ-NONO-NR5A1 complex binds to the CYP17 promoter and regulates basal and cAMP-dependent transcriptional activity. Binds phosphatidylcholine. Binds phospholipids with a phosphatidylinositol (PI) headgroup, in particular PI(3,4)P2 and PI(3,4,5)P3. Activated by the phosphorylation of NR5A1 by HIPK3 leading to increased steroidogenic gene expression upon cAMP signaling pathway stimulation.
Click to Show/Hide
|
||||
| Uniprot ID | |||||
| Ensembl ID | |||||
| HGNC ID | |||||
| Click to Show/Hide the Complete Species Lineage | |||||
Type(s) of Resistant Mechanism of This Molecule
Drug Resistance Data Categorized by Drug
Approved Drug(s)
1 drug(s) in total
| Drug Resistance Data Categorized by Their Corresponding Mechanisms | ||||
|
|
||||
| Disease Class: Oral squamous cell carcinoma [ICD-11: 2B6E.0] | [1] | |||
| Resistant Disease | Oral squamous cell carcinoma [ICD-11: 2B6E.0] | |||
| Resistant Drug | Cisplatin | |||
| Molecule Alteration | Expression | Up-regulation |
||
| Experimental Note | Revealed Based on the Cell Line Data | |||
| Cell Pathway Regulation | Cell adhesion | Activation | hsa04514 | |
| Cell invasion | Activation | hsa05200 | ||
| Cell migration | Activation | hsa04670 | ||
| Cell proliferation | Activation | hsa05200 | ||
| In Vitro Model | Tca8113 cells | Tongue | Homo sapiens (Human) | CVCL_6851 |
| CAL-27 cells | Tongue | Homo sapiens (Human) | CVCL_1107 | |
| NHOk cells | Tongue | Homo sapiens (Human) | N.A. | |
| SCC9 cells | Tongue | Homo sapiens (Human) | CVCL_1685 | |
| TSCCA cells | Tongue | Homo sapiens (Human) | CVCL_VL15 | |
| In Vivo Model | Nude mouse xenograft model | Mus musculus | ||
| Experiment for Molecule Alteration |
Western blot analysis | |||
| Experiment for Drug Resistance |
MTT assay; Flow cytometry assay; Caspase-3 activity analysis | |||
| Mechanism Description | UCA1 accelerated proliferation, increased CDDP chemoresistance and restrained apoptosis partly through modulating SF1 via sponging miR-184 in OSCC cells. UCA1 promoted the expression of SF1 by sponging miR-184 in CDDP-resistant OSCC cells. | |||
Disease- and Tissue-specific Abundances of This Molecule
ICD Disease Classification 02

| Differential expression of molecule in resistant diseases | ||
| The Studied Tissue | Oral tissue | |
| The Specified Disease | Oral squamous cell carcinoma | |
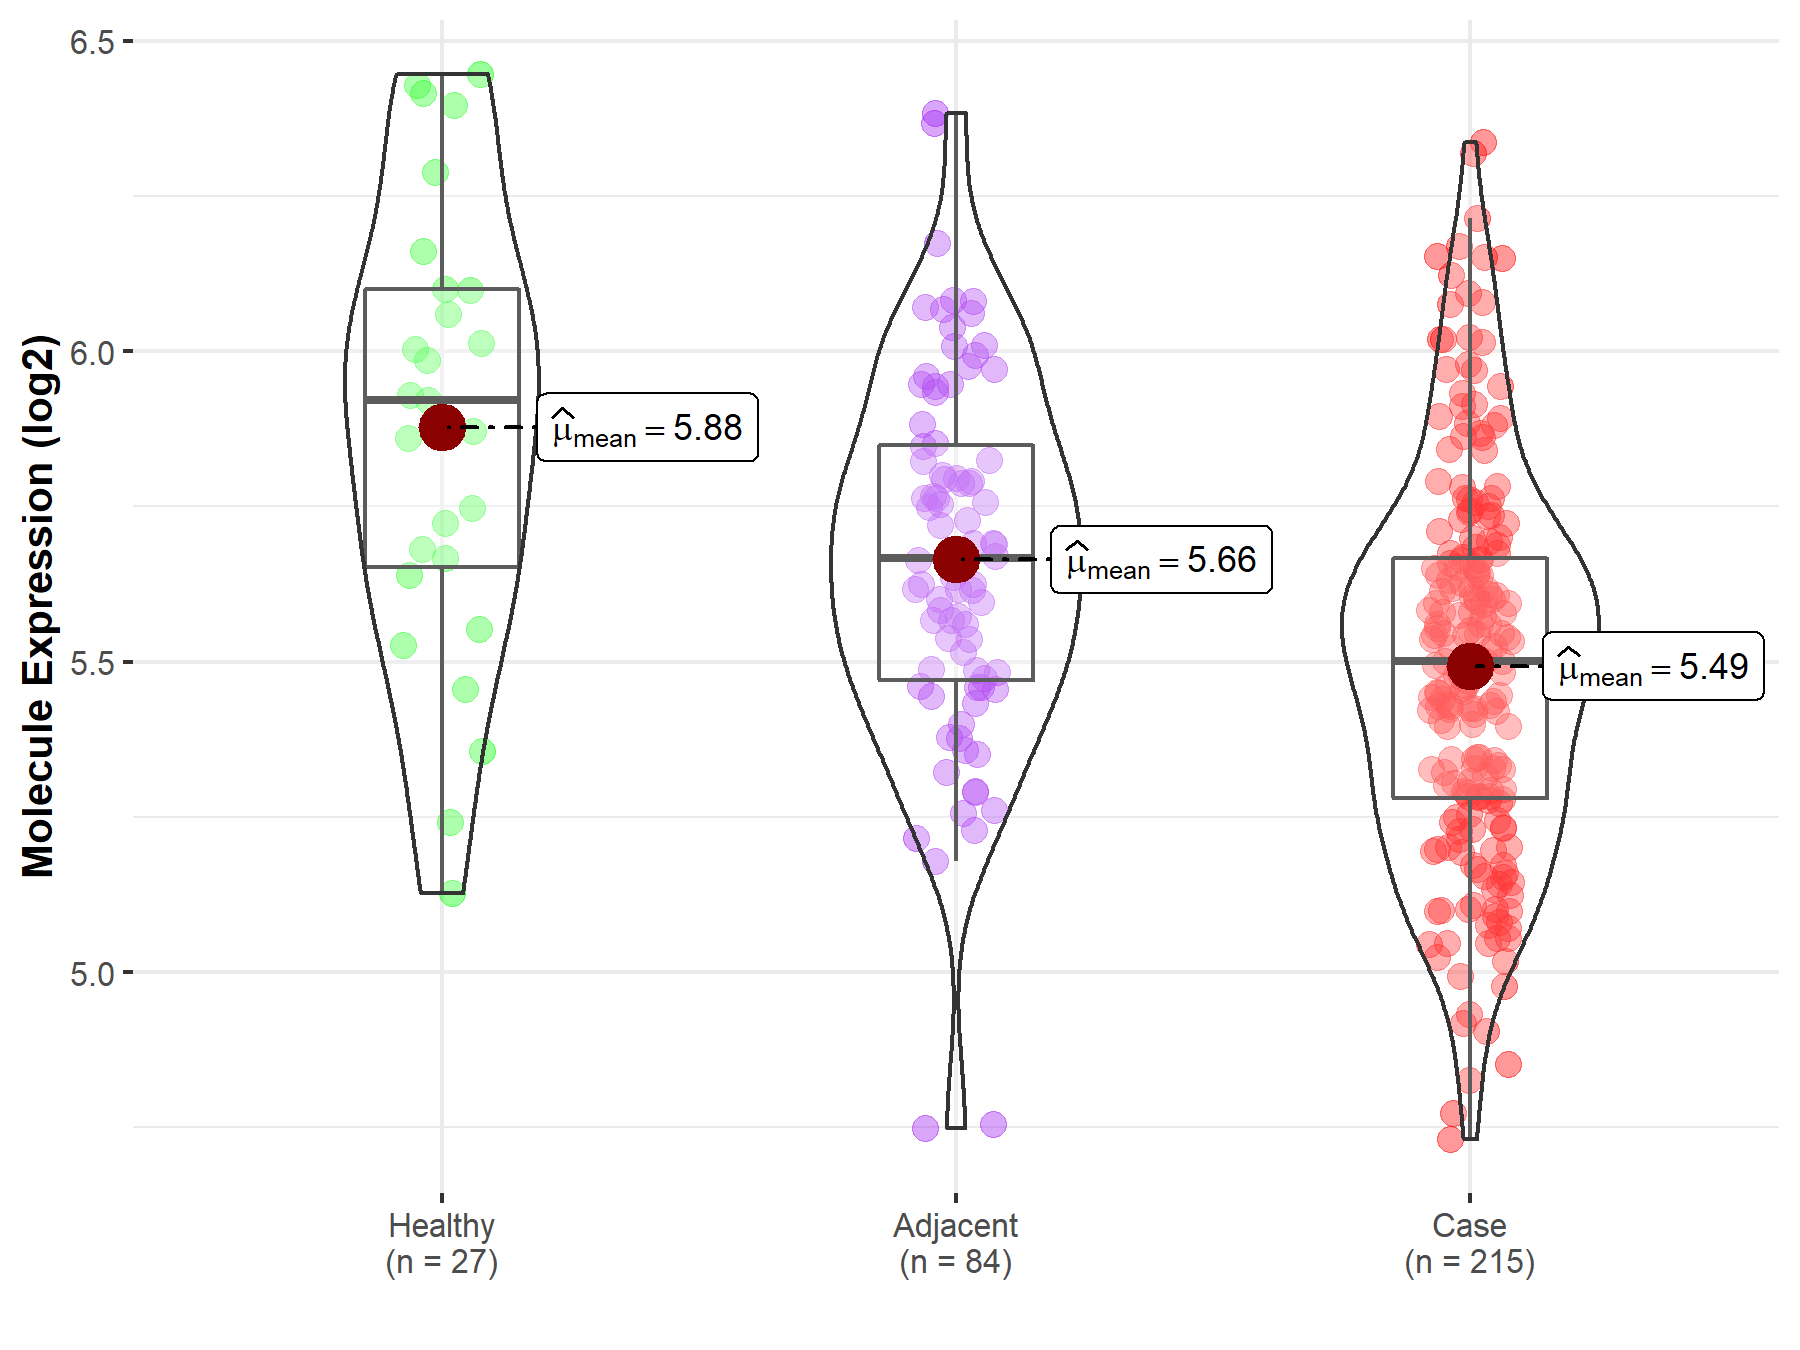
| The Expression Level of Disease Section Compare with the Healthy Individual Tissue | p-value: 1.05E-05; Fold-change: -4.20E-01; Z-score: -1.15E+00 | |
| The Expression Level of Disease Section Compare with the Adjacent Tissue | p-value: 1.96E-05; Fold-change: -1.66E-01; Z-score: -5.55E-01 | |
|
Molecule expression in the normal tissue adjacent to the diseased tissue of patients
Molecule expression in the diseased tissue of patients
Molecule expression in the normal tissue of healthy individuals
|
||
| Disease-specific Molecule Abundances |

|
Click to View the Clearer Original Diagram |
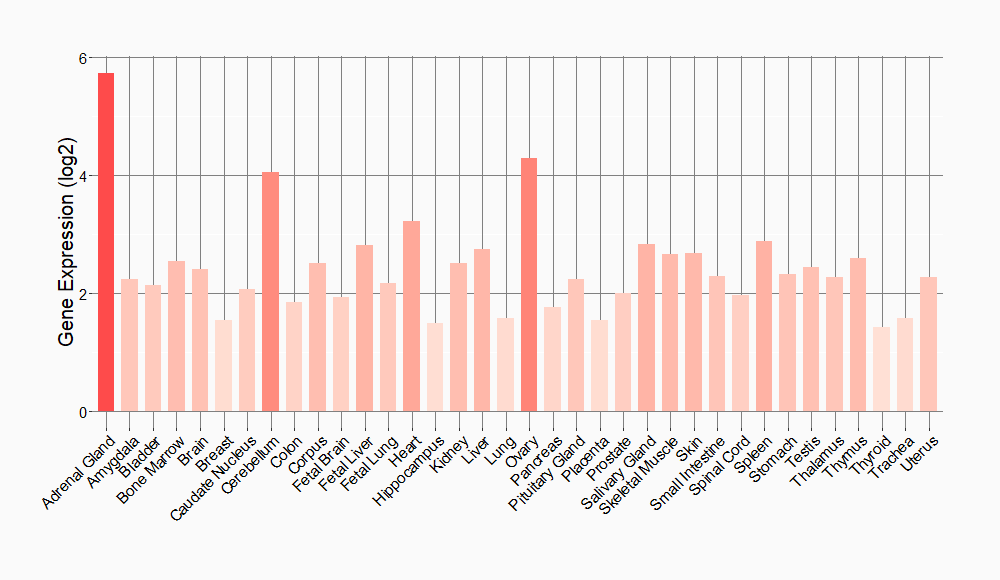
Tissue-specific Molecule Abundances in Healthy Individuals


|
||
References
If you find any error in data or bug in web service, please kindly report it to Dr. Sun and Dr. Yu.
