Molecule Information
General Information of the Molecule (ID: Mol00650)
| Name |
Serum response factor (SRF)
,Homo sapiens
|
||||
|---|---|---|---|---|---|
| Synonyms |
SRF
Click to Show/Hide
|
||||
| Molecule Type |
Protein
|
||||
| Gene Name |
SRF
|
||||
| Gene ID | |||||
| Location |
chr6:43171269-43181506[+]
|
||||
| Sequence |
MLPTQAGAAAALGRGSALGGSLNRTPTGRPGGGGGTRGANGGRVPGNGAGLGPGRLEREA
AAAAATTPAPTAGALYSGSEGDSESGEEEELGAERRGLKRSLSEMEIGMVVGGPEASAAA TGGYGPVSGAVSGAKPGKKTRGRVKIKMEFIDNKLRRYTTFSKRKTGIMKKAYELSTLTG TQVLLLVASETGHVYTFATRKLQPMITSETGKALIQTCLNSPDSPPRSDPTTDQRMSATG FEETDLTYQVSESDSSGETKDTLKPAFTVTNLPGTTSTIQTAPSTSTTMQVSSGPSFPIT NYLAPVSASVSPSAVSSANGTVLKSTGSGPVSSGGLMQLPTSFTLMPGGAVAQQVPVQAI QVHQAPQQASPSRDSSTDLTQTSSSGTVTLPATIMTSSVPTTVGGHMMYPSPHAVMYAPT SGLGDGSLTVLNAFSQAPSTMQVSHSQVQEPGGVPQVFLTASSGTVQIPVSAVQLHQMAV IGQQAGSSSNLTELQVVNLDTAHSTKSE Click to Show/Hide
|
||||
| 3D-structure |
|
||||
| Function |
SRF is a transcription factor that binds to the serum response element (SRE), a short sequence of dyad symmetry located 300 bp to the 5' of the site of transcription initiation of some genes (such as FOS). Together with MRTFA transcription coactivator, controls expression of genes regulating the cytoskeleton during development, morphogenesis and cell migration. The SRF-MRTFA complex activity responds to Rho GTPase-induced changes in cellular globular actin (G-actin) concentration, thereby coupling cytoskeletal gene expression to cytoskeletal dynamics. Required for cardiac differentiation and maturation.
Click to Show/Hide
|
||||
| Uniprot ID | |||||
| Ensembl ID | |||||
| HGNC ID | |||||
| Click to Show/Hide the Complete Species Lineage | |||||
Type(s) of Resistant Mechanism of This Molecule
Drug Resistance Data Categorized by Drug
Approved Drug(s)
1 drug(s) in total
| Drug Sensitivity Data Categorized by Their Corresponding Mechanisms | ||||
|
|
||||
| Disease Class: Hepatocellular carcinoma [ICD-11: 2C12.2] | [1] | |||
| Sensitive Disease | Hepatocellular carcinoma [ICD-11: 2C12.2] | |||
| Sensitive Drug | Sorafenib | |||
| Molecule Alteration | Expression | Down-regulation |
||
| Differential expression of the molecule in resistant disease | ||||
| Classification of Disease | Liver cancer [ICD-11: 2C12] | |||
| The Specified Disease | Liver cancer | |||
| The Studied Tissue | Liver tissue | |||
| The Expression Level of Disease Section Compare with the Healthy Individual Tissue | p-value: 3.01E-01 Fold-change: -1.02E-02 Z-score: -1.04E+00 |
|||
| Experimental Note | Revealed Based on the Cell Line Data | |||
| Cell Pathway Regulation | Angiogenic potential | Inhibition | hsa04370 | |
| Cell apoptosis | Activation | hsa04210 | ||
| Tumorigenic properties | Inhibition | hsa05200 | ||
| In Vitro Model | HepG2 cells | Liver | Homo sapiens (Human) | CVCL_0027 |
| Hep3B cells | Liver | Homo sapiens (Human) | CVCL_0326 | |
| Skhep1 cells | Liver | Homo sapiens (Human) | CVCL_0525 | |
| In Vivo Model | Nude mouse xenograft model | Mus musculus | ||
| Experiment for Molecule Alteration |
Western blot analysis | |||
| Experiment for Drug Resistance |
MTS assay | |||
| Mechanism Description | ADAM10 (a distintegrin and metalloprotease family), serum response factor (SRF), and insulin-like growth factor 1 receptor (Igf1R) that promote tumorigenesis were validated as targets of miR-122 and were repressed by the microRNA. Ectopic expression of miR-122 in nonexpressing HepG2, Hep3B, and Sk-Hep-1 cells reversed their tumorigenic properties such as growth, replication potential, clonogenic survival, anchorage-independent growth, migration, invasion, and tumor formation in nude mice. | |||
Disease- and Tissue-specific Abundances of This Molecule
ICD Disease Classification 02

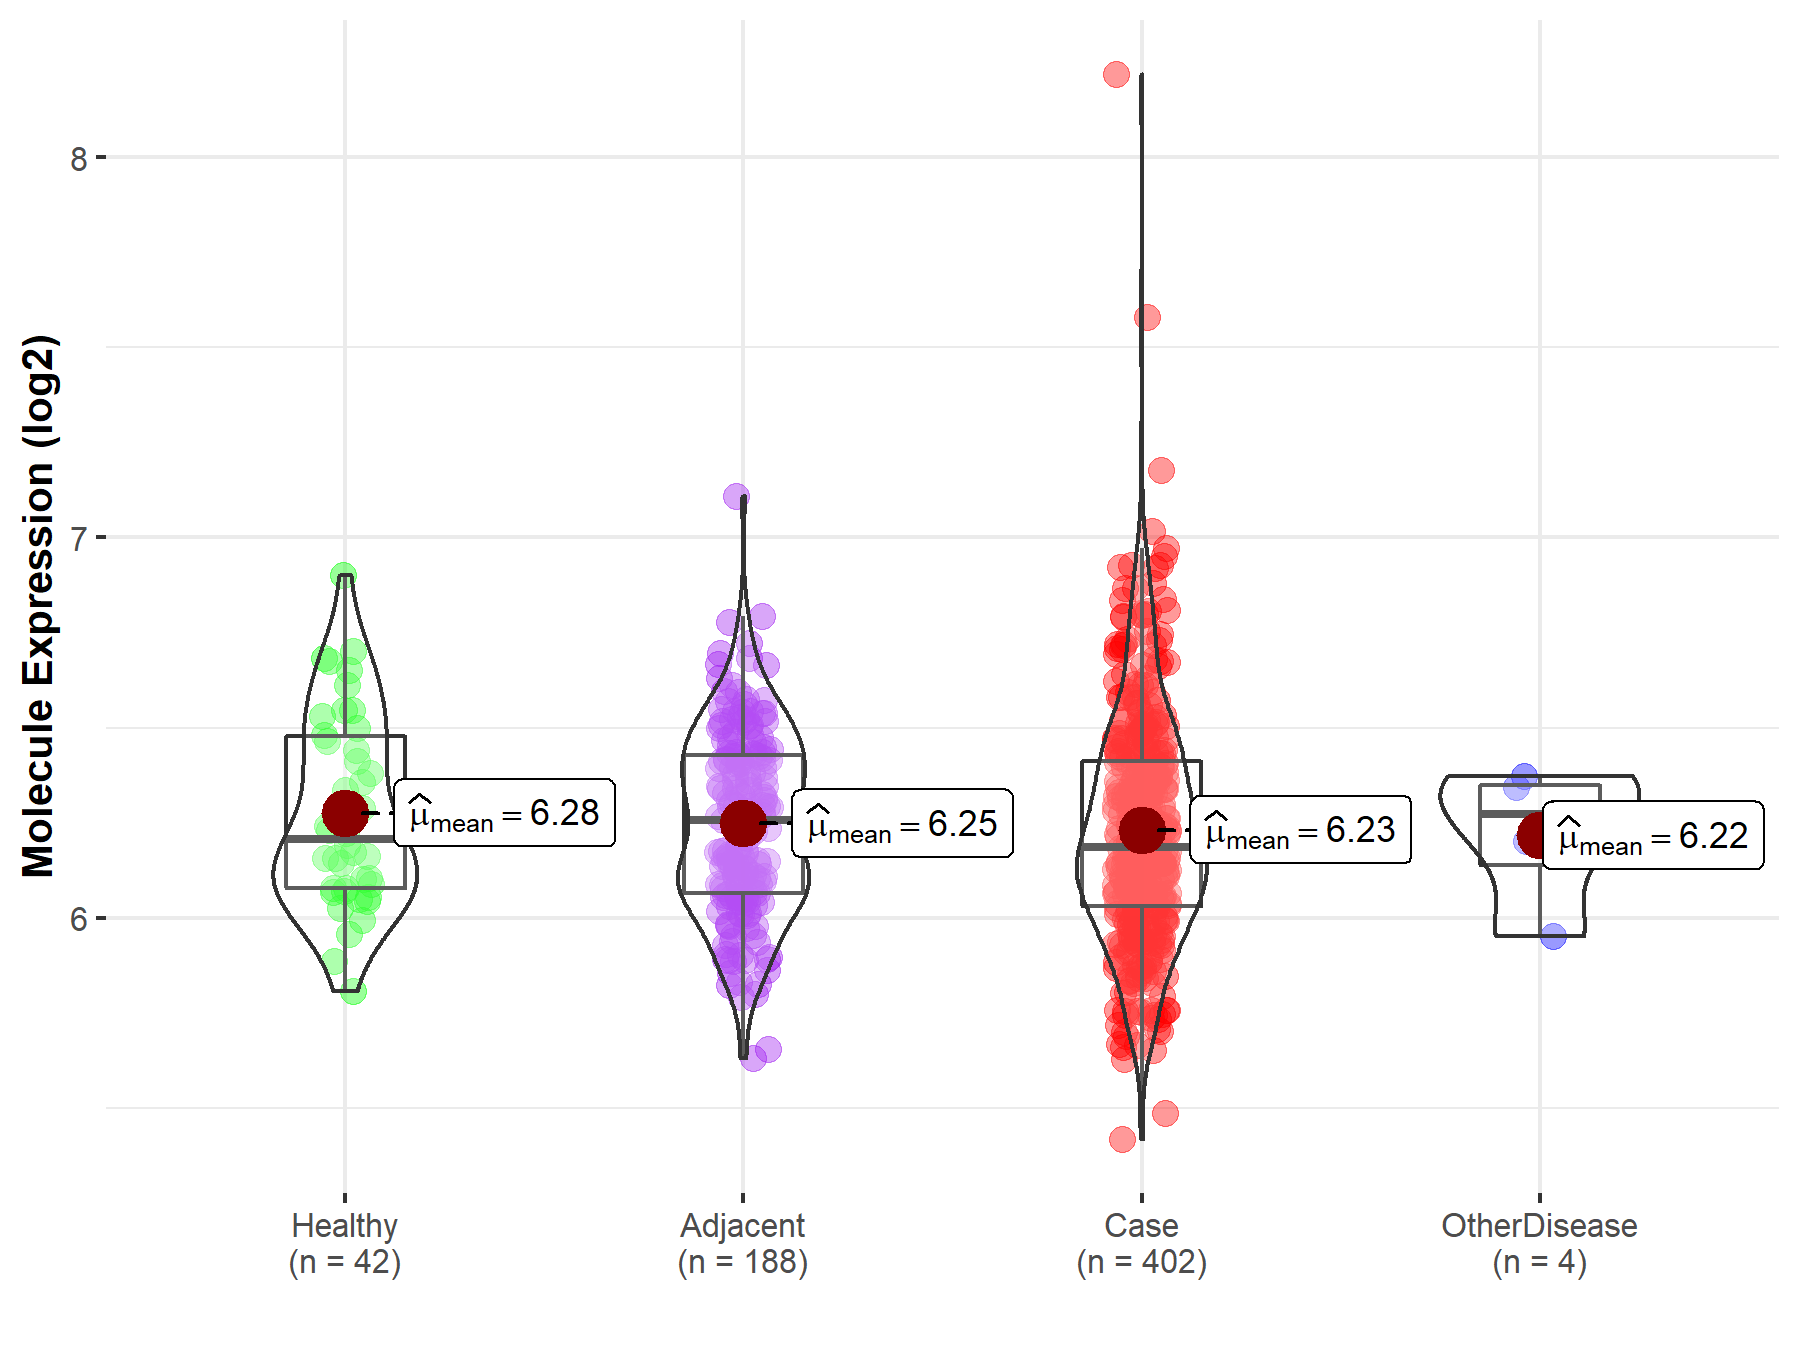
| Differential expression of molecule in resistant diseases | ||
| The Studied Tissue | Liver | |
| The Specified Disease | Liver cancer | |
| The Expression Level of Disease Section Compare with the Healthy Individual Tissue | p-value: 3.01E-01; Fold-change: -2.10E-02; Z-score: -8.24E-02 | |
| The Expression Level of Disease Section Compare with the Adjacent Tissue | p-value: 4.79E-01; Fold-change: -6.96E-02; Z-score: -2.88E-01 | |
| The Expression Level of Disease Section Compare with the Other Disease Section | p-value: 8.87E-01; Fold-change: -8.59E-02; Z-score: -4.47E-01 | |
|
Molecule expression in the normal tissue adjacent to the diseased tissue of patients
Molecule expression in the diseased tissue of patients
Molecule expression in the normal tissue of healthy individuals
Molecule expression in tissue other than the diseased tissue of patients
|
||
| Disease-specific Molecule Abundances |

|
Click to View the Clearer Original Diagram |
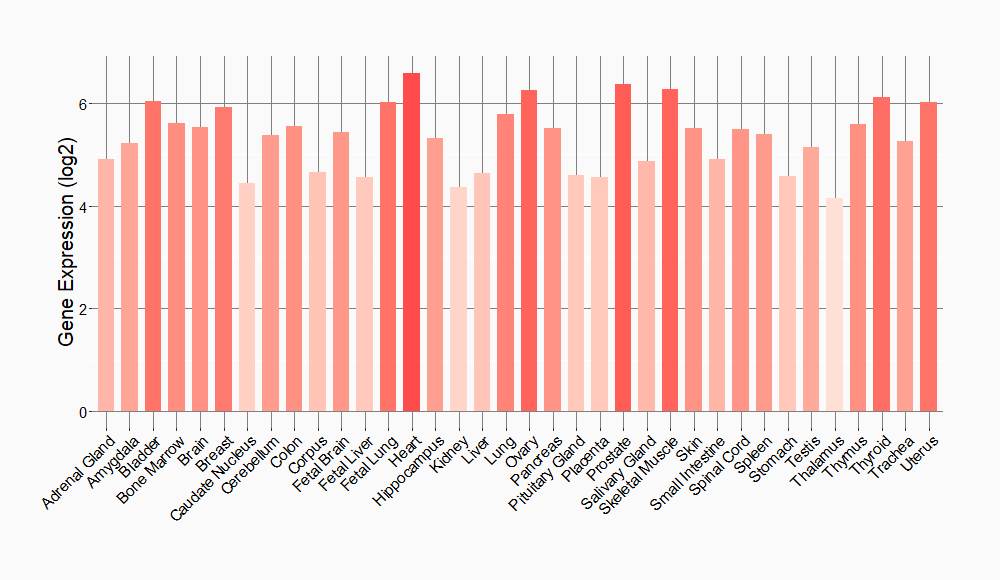
Tissue-specific Molecule Abundances in Healthy Individuals


|
||
References
If you find any error in data or bug in web service, please kindly report it to Dr. Sun and Dr. Yu.
