Molecule Information
General Information of the Molecule (ID: Mol00649)
| Name |
SRC kinase signaling inhibitor 1 (SRCIN1)
,Homo sapiens
|
||||
|---|---|---|---|---|---|
| Synonyms |
SNAP-25-interacting protein; SNIP; p130Cas-associated protein; p140Cap; KIAA1684; P140; SNIP
Click to Show/Hide
|
||||
| Molecule Type |
Protein
|
||||
| Gene Name |
SRCIN1
|
||||
| Gene ID | |||||
| Location |
chr17:38530031-38605952[-]
|
||||
| Sequence |
MGNAPSQDPERSSPPMLSADDAEYPREYRTLGGGGGGGSGGRRFSNVGLVHTSERRHTVI
AAQSLEALSGLQKADADRKRDAFMDHLKSKYPQHALALRGQQDRMREQPNYWSFKTRSSR HTQGAQPGLADQAAKLSYASAESLETMSEAELPLGFSRMNRFRQSLPLSRSASQTKLRSP GVLFLQFGEETRRVHITHEVSSLDTLHALIAHMFPQKLTMGMLKSPNTAILIKDEARNVF YELEDVRDIQDRSIIKIYRKEPLYAAFPGSHLTNGDLRREMVYASRESSPTRRLNNLSPA PHLASGSPPPGLPSGLPSGLQSGSPSRSRLSYAGGRPPSYAGSPVHHAAERLGGAPAAQG VSPSPSAILERRDVKPDEDLASKAGGMVLVKGEGLYADPYGLLHEGRLSLAAAAGDPFAY PGAGGLYKRGSVRSLSTYSAAALQSDLEDSLYKAAGGGGPLYGDGYGFRLPPSSPQKLAD VAAPPGGPPPPHSPYSGPPSRGSPVRQSFRKDSGSSSVFAESPGGKTRSAGSASTAGAPP SELFPGPGERSLVGFGPPVPAKDTETRERMEAMEKQIASLTGLVQSALLRGSEPETPSEK IEGSNGAATPSAPCGSGGRSSGATPVSGPPPPSASSTPAGQPTAVSRLQMQLHLRGLQNS ASDLRGQLQQLRKLQLQNQESVRALLKRTEAELSMRVSEAARRQEDPLQRQRTLVEEERL RYLNDEELITQQLNDLEKSVEKIQRDVSHNHRLVPGPELEEKALVLKQLGETLTELKAHF PGLQSKMRVVLRVEVEAVKFLKEEPQRLDGLLKRCRGVTDTLAQIRRQVDEGVWPPPNNL LSQSPKKVTAETDFNKSVDFEMPPPSPPLNLHELSGPAEGASLTPKGGNPTKGLDTPGKR SVDKAVSVEAAERDWEEKRAALTQYSAKDINRLLEETQAELLKAIPDLDCASKAHPGPAP TPDHKPPKAPHGQKAAPRTEPSGRRGSDELTVPRYRTEKPSKSPPPPPPRRSFPSSHGLT TTRTGEVVVTSKKDSAFIKKAESEELEVQKPQVKLRRAVSEVARPASTPPIMASAIKDED DEDRIIAELESGGGSVPPMKVVTPGASRLKAAQGQAGSPDKSKHGKQRAEYMRIQAQQQA TKPSKEMSGSNETSSPVSEKPSASRTSIPVLTSFGARNSSISF Click to Show/Hide
|
||||
| Function |
Acts as a negative regulator of SRC by activating CSK which inhibits SRC activity and downstream signaling, leading to impaired cell spreading and migration. Regulates dendritic spine morphology. Involved in calcium-dependent exocytosis. May play a role in neurotransmitter release or synapse maintenance.
Click to Show/Hide
|
||||
| Uniprot ID | |||||
| Ensembl ID | |||||
| HGNC ID | |||||
| Click to Show/Hide the Complete Species Lineage | |||||
Type(s) of Resistant Mechanism of This Molecule
Drug Resistance Data Categorized by Drug
Approved Drug(s)
1 drug(s) in total
| Drug Sensitivity Data Categorized by Their Corresponding Mechanisms | ||||
|
|
||||
| Disease Class: Breast cancer [ICD-11: 2C60.3] | [1] | |||
| Sensitive Disease | Breast cancer [ICD-11: 2C60.3] | |||
| Sensitive Drug | Docetaxel | |||
| Molecule Alteration | Expression | Down-regulation |
||
| Experimental Note | Revealed Based on the Cell Line Data | |||
| Cell Pathway Regulation | Cell apoptosis | Inhibition | hsa04210 | |
| Cell invasion | Activation | hsa05200 | ||
| Cell migration | Activation | hsa04670 | ||
| Cell proliferation | Activation | hsa05200 | ||
| In Vitro Model | MCF-7 cells | Breast | Homo sapiens (Human) | CVCL_0031 |
| HBL-100 cells | Breast | Homo sapiens (Human) | CVCL_4362 | |
| MCF-7/Doc cells | Breast | Homo sapiens (Human) | CVCL_0031 | |
| Experiment for Molecule Alteration |
Dual luciferase assay; Western blot analysis | |||
| Experiment for Drug Resistance |
CCK8 assay | |||
| Mechanism Description | miR346 promotes the biological function of breast cancer cells by targeting SRCIN1 and reduces chemosensitivity to docetaxel. Overexpression of miR346 promoted cell proliferation, colony formation, migration and invasion, and reduced apoptosis, sensitivity to Docetaxel. | |||
Disease- and Tissue-specific Abundances of This Molecule
ICD Disease Classification 02

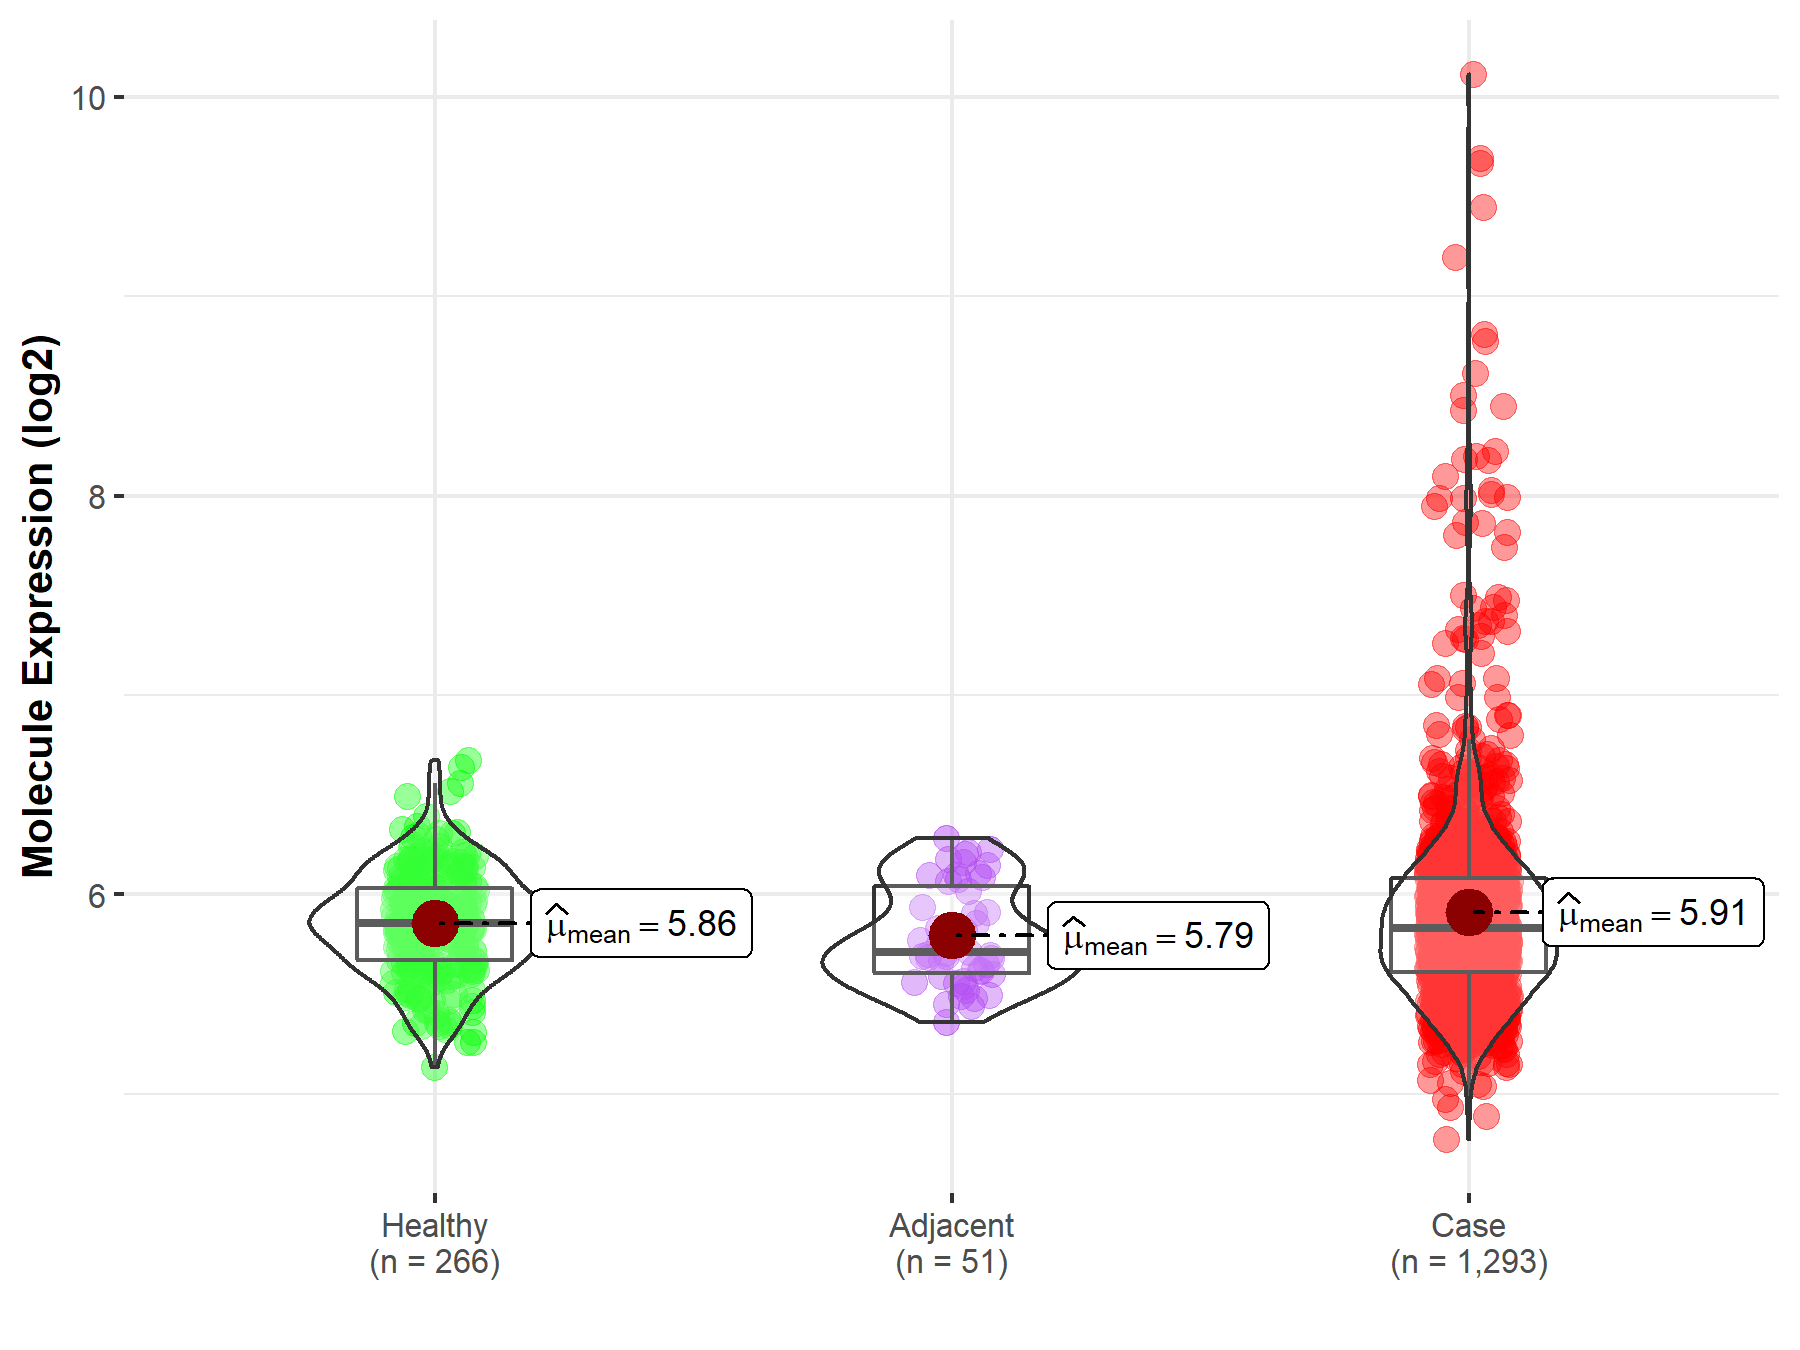
| Differential expression of molecule in resistant diseases | ||
| The Studied Tissue | Breast tissue | |
| The Specified Disease | Breast cancer | |
| The Expression Level of Disease Section Compare with the Healthy Individual Tissue | p-value: 1.31E-02; Fold-change: -2.60E-02; Z-score: -9.84E-02 | |
| The Expression Level of Disease Section Compare with the Adjacent Tissue | p-value: 3.20E-03; Fold-change: 1.19E-01; Z-score: 4.80E-01 | |
|
Molecule expression in the normal tissue adjacent to the diseased tissue of patients
Molecule expression in the diseased tissue of patients
Molecule expression in the normal tissue of healthy individuals
|
||
| Disease-specific Molecule Abundances |

|
Click to View the Clearer Original Diagram |
References
If you find any error in data or bug in web service, please kindly report it to Dr. Sun and Dr. Yu.
