Molecule Information
General Information of the Molecule (ID: Mol00646)
| Name |
Transcription factor Sp1 (SP1)
,Homo sapiens
|
||||
|---|---|---|---|---|---|
| Synonyms |
TSFP1
Click to Show/Hide
|
||||
| Molecule Type |
Protein
|
||||
| Gene Name |
SP1
|
||||
| Gene ID | |||||
| Location |
chr12:53380176-53416446[+]
|
||||
| Sequence |
MSDQDHSMDEMTAVVKIEKGVGGNNGGNGNGGGAFSQARSSSTGSSSSTGGGGQESQPSP
LALLAATCSRIESPNENSNNSQGPSQSGGTGELDLTATQLSQGANGWQIISSSSGATPTS KEQSGSSTNGSNGSESSKNRTVSGGQYVVAAAPNLQNQQVLTGLPGVMPNIQYQVIPQFQ TVDGQQLQFAATGAQVQQDGSGQIQIIPGANQQIITNRGSGGNIIAAMPNLLQQAVPLQG LANNVLSGQTQYVTNVPVALNGNITLLPVNSVSAATLTPSSQAVTISSSGSQESGSQPVT SGTTISSASLVSSQASSSSFFTNANSYSTTTTTSNMGIMNFTTSGSSGTNSQGQTPQRVS GLQGSDALNIQQNQTSGGSLQAGQQKEGEQNQQTQQQQILIQPQLVQGGQALQALQAAPL SGQTFTTQAISQETLQNLQLQAVPNSGPIIIRTPTVGPNGQVSWQTLQLQNLQVQNPQAQ TITLAPMQGVSLGQTSSSNTTLTPIASAASIPAGTVTVNAAQLSSMPGLQTINLSALGTS GIQVHPIQGLPLAIANAPGDHGAQLGLHGAGGDGIHDDTAGGEEGENSPDAQPQAGRRTR REACTCPYCKDSEGRGSGDPGKKKQHICHIQGCGKVYGKTSHLRAHLRWHTGERPFMCTW SYCGKRFTRSDELQRHKRTHTGEKKFACPECPKRFMRSDHLSKHIKTHQNKKGGPGVALS VGTLPLDSGAGSEGSGTATPSALITTNMVAMEAICPEGIARLANSGINVMQVADLQSINI SGNGF Click to Show/Hide
|
||||
| 3D-structure |
|
||||
| Function |
Transcription factor that can activate or repress transcription in response to physiological and pathological stimuli. Binds with high affinity to GC-rich motifs and regulates the expression of a large number of genes involved in a variety of processes such as cell growth, apoptosis, differentiation and immune responses. Highly regulated by post-translational modifications (phosphorylations, sumoylation, proteolytic cleavage, glycosylation and acetylation). Binds also the PDGFR-alpha G-box promoter. May have a role in modulating the cellular response to DNA damage. Implicated in chromatin remodeling. Plays an essential role in the regulation of FE65 gene expression. In complex with ATF7IP, maintains telomerase activity in cancer cells by inducing TERT and TERC gene expression. Isoform 3 is a stronger activator of transcription than isoform 1. Positively regulates the transcription of the core clock component ARNTL/BMAL1. Plays a role in the recruitment of SMARCA4/BRG1 on the c-FOS promoter. Plays a role in protecting cells against oxidative stress following brain injury by regulating the expression of RNF112.
Click to Show/Hide
|
||||
| Uniprot ID | |||||
| Ensembl ID | |||||
| HGNC ID | |||||
| Click to Show/Hide the Complete Species Lineage | |||||
Type(s) of Resistant Mechanism of This Molecule
Drug Resistance Data Categorized by Drug
Approved Drug(s)
2 drug(s) in total
| Drug Resistance Data Categorized by Their Corresponding Mechanisms | ||||
|
|
||||
| Disease Class: Malignant glioma [ICD-11: 2A00.2] | [1] | |||
| Resistant Disease | Malignant glioma [ICD-11: 2A00.2] | |||
| Resistant Drug | Temozolomide | |||
| Molecule Alteration | Expression | Up-regulation |
||
| Differential expression of the molecule in resistant disease | ||||
| Classification of Disease | Brain cancer [ICD-11: 2A00] | |||
| The Specified Disease | Brain cancer | |||
| The Studied Tissue | Nervous tissue | |||
| The Expression Level of Disease Section Compare with the Healthy Individual Tissue | p-value: 5.59E-26 Fold-change: 7.80E-02 Z-score: 1.10E+01 |
|||
| Experimental Note | Identified from the Human Clinical Data | |||
| Cell Pathway Regulation | DNA damage repair signaling pathway | Activation | hsa03410 | |
| In Vitro Model | U251 cells | Brain | Homo sapiens (Human) | CVCL_0021 |
| LN229 cells | Brain | Homo sapiens (Human) | CVCL_0393 | |
| U373 cells | Brain | Homo sapiens (Human) | CVCL_2219 | |
| U118 cells | Brain | Homo sapiens (Human) | CVCL_0633 | |
| NHA | Brain | Homo sapiens (Human) | N.A. | |
| Experiment for Molecule Alteration |
Western blot analysis | |||
| Experiment for Drug Resistance |
MTT assay; BrdU incorporation assay | |||
| Mechanism Description | XIST was inversely correlated with miR29c, positively correlated with PS1, positively related with MGMT. XIST can inhibit miR29c expression by directly binding to miR29c and subsequently up-regulate the expression of SP1 and MGMT to promote the chemoresistance of glioma cells to TMZ. | |||
| Drug Sensitivity Data Categorized by Their Corresponding Mechanisms | ||||
|
|
||||
| Disease Class: Glioma [ICD-11: 2A00.1] | [2] | |||
| Sensitive Disease | Glioma [ICD-11: 2A00.1] | |||
| Sensitive Drug | Temozolomide | |||
| Molecule Alteration | Expression | Down-regulation |
||
| Differential expression of the molecule in resistant disease | ||||
| Classification of Disease | Brain cancer [ICD-11: 2A00] | |||
| The Specified Disease | Neuroectodermal tumor | |||
| The Studied Tissue | Brainstem tissue | |||
| The Expression Level of Disease Section Compare with the Healthy Individual Tissue | p-value: 7.21E-02 Fold-change: -3.62E-02 Z-score: -1.96E+00 |
|||
| Experimental Note | Identified from the Human Clinical Data | |||
| Cell Pathway Regulation | Cell apoptosis | Activation | hsa04210 | |
| Cell invasion | Inhibition | hsa05200 | ||
| Cell proliferation | Inhibition | hsa05200 | ||
| DNA mismatch repair pathway | Regulation | N.A. | ||
| In Vitro Model | U251 cells | Brain | Homo sapiens (Human) | CVCL_0021 |
| Experiment for Molecule Alteration |
Western blot analysis | |||
| Experiment for Drug Resistance |
MTT assay; Flow cytometry assay | |||
| Mechanism Description | Ectopic expression of miR-29c increased TMZ sensitivity by inhibiting cell growth and promoting apoptosis in U251/TR cells. | |||
| Drug Sensitivity Data Categorized by Their Corresponding Mechanisms | ||||
|
|
||||
| Disease Class: Ovarian cancer [ICD-11: 2C73.0] | [3] | |||
| Sensitive Disease | Ovarian cancer [ICD-11: 2C73.0] | |||
| Sensitive Drug | Paclitaxel | |||
| Molecule Alteration | Expression | Down-regulation |
||
| Experimental Note | Identified from the Human Clinical Data | |||
| In Vitro Model | MCF-7 cells | Breast | Homo sapiens (Human) | CVCL_0031 |
| SkOV3 cells | Ovary | Homo sapiens (Human) | CVCL_0532 | |
| A2780 cells | Ovary | Homo sapiens (Human) | CVCL_0134 | |
| MCF-7/ADM cells | Breast | Homo sapiens (Human) | CVCL_0031 | |
| A2780/PTX cells | Ovary | Homo sapiens (Human) | CVCL_IJ13 | |
| HOEC cells | Ovary | Homo sapiens (Human) | N.A. | |
| SkOV3/PTX cells | Ovary | Homo sapiens (Human) | CVCL_HF69 | |
| In Vivo Model | Nude mouse xenograft model | Mus musculus | ||
| Experiment for Molecule Alteration |
Western blot analysis | |||
| Experiment for Drug Resistance |
MTT assay | |||
| Mechanism Description | miR-145 modulates the cellular response to anticancer drugs, Down-regulation of miR-145 is correlated with overexpression of Sp1 and Cdk6, Sp1 and Cdk6 are targets of miR-145, miR-145 downregulated P-gp and pRb through inhibition of Sp1 and Cdk6, miR-145 sensitized EOC cells to paclitaxel via Sp1 and Cdk6 inhibition, Overexpression of miR-145 enhanced paclitaxel sensitivity in vivo. | |||
Disease- and Tissue-specific Abundances of This Molecule
ICD Disease Classification 02

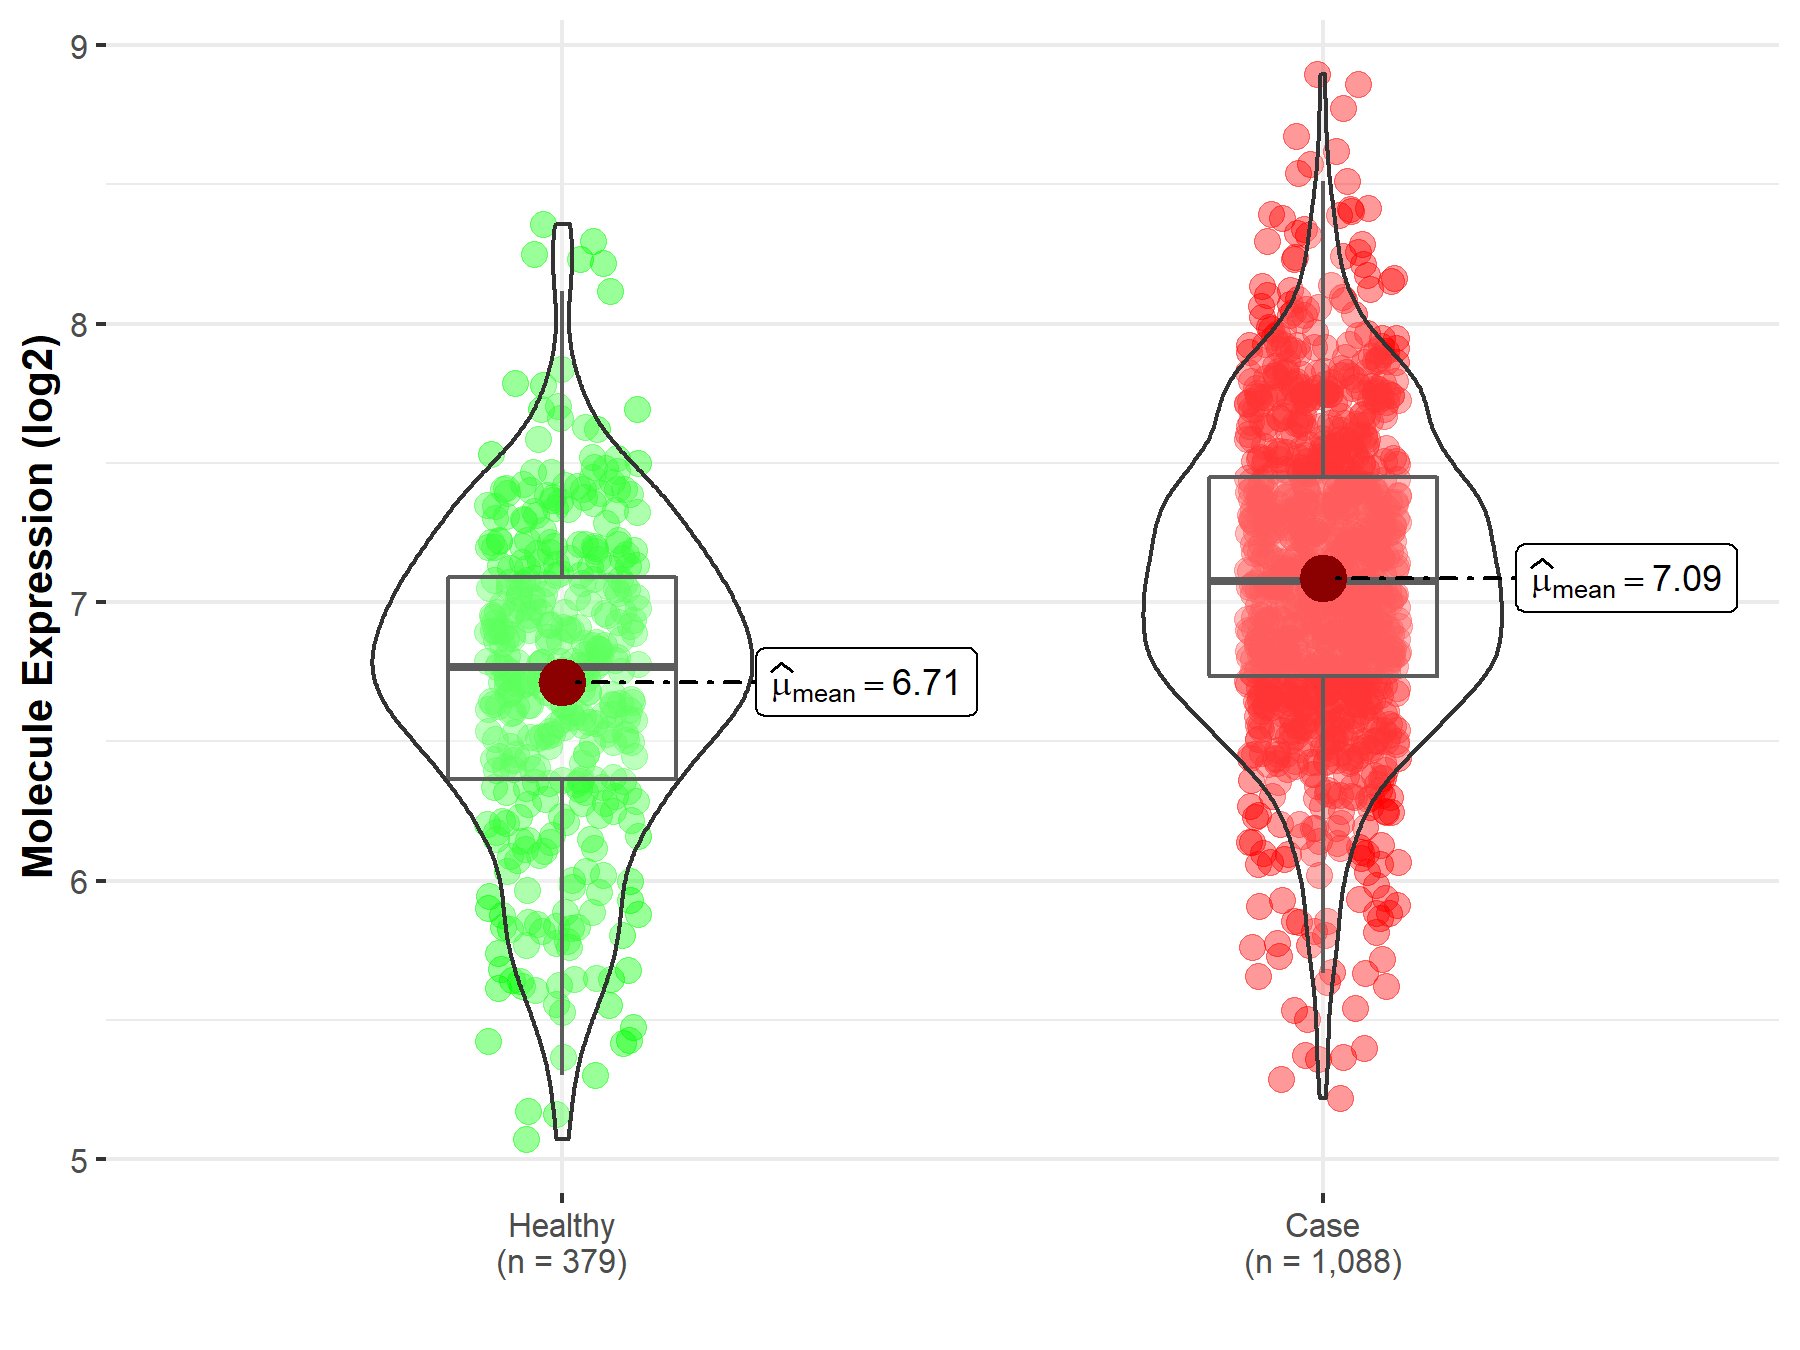
| Differential expression of molecule in resistant diseases | ||
| The Studied Tissue | Nervous tissue | |
| The Specified Disease | Brain cancer | |
| The Expression Level of Disease Section Compare with the Healthy Individual Tissue | p-value: 5.59E-26; Fold-change: 3.07E-01; Z-score: 5.36E-01 | |
|
Molecule expression in the diseased tissue of patients
Molecule expression in the normal tissue of healthy individuals
|
||
| Disease-specific Molecule Abundances |

|
Click to View the Clearer Original Diagram |
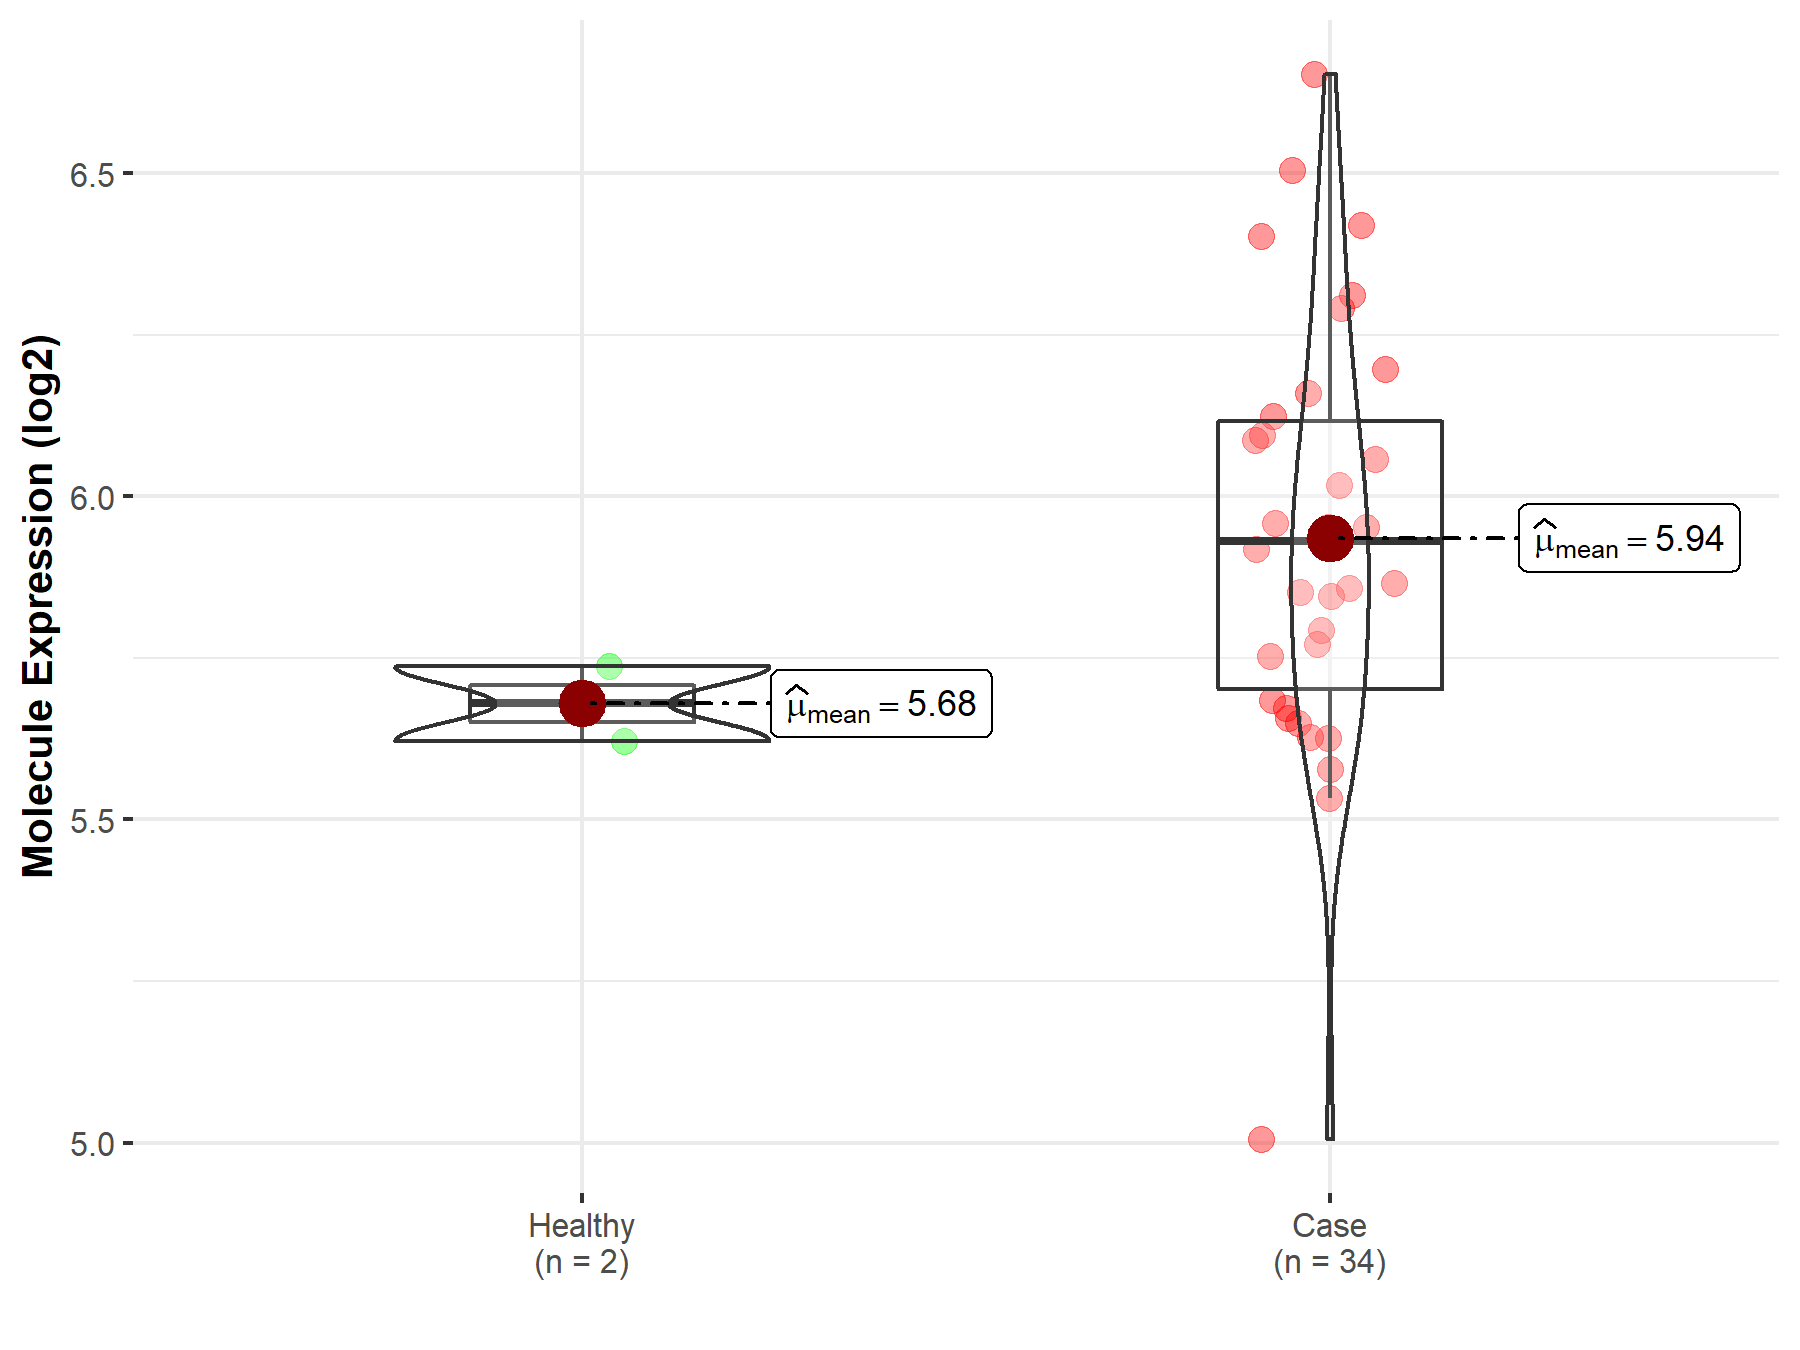
| The Studied Tissue | Brainstem tissue | |
| The Specified Disease | Glioma | |
| The Expression Level of Disease Section Compare with the Healthy Individual Tissue | p-value: 3.80E-02; Fold-change: 2.52E-01; Z-score: 3.08E+00 | |
|
Molecule expression in the diseased tissue of patients
Molecule expression in the normal tissue of healthy individuals
|
||
| Disease-specific Molecule Abundances |

|
Click to View the Clearer Original Diagram |
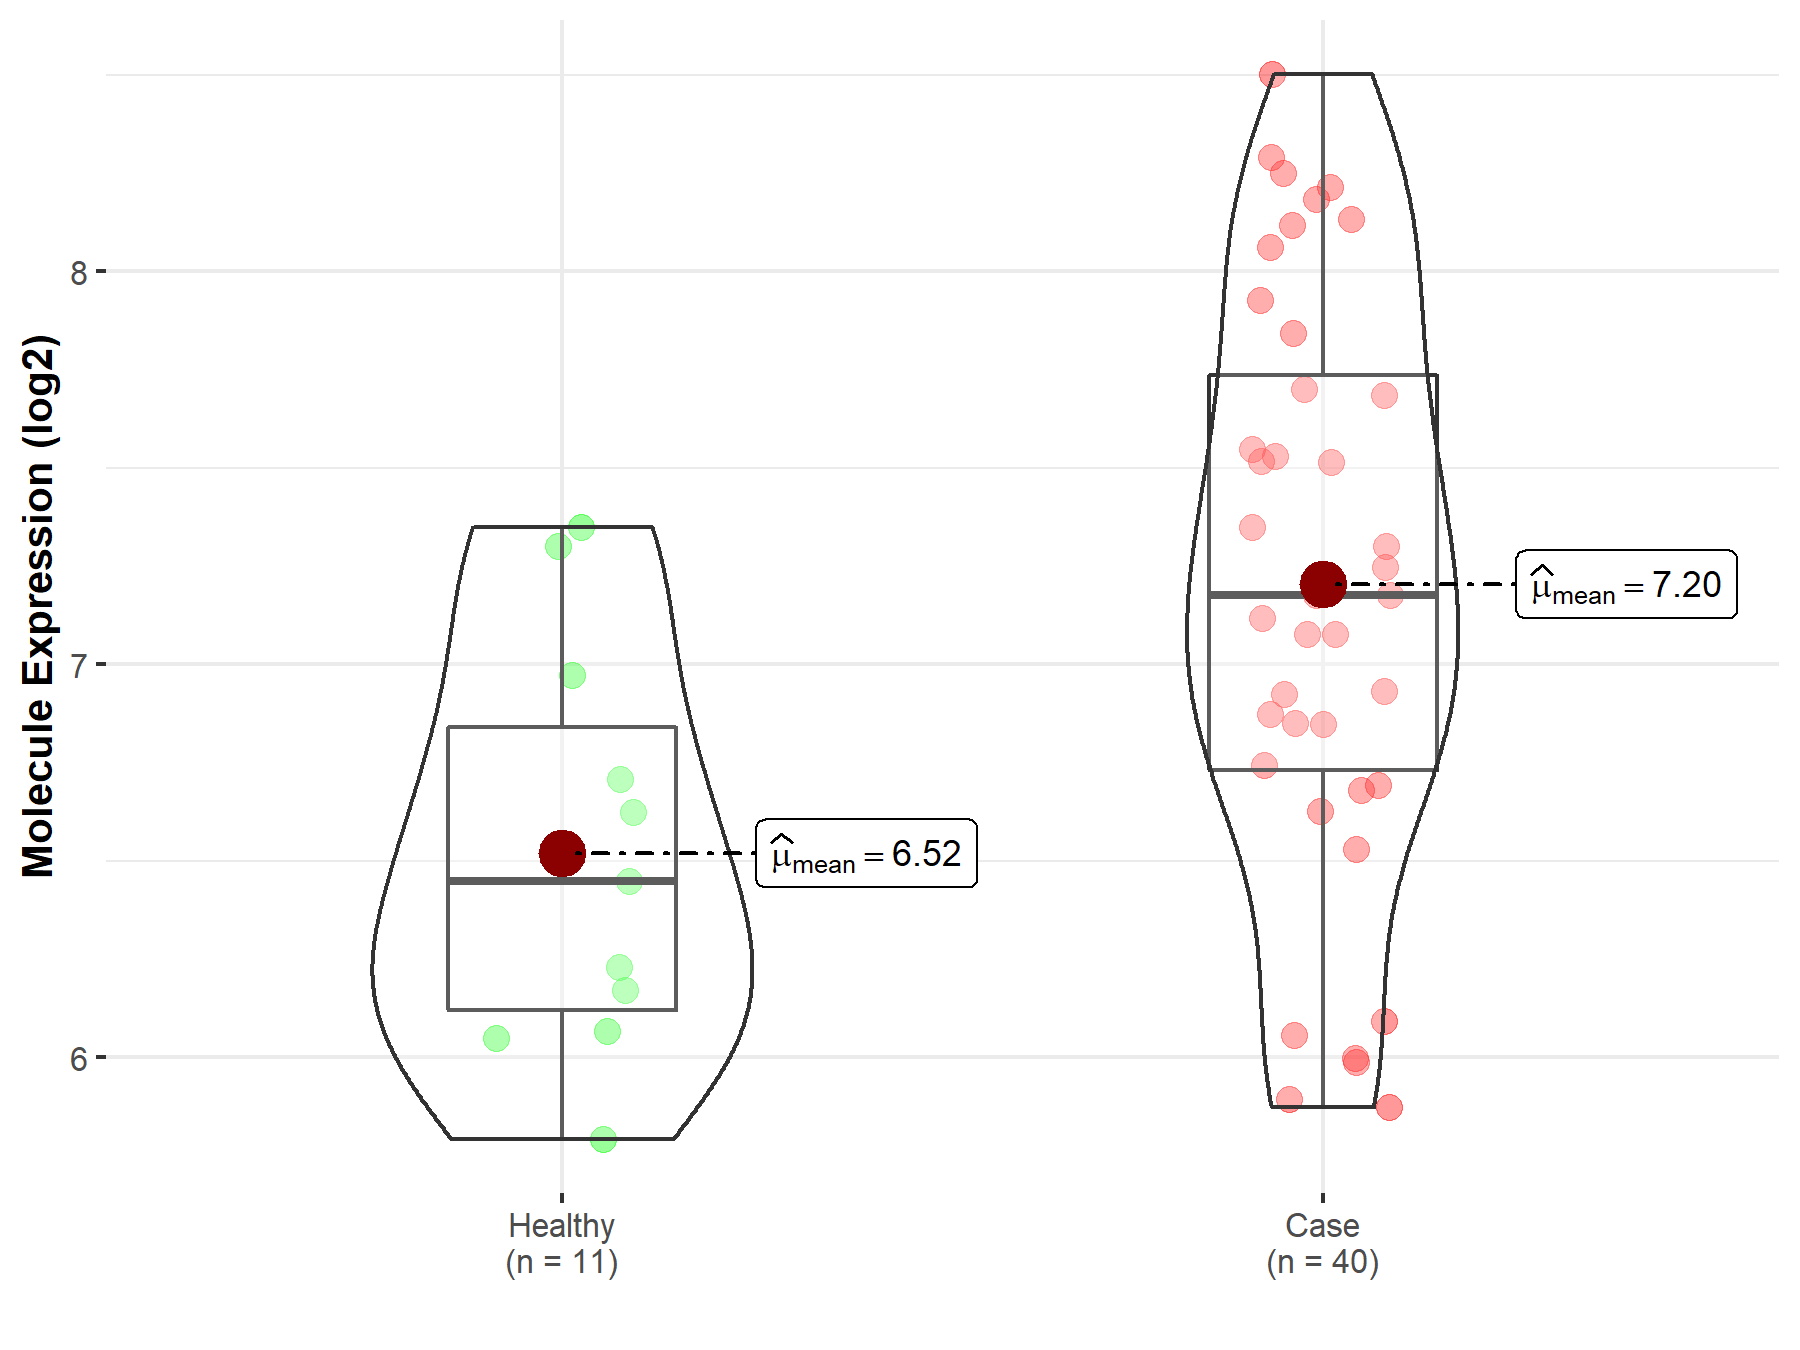
| The Studied Tissue | White matter | |
| The Specified Disease | Glioma | |
| The Expression Level of Disease Section Compare with the Healthy Individual Tissue | p-value: 2.02E-03; Fold-change: 7.28E-01; Z-score: 1.40E+00 | |
|
Molecule expression in the diseased tissue of patients
Molecule expression in the normal tissue of healthy individuals
|
||
| Disease-specific Molecule Abundances |

|
Click to View the Clearer Original Diagram |
| The Studied Tissue | Brainstem tissue | |
| The Specified Disease | Neuroectodermal tumor | |
| The Expression Level of Disease Section Compare with the Healthy Individual Tissue | p-value: 7.21E-02; Fold-change: -1.23E-01; Z-score: -5.16E-01 | |
|
Molecule expression in the diseased tissue of patients
Molecule expression in the normal tissue of healthy individuals
|
||
| Disease-specific Molecule Abundances |

|
Click to View the Clearer Original Diagram |
| Differential expression of molecule in resistant diseases | ||
| The Studied Tissue | Ovary | |
| The Specified Disease | Ovarian cancer | |
| The Expression Level of Disease Section Compare with the Healthy Individual Tissue | p-value: 7.36E-01; Fold-change: 5.65E-02; Z-score: 8.97E-02 | |
| The Expression Level of Disease Section Compare with the Adjacent Tissue | p-value: 3.44E-06; Fold-change: 8.21E-01; Z-score: 1.66E+00 | |
|
Molecule expression in the normal tissue adjacent to the diseased tissue of patients
Molecule expression in the diseased tissue of patients
Molecule expression in the normal tissue of healthy individuals
|
||
| Disease-specific Molecule Abundances |

|
Click to View the Clearer Original Diagram |
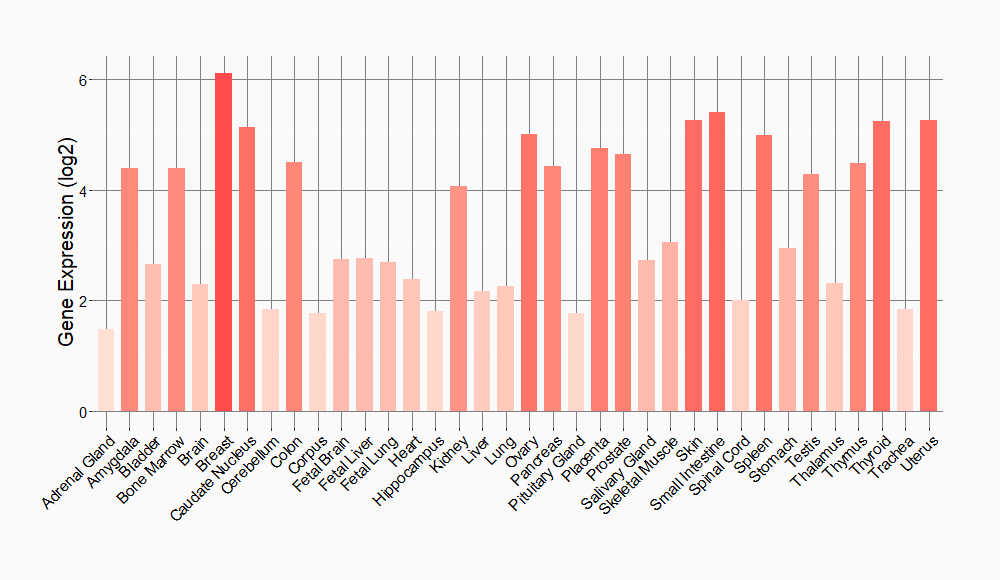
Tissue-specific Molecule Abundances in Healthy Individuals


|
||
References
If you find any error in data or bug in web service, please kindly report it to Dr. Sun and Dr. Yu.
