Molecule Information
General Information of the Molecule (ID: Mol00639)
| Name |
Zinc finger protein SNAI2 (SNAI2)
,Homo sapiens
|
||||
|---|---|---|---|---|---|
| Synonyms |
Neural crest transcription factor Slug; Protein snail homolog 2; SLUG; SLUGH
Click to Show/Hide
|
||||
| Molecule Type |
Protein
|
||||
| Gene Name |
SNAI2
|
||||
| Gene ID | |||||
| Location |
chr8:48917598-48921740[-]
|
||||
| Sequence |
MPRSFLVKKHFNASKKPNYSELDTHTVIISPYLYESYSMPVIPQPEILSSGAYSPITVWT
TAAPFHAQLPNGLSPLSGYSSSLGRVSPPPPSDTSSKDHSGSESPISDEEERLQSKLSDP HAIEAEKFQCNLCNKTYSTFSGLAKHKQLHCDAQSRKSFSCKYCDKEYVSLGALKMHIRT HTLPCVCKICGKAFSRPWLLQGHIRTHTGEKPFSCPHCNRAFADRSNLRAHLQTHSDVKK YQCKNCSKTFSRMSLLHKHEESGCCVAH Click to Show/Hide
|
||||
| Function |
Transcriptional repressor that modulates both activator-dependent and basal transcription. Involved in the generation and migration of neural crest cells. Plays a role in mediating RAF1-induced transcriptional repression of the TJ protein, occludin (OCLN) and subsequent oncogenic transformation of epithelial cells (By similarity). Represses BRCA2 expression by binding to its E2-box-containing silencer and recruiting CTBP1 and HDAC1 in breast cells. In epidermal keratinocytes, binds to the E-box in ITGA3 promoter and represses its transcription. Involved in the regulation of ITGB1 and ITGB4 expression and cell adhesion and proliferation in epidermal keratinocytes. Binds to E-box2 domain of BSG and activates its expression during TGFB1-induced epithelial-mesenchymal transition (EMT) in hepatocytes. Represses E-Cadherin/CDH1 transcription via E-box elements. Involved in osteoblast maturation. Binds to RUNX2 and SOC9 promoters and may act as a positive and negative transcription regulator, respectively, in osteoblasts. Binds to CXCL12 promoter via E-box regions in mesenchymal stem cells and osteoblasts. Plays an essential role in TWIST1-induced EMT and its ability to promote invasion and metastasis.
Click to Show/Hide
|
||||
| Uniprot ID | |||||
| Ensembl ID | |||||
| HGNC ID | |||||
| Click to Show/Hide the Complete Species Lineage | |||||
Type(s) of Resistant Mechanism of This Molecule
Drug Resistance Data Categorized by Drug
Approved Drug(s)
5 drug(s) in total
| Drug Resistance Data Categorized by Their Corresponding Mechanisms | ||||
|
|
||||
| Disease Class: Glioblastoma [ICD-11: 2A00.02] | [1] | |||
| Resistant Disease | Glioblastoma [ICD-11: 2A00.02] | |||
| Resistant Drug | Imatinib | |||
| Molecule Alteration | Expression | Up-regulation |
||
| Differential expression of the molecule in resistant disease | ||||
| Classification of Disease | Brain cancer [ICD-11: 2A00] | |||
| The Specified Disease | Brain cancer | |||
| The Studied Tissue | Nervous tissue | |||
| The Expression Level of Disease Section Compare with the Healthy Individual Tissue | p-value: 2.37E-107 Fold-change: 3.31E-01 Z-score: 2.46E+01 |
|||
| Experimental Note | Identified from the Human Clinical Data | |||
| Cell Pathway Regulation | Cell invasion | Activation | hsa05200 | |
| Cell migration | Activation | hsa04670 | ||
| In Vitro Model | U251 cells | Brain | Homo sapiens (Human) | CVCL_0021 |
| U87 cells | Brain | Homo sapiens (Human) | CVCL_0022 | |
| Experiment for Molecule Alteration |
Western blot analysis | |||
| Experiment for Drug Resistance |
CCK8 assay | |||
| Mechanism Description | SNAI2 is a direct target of miR-203 and that miR-203-mediated inhibition of SNAI2 is dependent on a conversed motif in the 3'-UTR of SNAI2. Recent independent studies have shown that overexpression of SNAI2 alters cell invasion, motility, chemoresistance, metastasis and poor prognosis in several human cancers. As a member of the snail family of transcription factors, SNAI2 can repress E-cadherin transcription and induce EMT directly. Therefore, SNAI2 overexpression due to reduction of miR-203 may result in EMT and chemoresistance in GBM via these pathways. Additionally, miR-203 may relieve E-cadherin from transcriptional repression by targeting SNAI2 signaling. Nevertheless, because one single miRNA might have multiple targets, judicious considerations are essential for identi cation of the main functional targets. | |||
| Drug Sensitivity Data Categorized by Their Corresponding Mechanisms | ||||
|
|
||||
| Disease Class: Non-small cell lung cancer [ICD-11: 2C25.Y] | [2] | |||
| Sensitive Disease | Non-small cell lung cancer [ICD-11: 2C25.Y] | |||
| Sensitive Drug | Cisplatin | |||
| Molecule Alteration | Expression | Down-regulation |
||
| Experimental Note | Identified from the Human Clinical Data | |||
| Cell Pathway Regulation | Cell apoptosis | Activation | hsa04210 | |
| Cell colony | Inhibition | hsa05200 | ||
| Cell proliferation | Inhibition | hsa05200 | ||
| MAPK/Slug signaling pathway | Regulation | N.A. | ||
| In Vitro Model | A549 cells | Lung | Homo sapiens (Human) | CVCL_0023 |
| SPC-A1 cells | Lung | Homo sapiens (Human) | CVCL_6955 | |
| Experiment for Molecule Alteration |
Western blot analysis | |||
| Experiment for Drug Resistance |
MTT assay; Flow cytometry assay | |||
| Mechanism Description | LncRNA NNT-AS1 is a major mediator of cisplatin chemoresistance in non-small cell lung cancer through MAPk/Slug pathway. | |||
| Drug Sensitivity Data Categorized by Their Corresponding Mechanisms | ||||
|
|
||||
| Disease Class: Colorectal cancer [ICD-11: 2B91.1] | [3] | |||
| Sensitive Disease | Colorectal cancer [ICD-11: 2B91.1] | |||
| Sensitive Drug | Fluorouracil | |||
| Molecule Alteration | Expression | Down-regulation |
||
| Experimental Note | Revealed Based on the Cell Line Data | |||
| Cell Pathway Regulation | Cell invasion | Activation | hsa05200 | |
| Cell migration | Activation | hsa04670 | ||
| Cell proliferation | Inhibition | hsa05200 | ||
| In Vitro Model | HT29 Cells | Colon | Homo sapiens (Human) | CVCL_A8EZ |
| DLD1 cells | Colon | Homo sapiens (Human) | CVCL_0248 | |
| SW620 cells | Colon | Homo sapiens (Human) | CVCL_0547 | |
| HCT116 cells | Colon | Homo sapiens (Human) | CVCL_0291 | |
| LS174T cells | Colon | Homo sapiens (Human) | CVCL_1384 | |
| Experiment for Molecule Alteration |
Western blot analysis | |||
| Experiment for Drug Resistance |
Trypan blue assay; Sulforhodamine B assay | |||
| Mechanism Description | Inhibition of SNAI2 directly with short hairpin sequence for SNAI2 and miR145 replacement therapy both decreased vimentin expression and increased in vitro 5FU sensitivity. | |||
| Drug Sensitivity Data Categorized by Their Corresponding Mechanisms | ||||
|
|
||||
| Disease Class: Non-small cell lung cancer [ICD-11: 2C25.Y] | [4] | |||
| Sensitive Disease | Non-small cell lung cancer [ICD-11: 2C25.Y] | |||
| Sensitive Drug | Gefitinib | |||
| Molecule Alteration | Expression | Down-regulation |
||
| Experimental Note | Identified from the Human Clinical Data | |||
| In Vitro Model | A549 cells | Lung | Homo sapiens (Human) | CVCL_0023 |
| PC9 cells | Lung | Homo sapiens (Human) | CVCL_B260 | |
| Experiment for Molecule Alteration |
Western blot analysis; Luciferase Assay | |||
| Experiment for Drug Resistance |
CCK8 assay; Annexin V-FITC Apoptosis assay | |||
| Mechanism Description | miR124 decreased SNAI2 and STAT3 expression by directly targeting their 3'UTRs, miR124 contributes to gefitinib and EMT by directly targeting S.I2 and STAT3. Over-expression of miR124 re-sensitized gefitinib-resistant cell lines to gefitinib. | |||
| Drug Sensitivity Data Categorized by Their Corresponding Mechanisms | ||||
|
|
||||
| Disease Class: Pancreatic cancer [ICD-11: 2C10.3] | [5] | |||
| Sensitive Disease | Pancreatic cancer [ICD-11: 2C10.3] | |||
| Sensitive Drug | Gemcitabine | |||
| Molecule Alteration | Expression | Down-regulation |
||
| Experimental Note | Revealed Based on the Cell Line Data | |||
| Cell Pathway Regulation | Slug/PUMA signaling pathway | Regulation | N.A. | |
| In Vitro Model | PANC-1 cells | Pancreas | Homo sapiens (Human) | CVCL_0480 |
| Experiment for Molecule Alteration |
RT-PCR; Western blot analysis | |||
| Experiment for Drug Resistance |
Flow Cytometric Analysis, MTT assay; TUNEL staining | |||
| Mechanism Description | miR34 increases in vitro PANC-1 cell sensitivity to gemcitabine via targeting Slug/PUMA. miR34 enhances sensitization against gemcitabine-mediated apoptosis through the down-regulation of Slug expression, and up-regulation of Slug-dependent PUMA expression. | |||
Disease- and Tissue-specific Abundances of This Molecule
ICD Disease Classification 02

| Differential expression of molecule in resistant diseases | ||
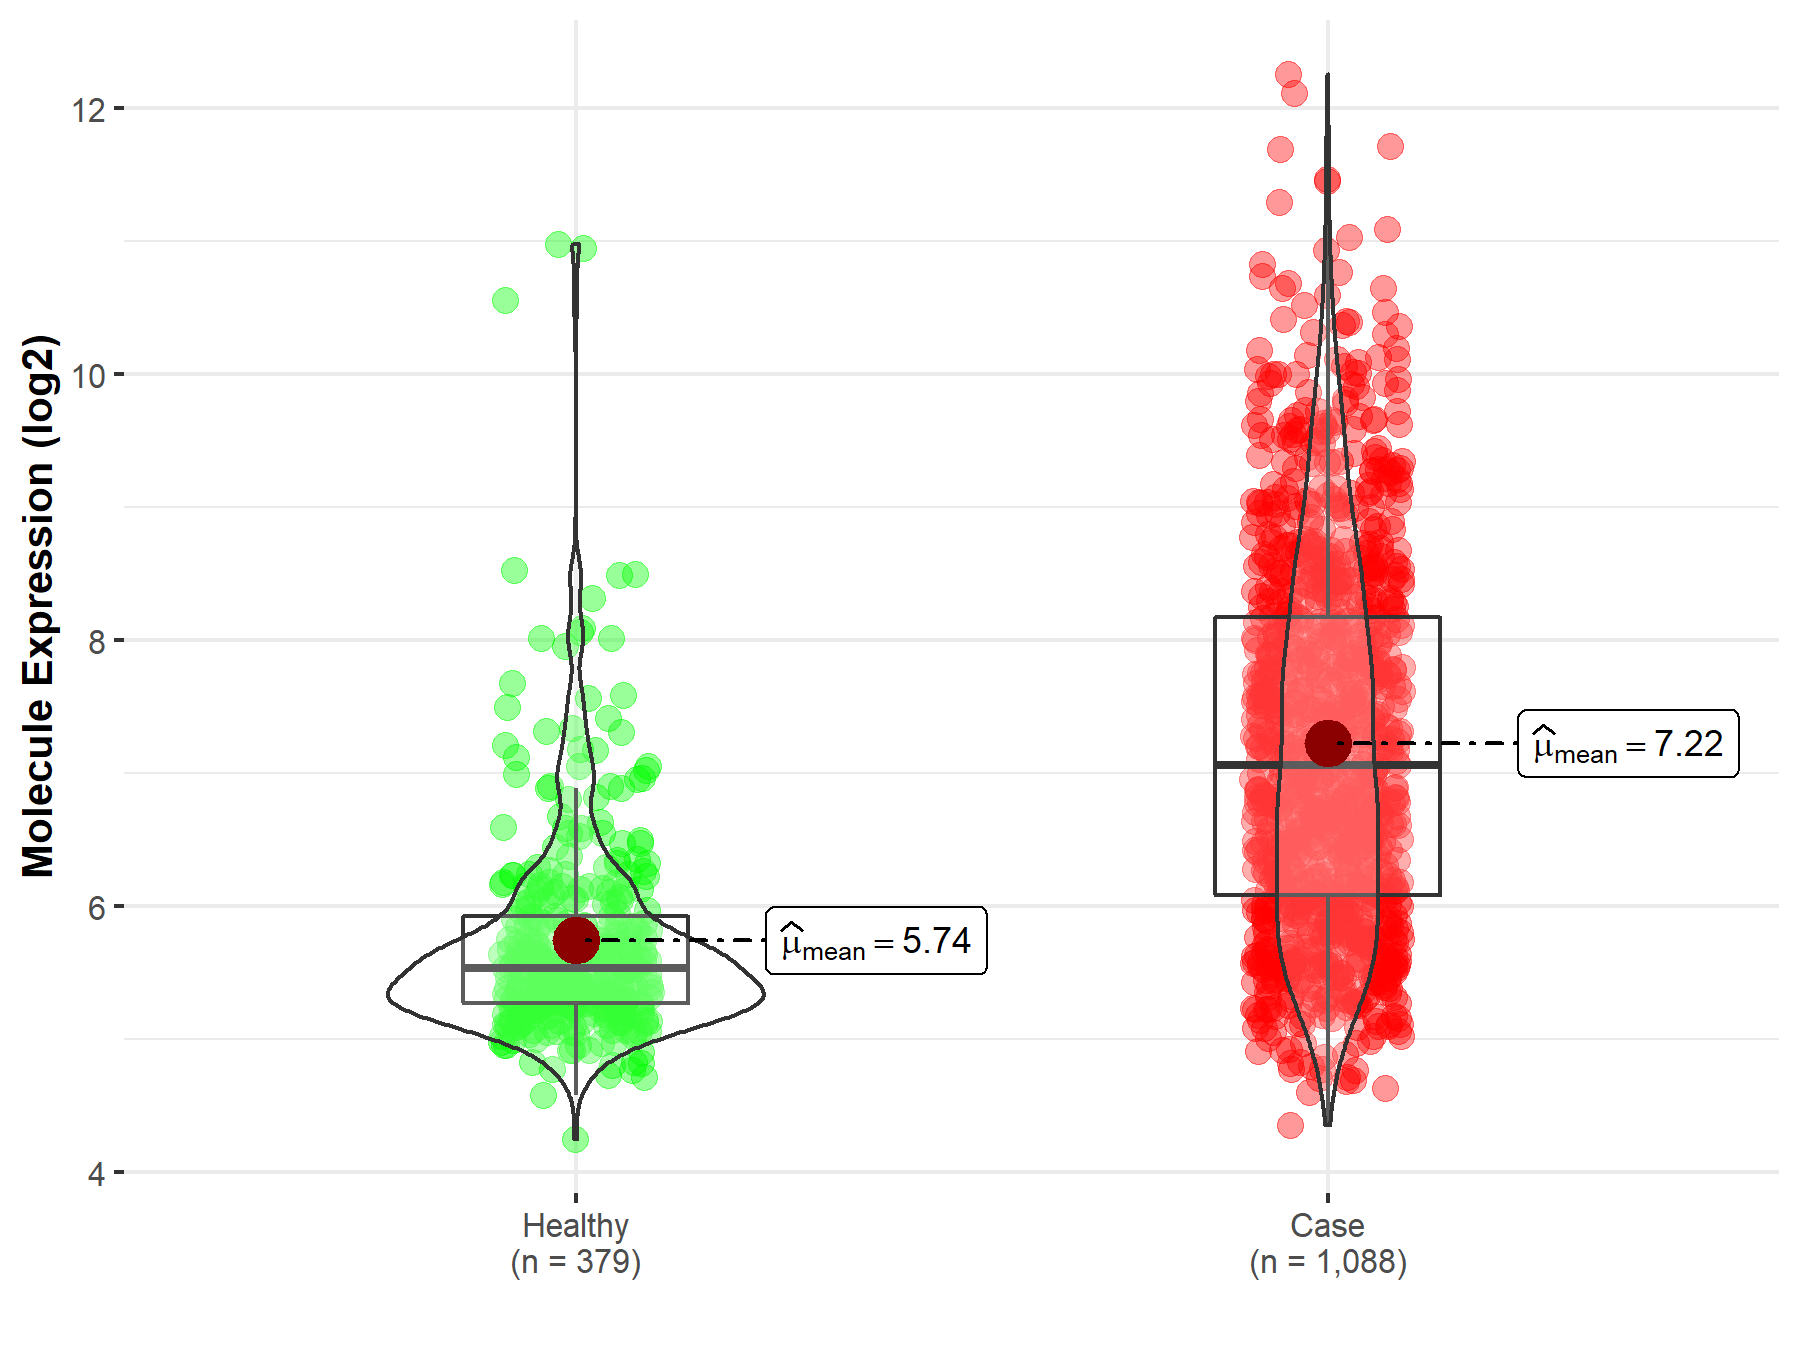
| The Studied Tissue | Nervous tissue | |
| The Specified Disease | Brain cancer | |
| The Expression Level of Disease Section Compare with the Healthy Individual Tissue | p-value: 2.37E-107; Fold-change: 1.53E+00; Z-score: 1.86E+00 | |
|
Molecule expression in the diseased tissue of patients
Molecule expression in the normal tissue of healthy individuals
|
||
| Disease-specific Molecule Abundances |
|
Click to View the Clearer Original Diagram |
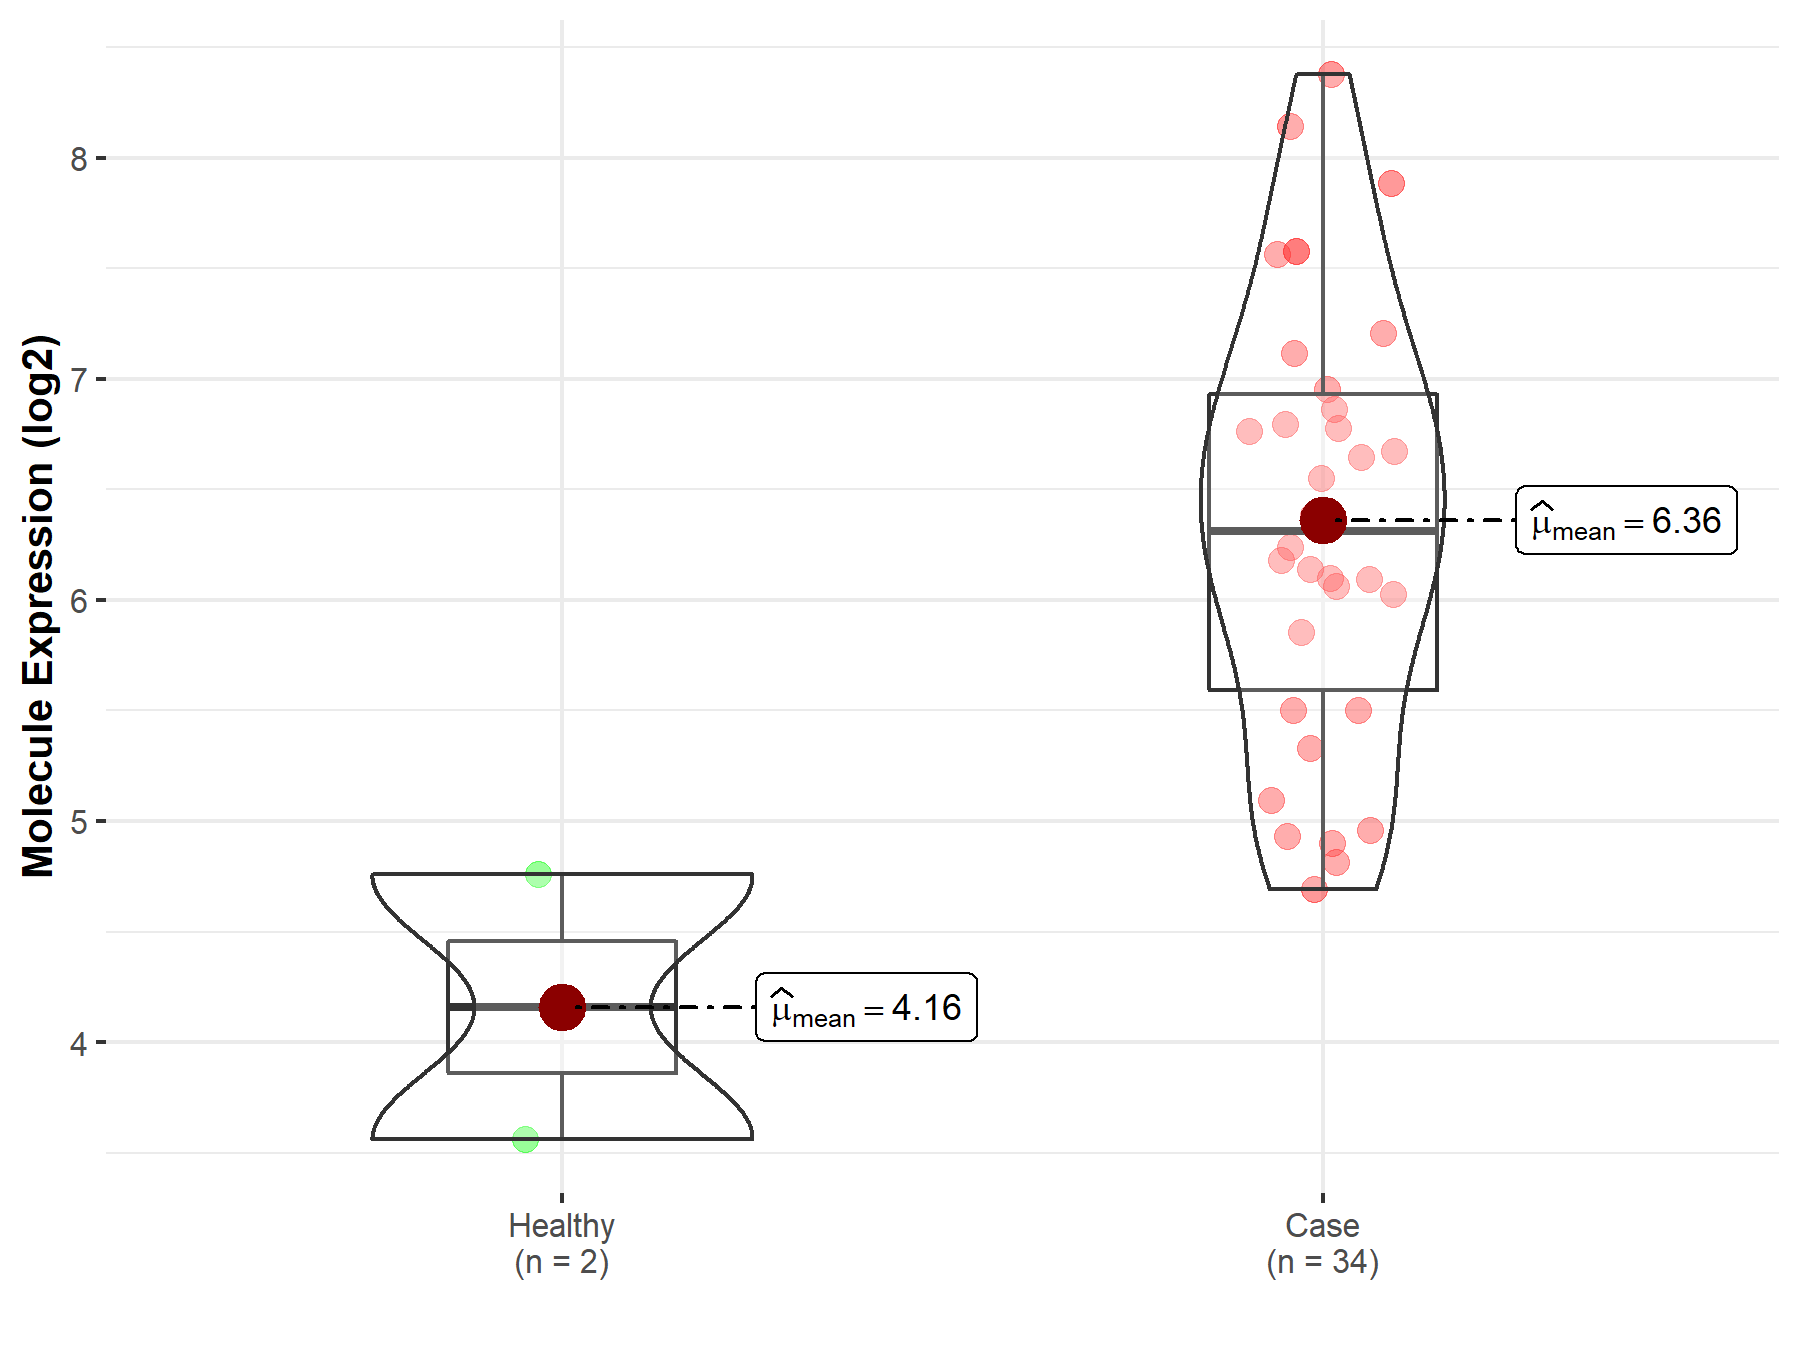
| The Studied Tissue | Brainstem tissue | |
| The Specified Disease | Glioma | |
| The Expression Level of Disease Section Compare with the Healthy Individual Tissue | p-value: 1.46E-01; Fold-change: 2.15E+00; Z-score: 2.54E+00 | |
|
Molecule expression in the diseased tissue of patients
Molecule expression in the normal tissue of healthy individuals
|
||
| Disease-specific Molecule Abundances |
|
Click to View the Clearer Original Diagram |
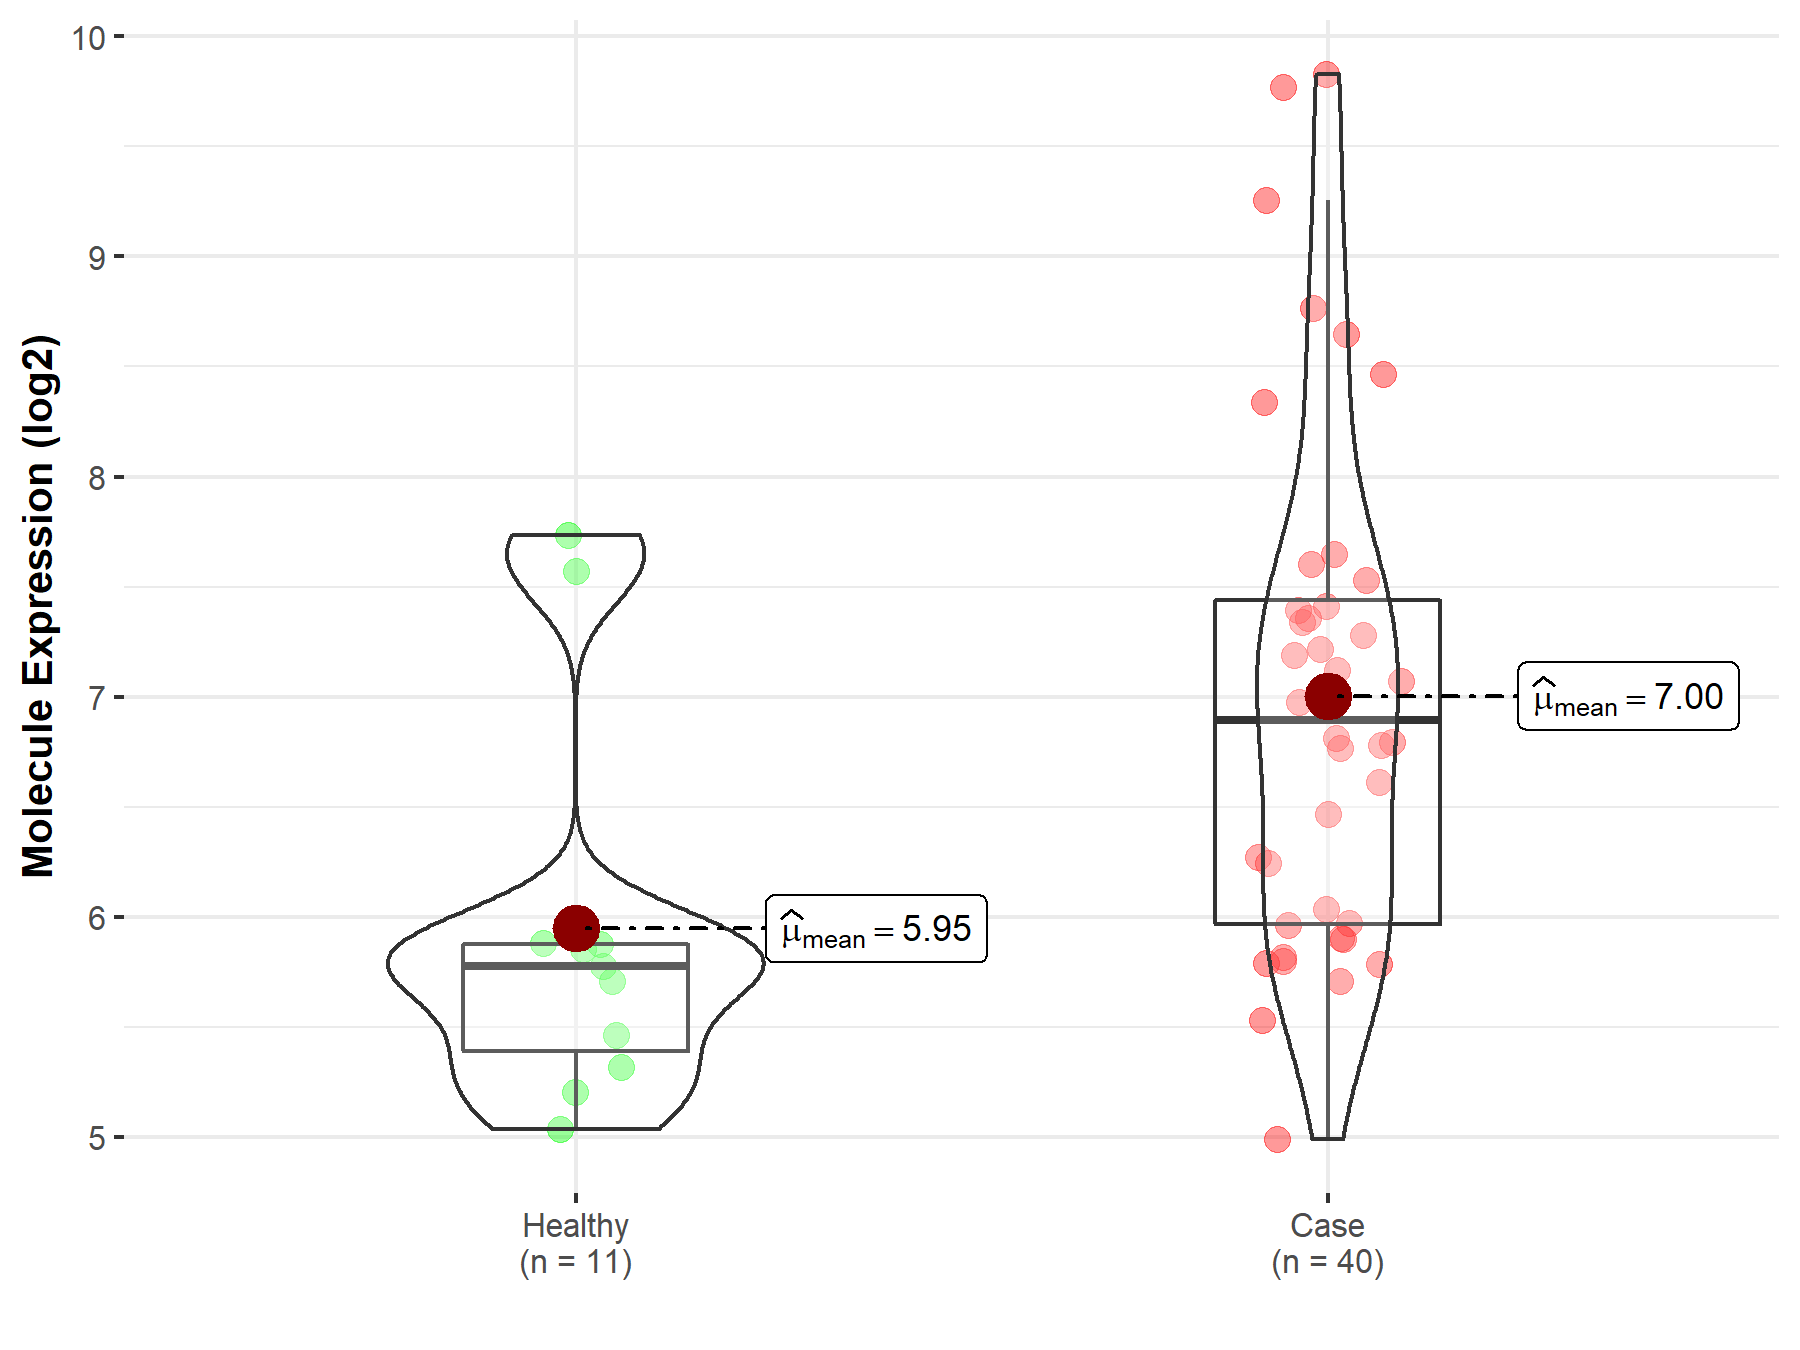
| The Studied Tissue | White matter | |
| The Specified Disease | Glioma | |
| The Expression Level of Disease Section Compare with the Healthy Individual Tissue | p-value: 3.99E-03; Fold-change: 1.12E+00; Z-score: 1.26E+00 | |
|
Molecule expression in the diseased tissue of patients
Molecule expression in the normal tissue of healthy individuals
|
||
| Disease-specific Molecule Abundances |
|
Click to View the Clearer Original Diagram |
| The Studied Tissue | Brainstem tissue | |
| The Specified Disease | Neuroectodermal tumor | |
| The Expression Level of Disease Section Compare with the Healthy Individual Tissue | p-value: 1.87E-07; Fold-change: 2.58E+00; Z-score: 3.54E+00 | |
|
Molecule expression in the diseased tissue of patients
Molecule expression in the normal tissue of healthy individuals
|
||
| Disease-specific Molecule Abundances |

|
Click to View the Clearer Original Diagram |
| Differential expression of molecule in resistant diseases | ||
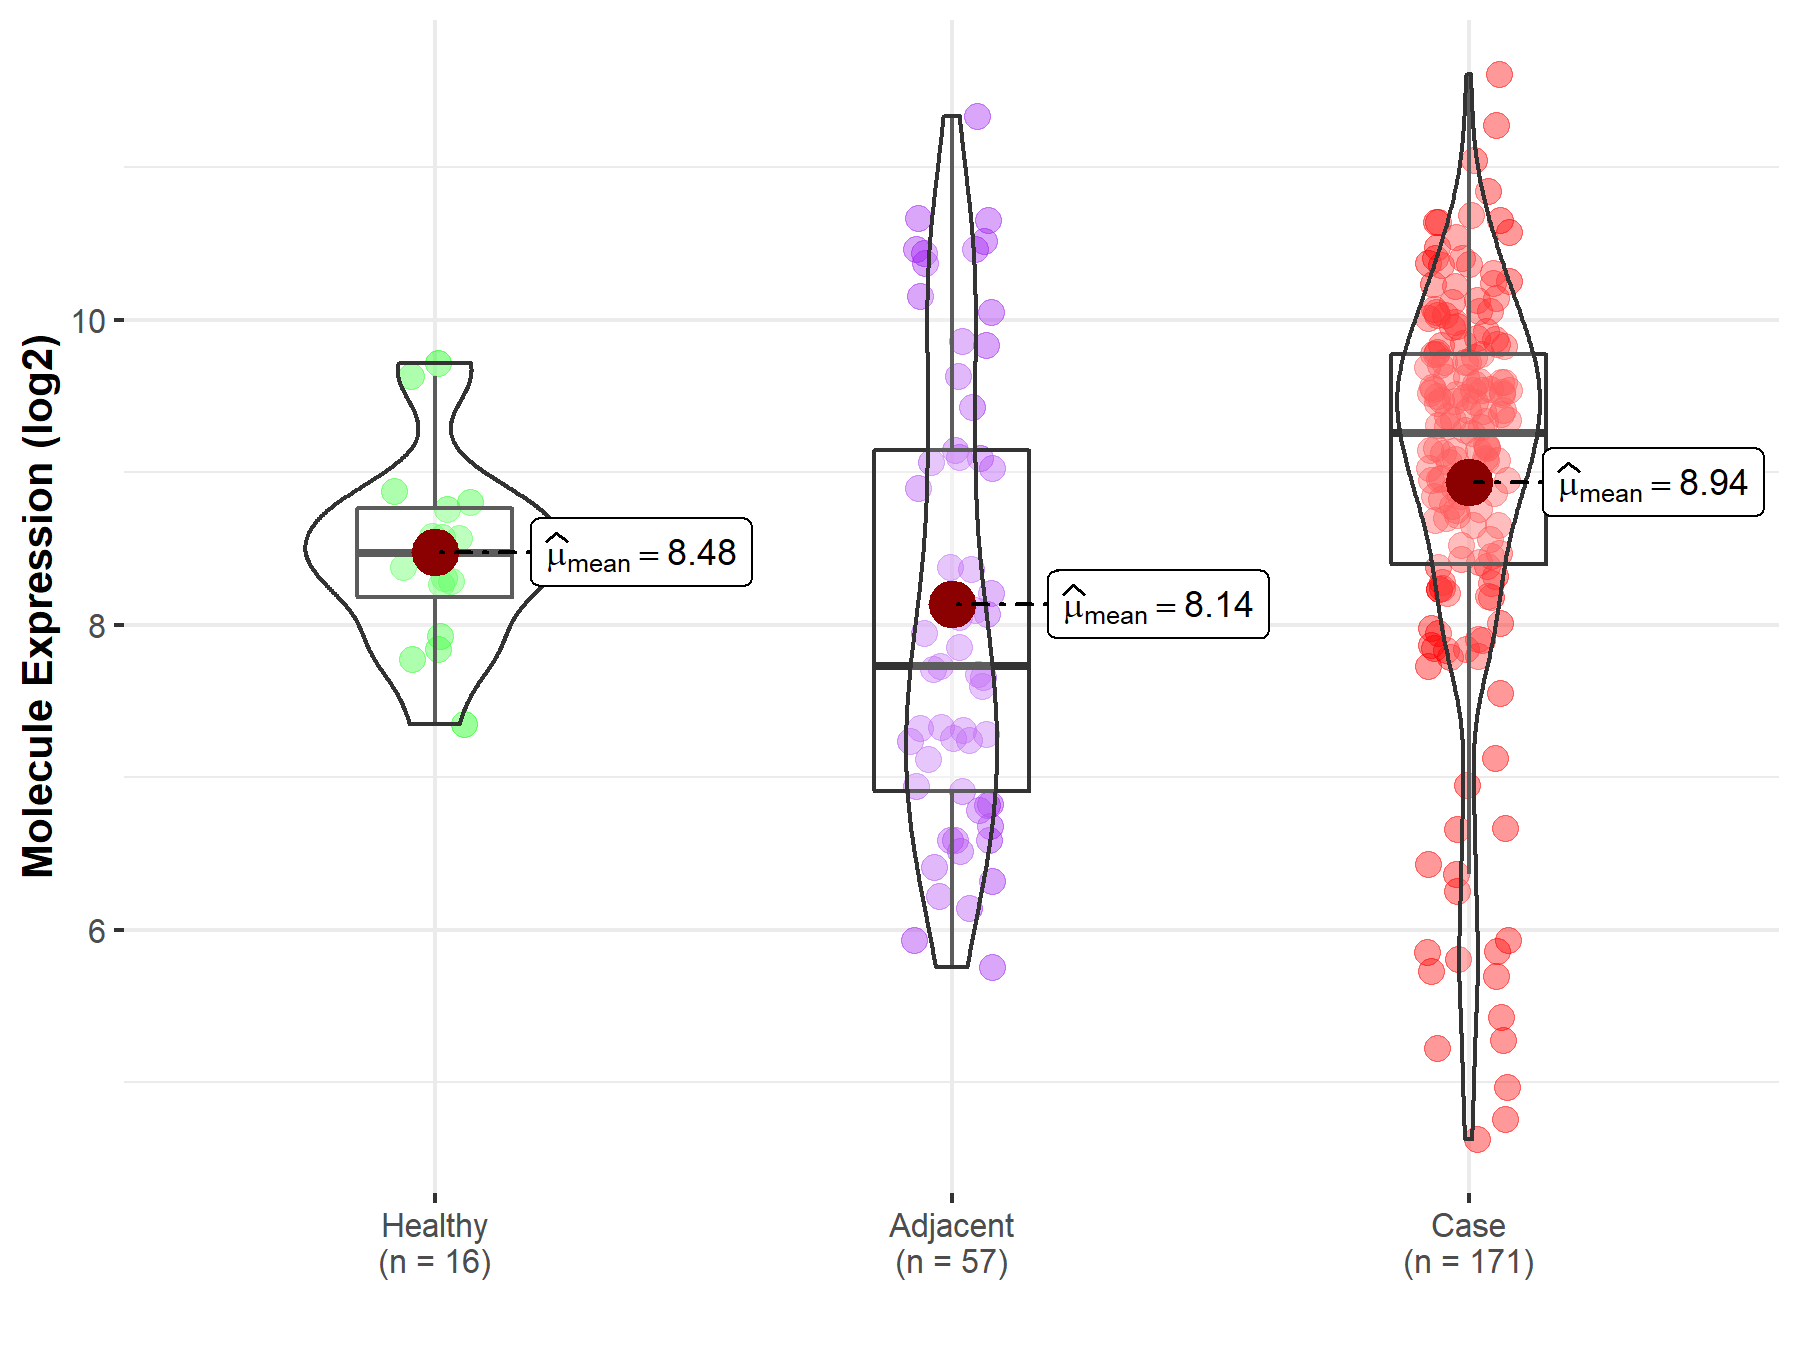
| The Studied Tissue | Pancreas | |
| The Specified Disease | Pancreatic cancer | |
| The Expression Level of Disease Section Compare with the Healthy Individual Tissue | p-value: 2.03E-02; Fold-change: 7.83E-01; Z-score: 1.25E+00 | |
| The Expression Level of Disease Section Compare with the Adjacent Tissue | p-value: 5.29E-04; Fold-change: 1.52E+00; Z-score: 1.02E+00 | |
|
Molecule expression in the normal tissue adjacent to the diseased tissue of patients
Molecule expression in the diseased tissue of patients
Molecule expression in the normal tissue of healthy individuals
|
||
| Disease-specific Molecule Abundances |
|
Click to View the Clearer Original Diagram |
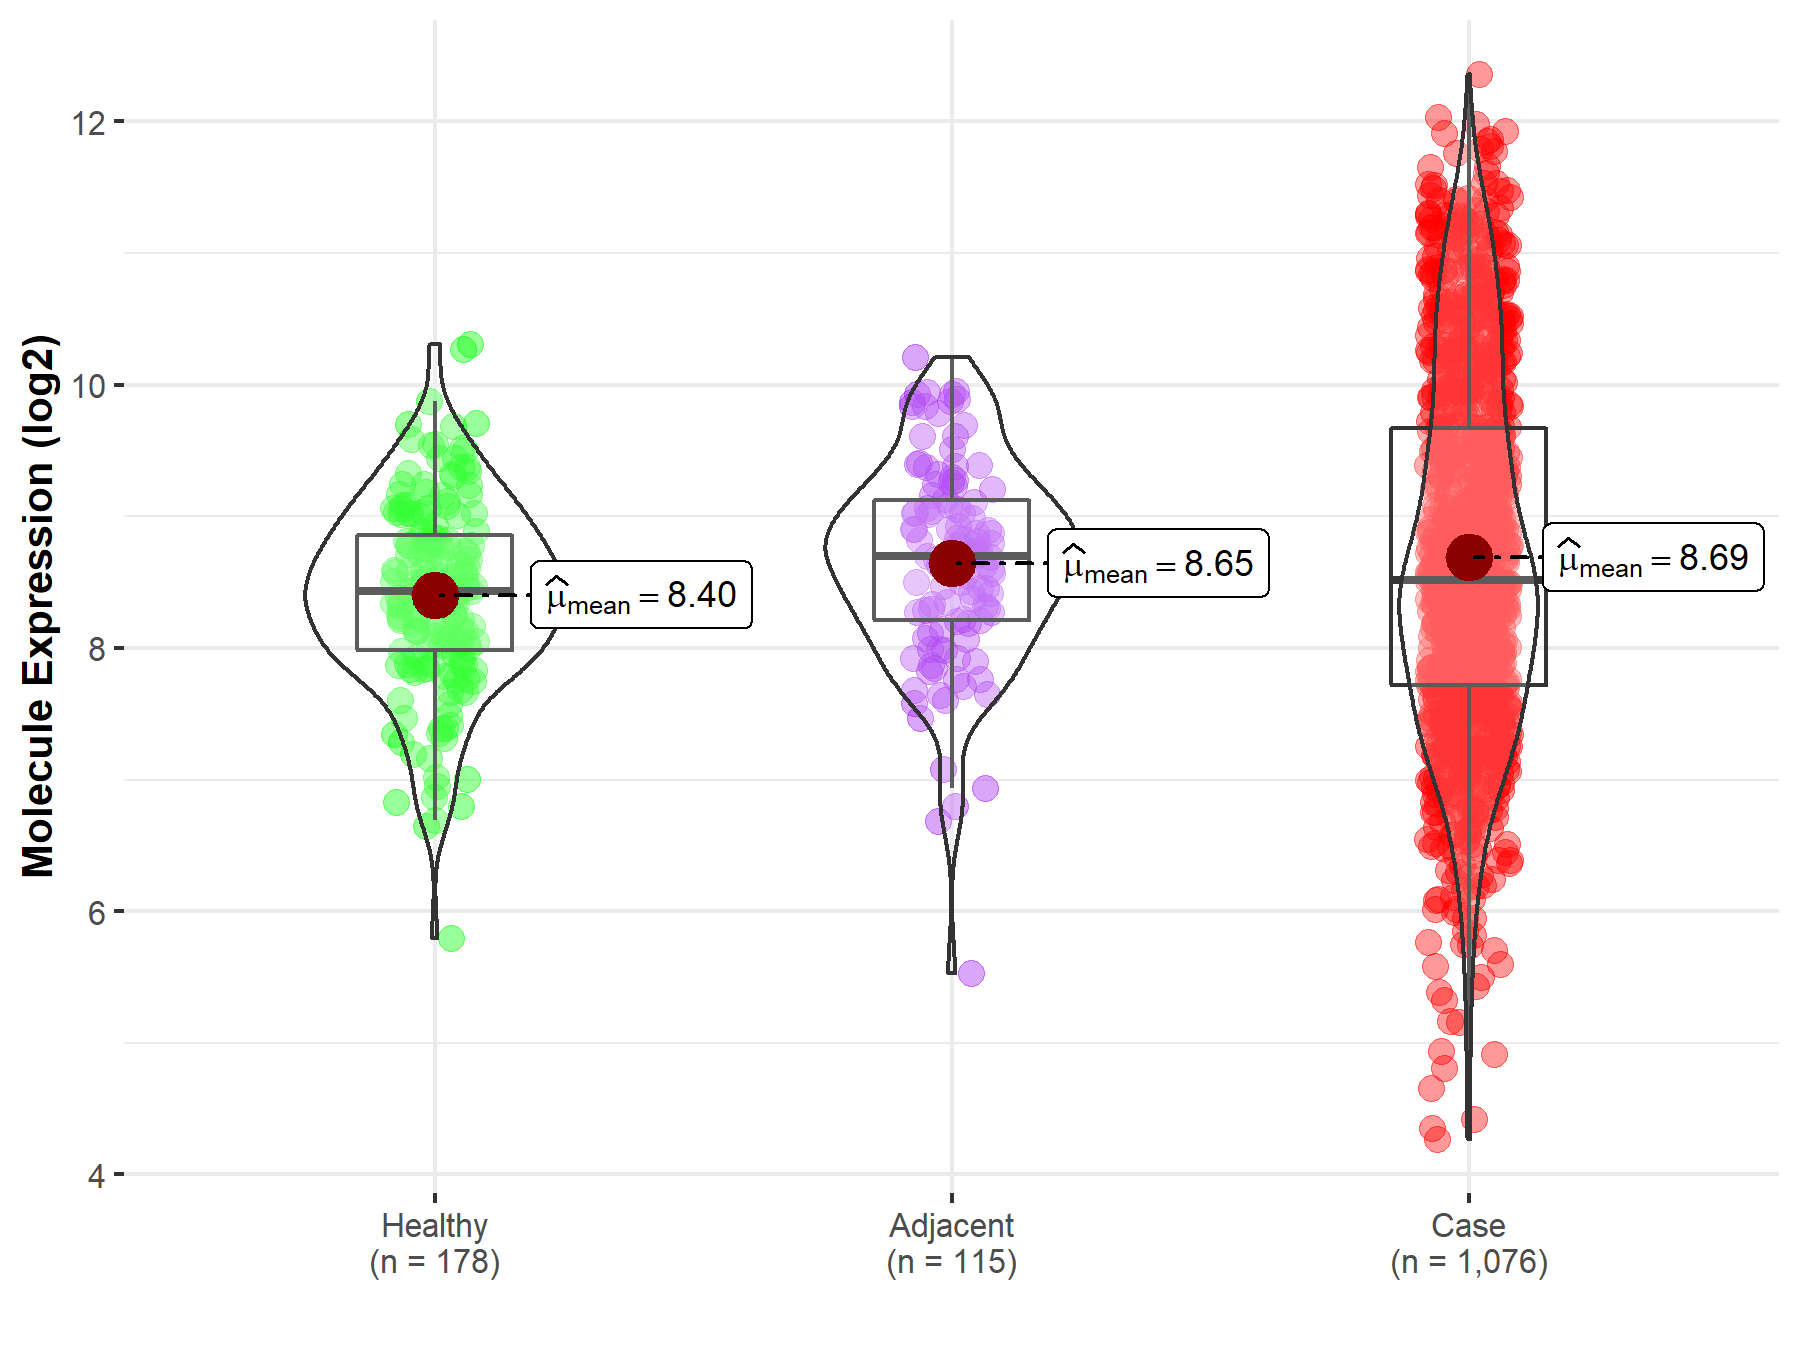
| Differential expression of molecule in resistant diseases | ||
| The Studied Tissue | Lung | |
| The Specified Disease | Lung cancer | |
| The Expression Level of Disease Section Compare with the Healthy Individual Tissue | p-value: 4.63E-05; Fold-change: 8.73E-02; Z-score: 1.20E-01 | |
| The Expression Level of Disease Section Compare with the Adjacent Tissue | p-value: 5.94E-01; Fold-change: -1.81E-01; Z-score: -2.32E-01 | |
|
Molecule expression in the normal tissue adjacent to the diseased tissue of patients
Molecule expression in the diseased tissue of patients
Molecule expression in the normal tissue of healthy individuals
|
||
| Disease-specific Molecule Abundances |
|
Click to View the Clearer Original Diagram |
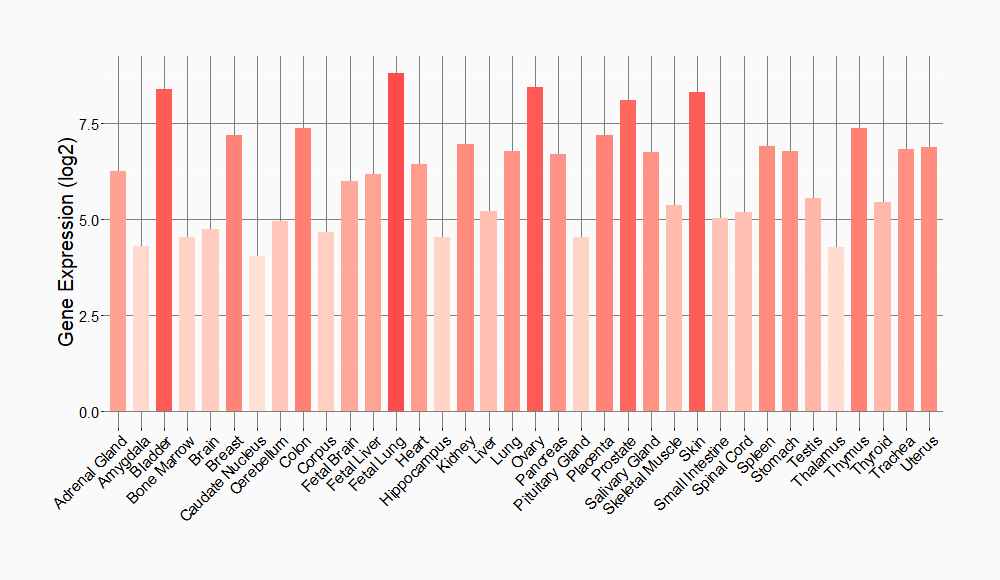
Tissue-specific Molecule Abundances in Healthy Individuals

|
||
References
If you find any error in data or bug in web service, please kindly report it to Dr. Sun and Dr. Yu.
