Molecule Information
General Information of the Molecule (ID: Mol00633)
| Name |
Mothers against decapentaplegic homolog 7 (SMAD7)
,Homo sapiens
|
||||
|---|---|---|---|---|---|
| Synonyms |
MAD homolog 7; Mothers against DPP homolog 7; Mothers against decapentaplegic homolog 8; MAD homolog 8; Mothers against DPP homolog 8; SMAD family member 7; SMAD 7; Smad7; hSMAD7; MADH7; MADH8
Click to Show/Hide
|
||||
| Molecule Type |
Protein
|
||||
| Gene Name |
SMAD7
|
||||
| Gene ID | |||||
| Location |
chr18:48919853-48950965[-]
|
||||
| Sequence |
MFRTKRSALVRRLWRSRAPGGEDEEEGAGGGGGGGELRGEGATDSRAHGAGGGGPGRAGC
CLGKAVRGAKGHHHPHPPAAGAGAAGGAEADLKALTHSVLKKLKERQLELLLQAVESRGG TRTACLLLPGRLDCRLGPGAPAGAQPAQPPSSYSLPLLLCKVFRWPDLRHSSEVKRLCCC ESYGKINPELVCCNPHHLSRLCELESPPPPYSRYPMDFLKPTADCPDAVPSSAETGGTNY LAPGGLSDSQLLLEPGDRSHWCVVAYWEEKTRVGRLYCVQEPSLDIFYDLPQGNGFCLGQ LNSDNKSQLVQKVRSKIGCGIQLTREVDGVWVYNRSSYPIFIKSATLDNPDSRTLLVHKV FPGFSIKAFDYEKAYSLQRPNDHEFMQQPWTGFTVQISFVKGWGQCYTRQFISSCPCWLE VIFNSR Click to Show/Hide
|
||||
| 3D-structure |
|
||||
| Function |
Antagonist of signaling by TGF-beta (transforming growth factor) type 1 receptor superfamily members; has been shown to inhibit TGF-beta (Transforming growth factor) and activin signaling by associating with their receptors thus preventing SMAD2 access. Functions as an adapter to recruit SMURF2 to the TGF-beta receptor complex. Also acts by recruiting the PPP1R15A-PP1 complex to TGFBR1, which promotes its dephosphorylation. Positively regulates PDPK1 kinase activity by stimulating its dissociation from the 14-3-3 protein YWHAQ which acts as a negative regulator.
Click to Show/Hide
|
||||
| Uniprot ID | |||||
| Ensembl ID | |||||
| HGNC ID | |||||
| Click to Show/Hide the Complete Species Lineage | |||||
Type(s) of Resistant Mechanism of This Molecule
Drug Resistance Data Categorized by Drug
Approved Drug(s)
1 drug(s) in total
| Drug Resistance Data Categorized by Their Corresponding Mechanisms | ||||
|
|
||||
| Disease Class: Liver cancer [ICD-11: 2C12.6] | [1] | |||
| Resistant Disease | Liver cancer [ICD-11: 2C12.6] | |||
| Resistant Drug | Sorafenib | |||
| Molecule Alteration | Expression | Down-regulation |
||
| Differential expression of the molecule in resistant disease | ||||
| Classification of Disease | Liver cancer [ICD-11: 2C12] | |||
| The Specified Disease | Liver cancer | |||
| The Studied Tissue | Liver tissue | |||
| The Expression Level of Disease Section Compare with the Healthy Individual Tissue | p-value: 1.57E-03 Fold-change: -7.38E-02 Z-score: -3.30E+00 |
|||
| Experimental Note | Identified from the Human Clinical Data | |||
| Cell Pathway Regulation | Cell migration | Activation | hsa04670 | |
| Cell proliferation | Activation | hsa05200 | ||
| PI3K/AKT signaling pathway | Activation | hsa04151 | ||
| TGF-beta signaling pathway | Activation | hsa04350 | ||
| In Vitro Model | Huh-7 cells | Liver | Homo sapiens (Human) | CVCL_0336 |
| HepG2 cells | Liver | Homo sapiens (Human) | CVCL_0027 | |
| HCCLM3 cells | Liver | Homo sapiens (Human) | CVCL_6832 | |
| Hep3B cells | Liver | Homo sapiens (Human) | CVCL_0326 | |
| BEL-7404 cells | Liver | Homo sapiens (Human) | CVCL_6568 | |
| PLC/PRF/5 cells | Liver | Homo sapiens (Human) | CVCL_0485 | |
| SNU449 cells | Liver | Homo sapiens (Human) | CVCL_0454 | |
| Skhep1 cells | Liver | Homo sapiens (Human) | CVCL_0525 | |
| HLE cells | Liver | Homo sapiens (Human) | CVCL_1281 | |
| In Vivo Model | BALB/c nude mouse xenograft model | Mus musculus | ||
| Experiment for Molecule Alteration |
Western blot analysis; Immunofluorescence analysis | |||
| Experiment for Drug Resistance |
Flow cytometry assay | |||
| Mechanism Description | Overexpression of miR-216a/217 activates the PI3k/Akt and TGF-beta pathways by targeting PTEN and SMAD7, contributing to hepatocarcinogenesis, sorafenib resistance and tumor recurrence in HCC. | |||
Investigative Drug(s)
1 drug(s) in total
| Drug Resistance Data Categorized by Their Corresponding Mechanisms | ||||
|
|
||||
| Disease Class: Ovarian cancer [ICD-11: 2C73.0] | [2] | |||
| Resistant Disease | Ovarian cancer [ICD-11: 2C73.0] | |||
| Resistant Drug | Platinum | |||
| Molecule Alteration | Expression | Down-regulation |
||
| Experimental Note | Identified from the Human Clinical Data | |||
| Cell Pathway Regulation | Cell migration | Inhibition | hsa04670 | |
| TGF-beta signaling pathway | Activation | hsa04350 | ||
| In Vitro Model | SkOV3 cells | Ovary | Homo sapiens (Human) | CVCL_0532 |
| A2780 cells | Ovary | Homo sapiens (Human) | CVCL_0134 | |
| In Vivo Model | Nude mouse xenograft model | Mus musculus | ||
| Experiment for Molecule Alteration |
Immunoblotting analysis | |||
| Experiment for Drug Resistance |
Clonogenicity assay; Cell migration and invasion assay | |||
| Mechanism Description | Smad7 is a direct functional target of miR-181a. There is a striking inverse correlation between miR-181a and Smad7 expression. enhanced miR-181a expression resulted in the activation of other Smad-dependent protein such as TGF-beta R1 and potentially non-canonical TGF-beta-related pathways. By this mechanism the TGF-beta pathway is activated in ovarian cancer tumours and contributes to poor patient outcome. | |||
Disease- and Tissue-specific Abundances of This Molecule
ICD Disease Classification 02

| Differential expression of molecule in resistant diseases | ||
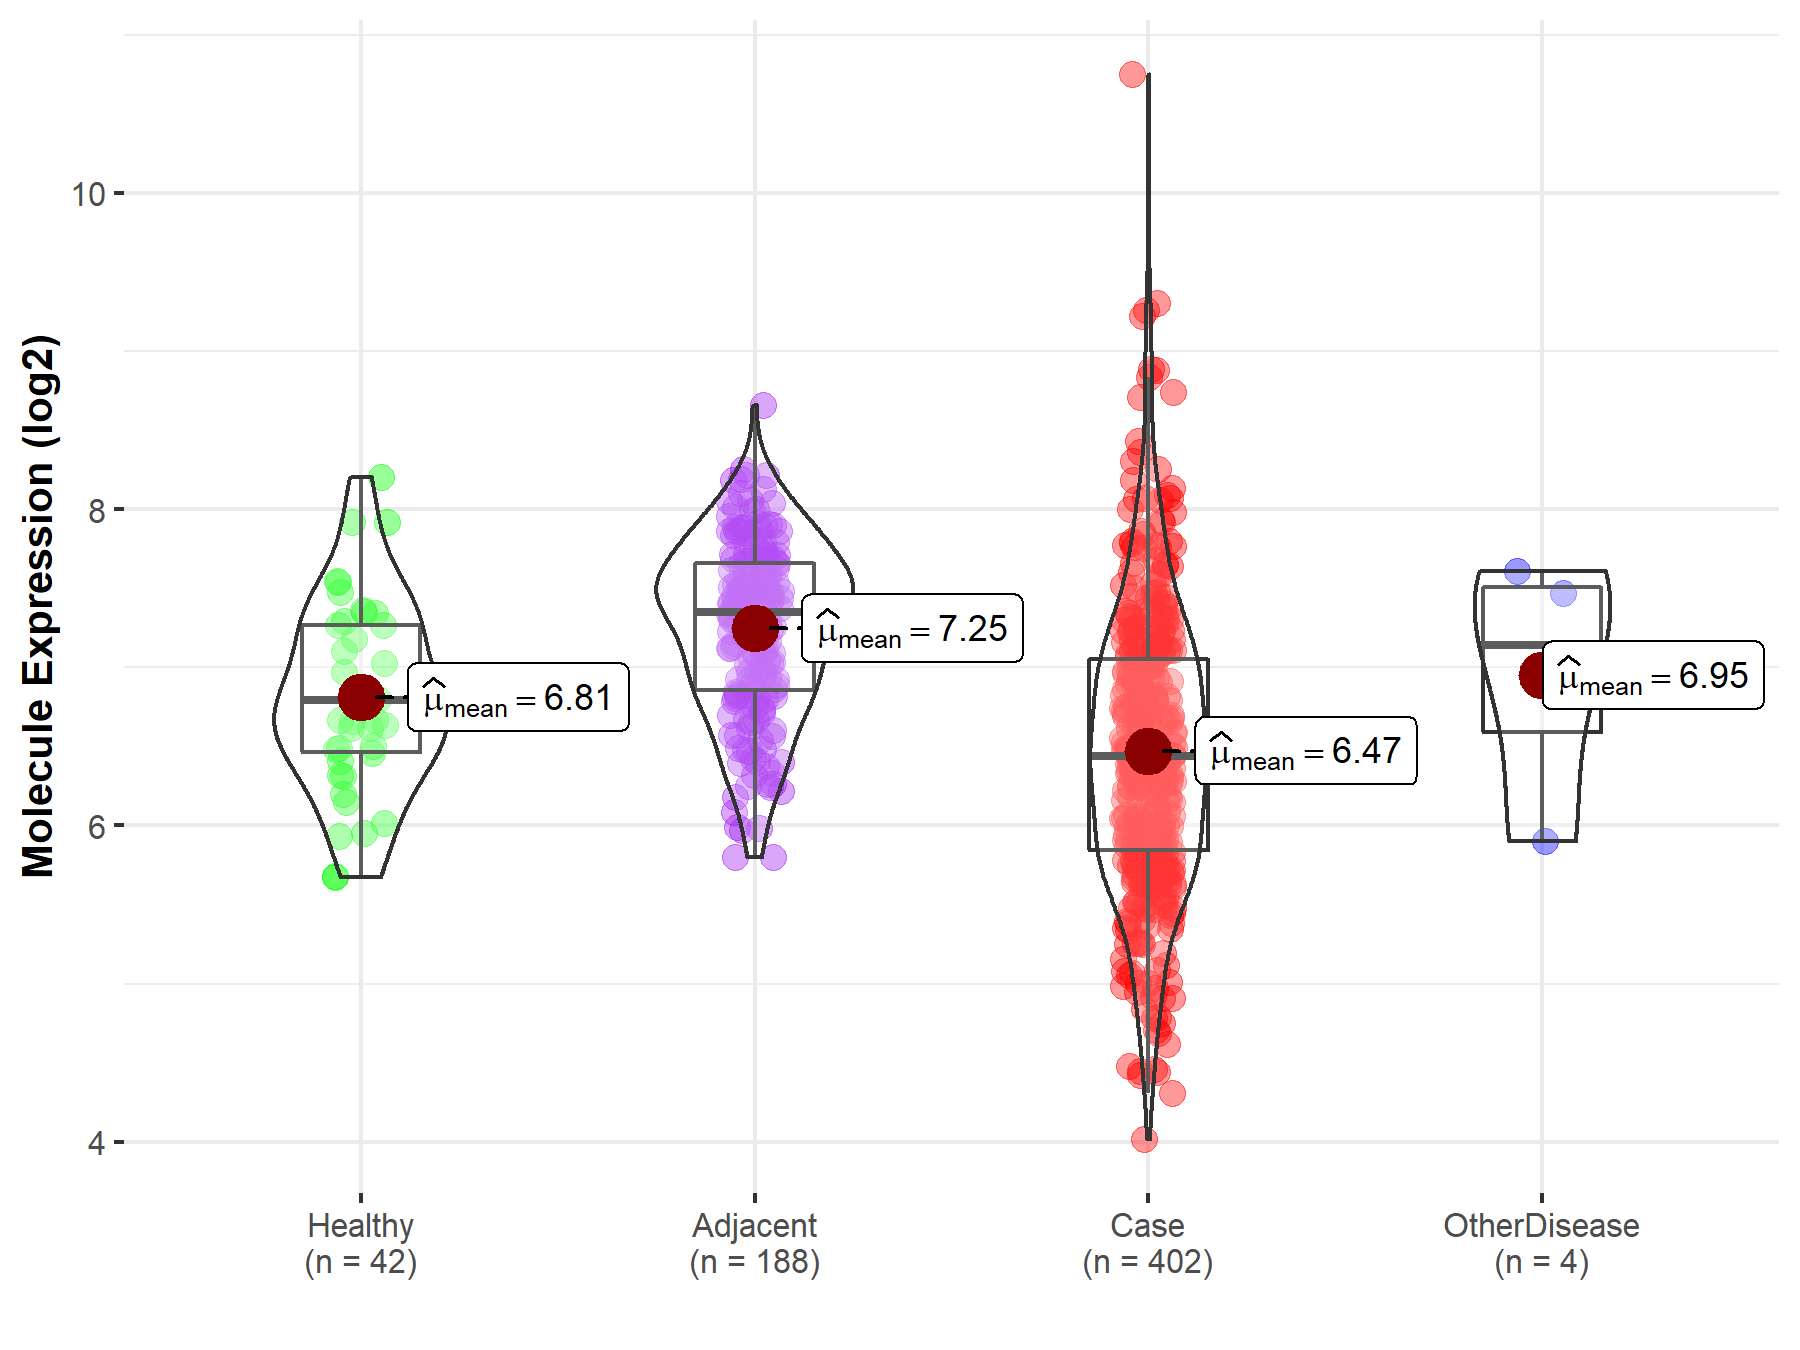
| The Studied Tissue | Liver | |
| The Specified Disease | Liver cancer | |
| The Expression Level of Disease Section Compare with the Healthy Individual Tissue | p-value: 1.57E-03; Fold-change: -3.52E-01; Z-score: -5.91E-01 | |
| The Expression Level of Disease Section Compare with the Adjacent Tissue | p-value: 2.87E-32; Fold-change: -9.13E-01; Z-score: -1.64E+00 | |
| The Expression Level of Disease Section Compare with the Other Disease Section | p-value: 3.08E-01; Fold-change: -7.04E-01; Z-score: -9.04E-01 | |
|
Molecule expression in the normal tissue adjacent to the diseased tissue of patients
Molecule expression in the diseased tissue of patients
Molecule expression in the normal tissue of healthy individuals
Molecule expression in tissue other than the diseased tissue of patients
|
||
| Disease-specific Molecule Abundances |

|
Click to View the Clearer Original Diagram |
| Differential expression of molecule in resistant diseases | ||
| The Studied Tissue | Ovary | |
| The Specified Disease | Ovarian cancer | |
| The Expression Level of Disease Section Compare with the Healthy Individual Tissue | p-value: 3.69E-02; Fold-change: 3.21E-01; Z-score: 5.20E-01 | |
| The Expression Level of Disease Section Compare with the Adjacent Tissue | p-value: 6.00E-01; Fold-change: 2.57E-01; Z-score: 3.01E-01 | |
|
Molecule expression in the normal tissue adjacent to the diseased tissue of patients
Molecule expression in the diseased tissue of patients
Molecule expression in the normal tissue of healthy individuals
|
||
| Disease-specific Molecule Abundances |

|
Click to View the Clearer Original Diagram |
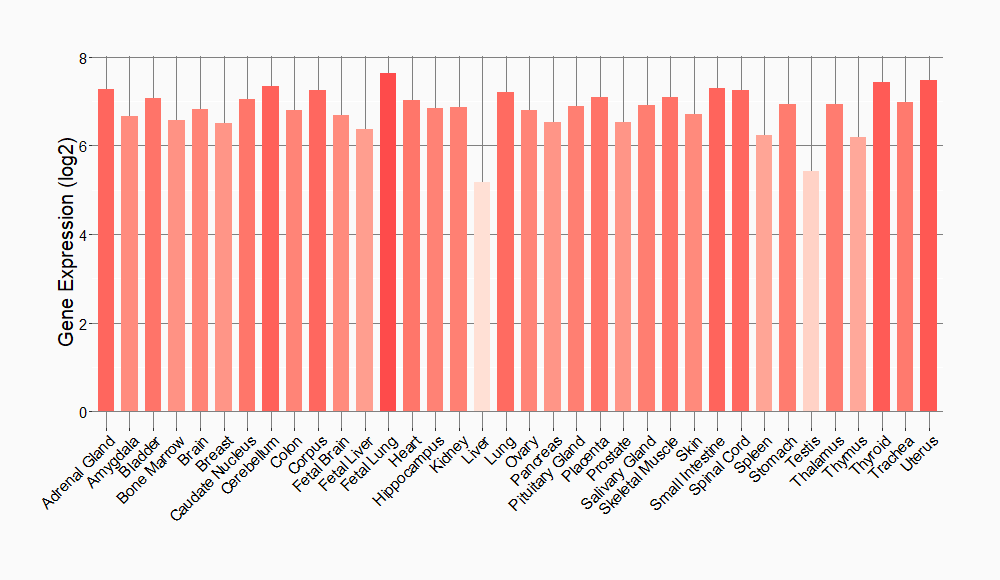
Tissue-specific Molecule Abundances in Healthy Individuals


|
||
References
If you find any error in data or bug in web service, please kindly report it to Dr. Sun and Dr. Yu.
