Molecule Information
General Information of the Molecule (ID: Mol00615)
| Name |
Runt-related transcription factor 3 (RUNX3)
,Homo sapiens
|
||||
|---|---|---|---|---|---|
| Synonyms |
Acute myeloid leukemia 2 protein; Core-binding factor subunit alpha-3; CBF-alpha-3; Oncogene AML-2; Polyomavirus enhancer-binding protein 2 alpha C subunit; PEA2-alpha C; PEBP2-alpha C; SL3-3 enhancer factor 1 alpha C subunit; SL3/AKV core-binding factor alpha C subunit; AML2; CBFA3; PEBP2A3
Click to Show/Hide
|
||||
| Molecule Type |
Protein
|
||||
| Gene Name |
RUNX3
|
||||
| Gene ID | |||||
| Location |
chr1:24899511-24965121[-]
|
||||
| Sequence |
MRIPVDPSTSRRFTPPSPAFPCGGGGGKMGENSGALSAQAAVGPGGRARPEVRSMVDVLA
DHAGELVRTDSPNFLCSVLPSHWRCNKTLPVAFKVVALGDVPDGTVVTVMAGNDENYSAE LRNASAVMKNQVARFNDLRFVGRSGRGKSFTLTITVFTNPTQVATYHRAIKVTVDGPREP RRHRQKLEDQTKPFPDRFGDLERLRMRVTPSTPSPRGSLSTTSHFSSQPQTPIQGTSELN PFSDPRQFDRSFPTLPTLTESRFPDPRMHYPGAMSAAFPYSATPSGTSISSLSVAGMPAT SRFHHTYLPPPYPGAPQNQSGPFQANPSPYHLYYGTSSGSYQFSMVAGSSSGGDRSPTRM LASCTSSAASVAAGNLMNPSLGGQSDGVEADGSHSNSPTALSTPGRMDEAVWRPY Click to Show/Hide
|
||||
| 3D-structure |
|
||||
| Function |
Forms the heterodimeric complex core-binding factor (CBF) with CBFB. RUNX members modulate the transcription of their target genes through recognizing the core consensus binding sequence 5'-TGTGGT-3', or very rarely, 5'-TGCGGT-3', within their regulatory regions via their runt domain, while CBFB is a non-DNA-binding regulatory subunit that allosterically enhances the sequence-specific DNA-binding capacity of RUNX. The heterodimers bind to the core site of a number of enhancers and promoters, including murine leukemia virus, polyomavirus enhancer, T-cell receptor enhancers, LCK, IL3 and GM-CSF promoters. May be involved in the control of cellular proliferation and/or differentiation. In association with ZFHX3, up-regulates CDKN1A promoter activity following TGF-beta stimulation. CBF complexes repress ZBTB7B transcription factor during cytotoxic (CD8+) T cell development. They bind to RUNX-binding sequence within the ZBTB7B locus acting as transcriptional silencer and allowing for cytotoxic T cell differentiation. CBF complexes binding to the transcriptional silencer is essential for recruitment of nuclear protein complexes that catalyze epigenetic modifications to establish epigenetic ZBTB7B silencing.
Click to Show/Hide
|
||||
| Uniprot ID | |||||
| Ensembl ID | |||||
| HGNC ID | |||||
| Click to Show/Hide the Complete Species Lineage | |||||
Type(s) of Resistant Mechanism of This Molecule
 UAPP: Unusual Activation of Pro-survival Pathway
Drug Resistance Data Categorized by Drug
Approved Drug(s)
3 drug(s) in total
| Drug Resistance Data Categorized by Their Corresponding Mechanisms | ||||
|
Unusual Activation of Pro-survival Pathway (UAPP)
|
||||
| Disease Class: Hepatocellular carcinoma [ICD-11: 2C12.2] | [1] | |||
| Resistant Disease | Hepatocellular carcinoma [ICD-11: 2C12.2] | |||
| Resistant Drug | Cisplatin | |||
| Molecule Alteration | Expression | Down-regulation |
||
| Differential expression of the molecule in resistant disease | ||||
| Classification of Disease | Liver cancer [ICD-11: 2C12] | |||
| The Specified Disease | Hepatocellular carcinoma | |||
| The Studied Tissue | Liver tissue | |||
| The Expression Level of Disease Section Compare with the Healthy Individual Tissue | p-value: 3.06E-03 Fold-change: -2.47E-01 Z-score: -2.99E+00 |
|||
| Experimental Note | Identified from the Human Clinical Data | |||
| Cell Pathway Regulation | Cell proliferation | Activation | hsa05200 | |
| Wnt/Beta-catenin signaling pathway | Activation | hsa04310 | ||
| In Vitro Model | Huh-7 cells | Liver | Homo sapiens (Human) | CVCL_0336 |
| HEK293 cells | Kidney | Homo sapiens (Human) | CVCL_0045 | |
| Experiment for Molecule Alteration |
Western blot analysis | |||
| Experiment for Drug Resistance |
CCK8 assay | |||
| Mechanism Description | Oncogenic activation of the Wnt/beta-catenin signaling pathway is common in HCC. Upregulated miR-130a inhibited RUNX3 expression, which resulted in activation of Wnt/beta-catenin signaling and sequent cisplatin resistance. | |||
| Disease Class: Breast cancer [ICD-11: 2C60.3] | [3] | |||
| Resistant Disease | Breast cancer [ICD-11: 2C60.3] | |||
| Resistant Drug | Cisplatin | |||
| Molecule Alteration | Expression | Down-regulation |
||
| Experimental Note | Revealed Based on the Cell Line Data | |||
| Cell Pathway Regulation | Cell apoptosis | Inhibition | hsa04210 | |
| Cell colony | Activation | hsa05200 | ||
| Cell invasion | Activation | hsa05200 | ||
| Cell migration | Activation | hsa04670 | ||
| Cell proliferation | Activation | hsa05200 | ||
| In Vitro Model | MCF-7 cells | Breast | Homo sapiens (Human) | CVCL_0031 |
| MDA-MB-231 cells | Breast | Homo sapiens (Human) | CVCL_0062 | |
| Experiment for Molecule Alteration |
Western blot analysis | |||
| Experiment for Drug Resistance |
MTT assay | |||
| Mechanism Description | miR-106a promotes breast cancer cell proliferation and invasion through upregulation of Bcl-2, ABCG2, and P53, and downregulation of Bax and RUNX3. | |||
| Drug Sensitivity Data Categorized by Their Corresponding Mechanisms | ||||
|
Unusual Activation of Pro-survival Pathway (UAPP)
|
||||
| Disease Class: Ovarian cancer [ICD-11: 2C73.0] | [2] | |||
| Sensitive Disease | Ovarian cancer [ICD-11: 2C73.0] | |||
| Sensitive Drug | Cisplatin | |||
| Molecule Alteration | Expression | Up-regulation |
||
| Differential expression of the molecule in resistant disease | ||||
| Classification of Disease | Ovarian cancer [ICD-11: 2C73] | |||
| The Specified Disease | Ovarian cancer | |||
| The Studied Tissue | Ovarian tissue | |||
| The Expression Level of Disease Section Compare with the Healthy Individual Tissue | p-value: 3.70E-03 Fold-change: 2.27E-01 Z-score: 3.96E+00 |
|||
| Experimental Note | Revealed Based on the Cell Line Data | |||
| Cell Pathway Regulation | Cell apoptosis | Activation | hsa04210 | |
| Cell proliferation | Inhibition | hsa05200 | ||
| p53 signaling pathway | Regulation | N.A. | ||
| In Vitro Model | A2780 cells | Ovary | Homo sapiens (Human) | CVCL_0134 |
| Experiment for Molecule Alteration |
Western blot analysis | |||
| Experiment for Drug Resistance |
MTT assay; Flow cytometry assay | |||
| Mechanism Description | Inhibition of miR-23a expression increases the sensitivity of A2780 cells to cisplatin possibly by inhibiting the negative regulation by miR-23a target genes that causes inhibition of P-gp protein expression. | |||
| Drug Resistance Data Categorized by Their Corresponding Mechanisms | ||||
|
Unusual Activation of Pro-survival Pathway (UAPP)
|
||||
| Disease Class: Gastric cancer [ICD-11: 2B72.1] | [4] | |||
| Resistant Disease | Gastric cancer [ICD-11: 2B72.1] | |||
| Resistant Drug | Doxorubicin | |||
| Molecule Alteration | Expression | Down-regulation |
||
| Experimental Note | Revealed Based on the Cell Line Data | |||
| Cell Pathway Regulation | Cell apoptosis | Inhibition | hsa04210 | |
| Cell proliferation | Activation | hsa05200 | ||
| TGF-beta signaling pathway | Regulation | N.A. | ||
| In Vitro Model | SGC7901 cells | Gastric | Homo sapiens (Human) | CVCL_0520 |
| Experiment for Molecule Alteration |
Western blot analysis | |||
| Experiment for Drug Resistance |
MTT assay | |||
| Mechanism Description | miR-106a, elevated in multidrug-resistant GC cell lines, suppressed the sensitivity of GC cells to chemo-therapeutic drugs by accelerating drug efflux and reducing apoptosis. Moreover, we validated RUNX3 as a target of miR-106a in GC cells, indicating that miR-106a might modulate MDR by regulating RUNX3 in GC. | |||
| Drug Resistance Data Categorized by Their Corresponding Mechanisms | ||||
|
Unusual Activation of Pro-survival Pathway (UAPP)
|
||||
| Disease Class: Gastric cancer [ICD-11: 2B72.1] | [4] | |||
| Resistant Disease | Gastric cancer [ICD-11: 2B72.1] | |||
| Resistant Drug | Vincristine | |||
| Molecule Alteration | Expression | Down-regulation |
||
| Experimental Note | Revealed Based on the Cell Line Data | |||
| Cell Pathway Regulation | Cell apoptosis | Inhibition | hsa04210 | |
| Cell proliferation | Activation | hsa05200 | ||
| TGF-beta signaling pathway | Regulation | N.A. | ||
| In Vitro Model | SGC7901 cells | Gastric | Homo sapiens (Human) | CVCL_0520 |
| Experiment for Molecule Alteration |
Western blot analysis | |||
| Experiment for Drug Resistance |
MTT assay | |||
| Mechanism Description | miR-106a, elevated in multidrug-resistant GC cell lines, suppressed the sensitivity of GC cells to chemo-therapeutic drugs by accelerating drug efflux and reducing apoptosis. Moreover, we validated RUNX3 as a target of miR-106a in GC cells, indicating that miR-106a might modulate MDR by regulating RUNX3 in GC. | |||
Disease- and Tissue-specific Abundances of This Molecule
ICD Disease Classification 02

| Differential expression of molecule in resistant diseases | ||
| The Studied Tissue | Gastric tissue | |
| The Specified Disease | Gastric cancer | |
| The Expression Level of Disease Section Compare with the Healthy Individual Tissue | p-value: 9.41E-01; Fold-change: 1.23E-01; Z-score: 1.97E-01 | |
| The Expression Level of Disease Section Compare with the Adjacent Tissue | p-value: 3.88E-02; Fold-change: -2.56E-01; Z-score: -3.56E-01 | |
|
Molecule expression in the normal tissue adjacent to the diseased tissue of patients
Molecule expression in the diseased tissue of patients
Molecule expression in the normal tissue of healthy individuals
|
||
| Disease-specific Molecule Abundances |

|
Click to View the Clearer Original Diagram |
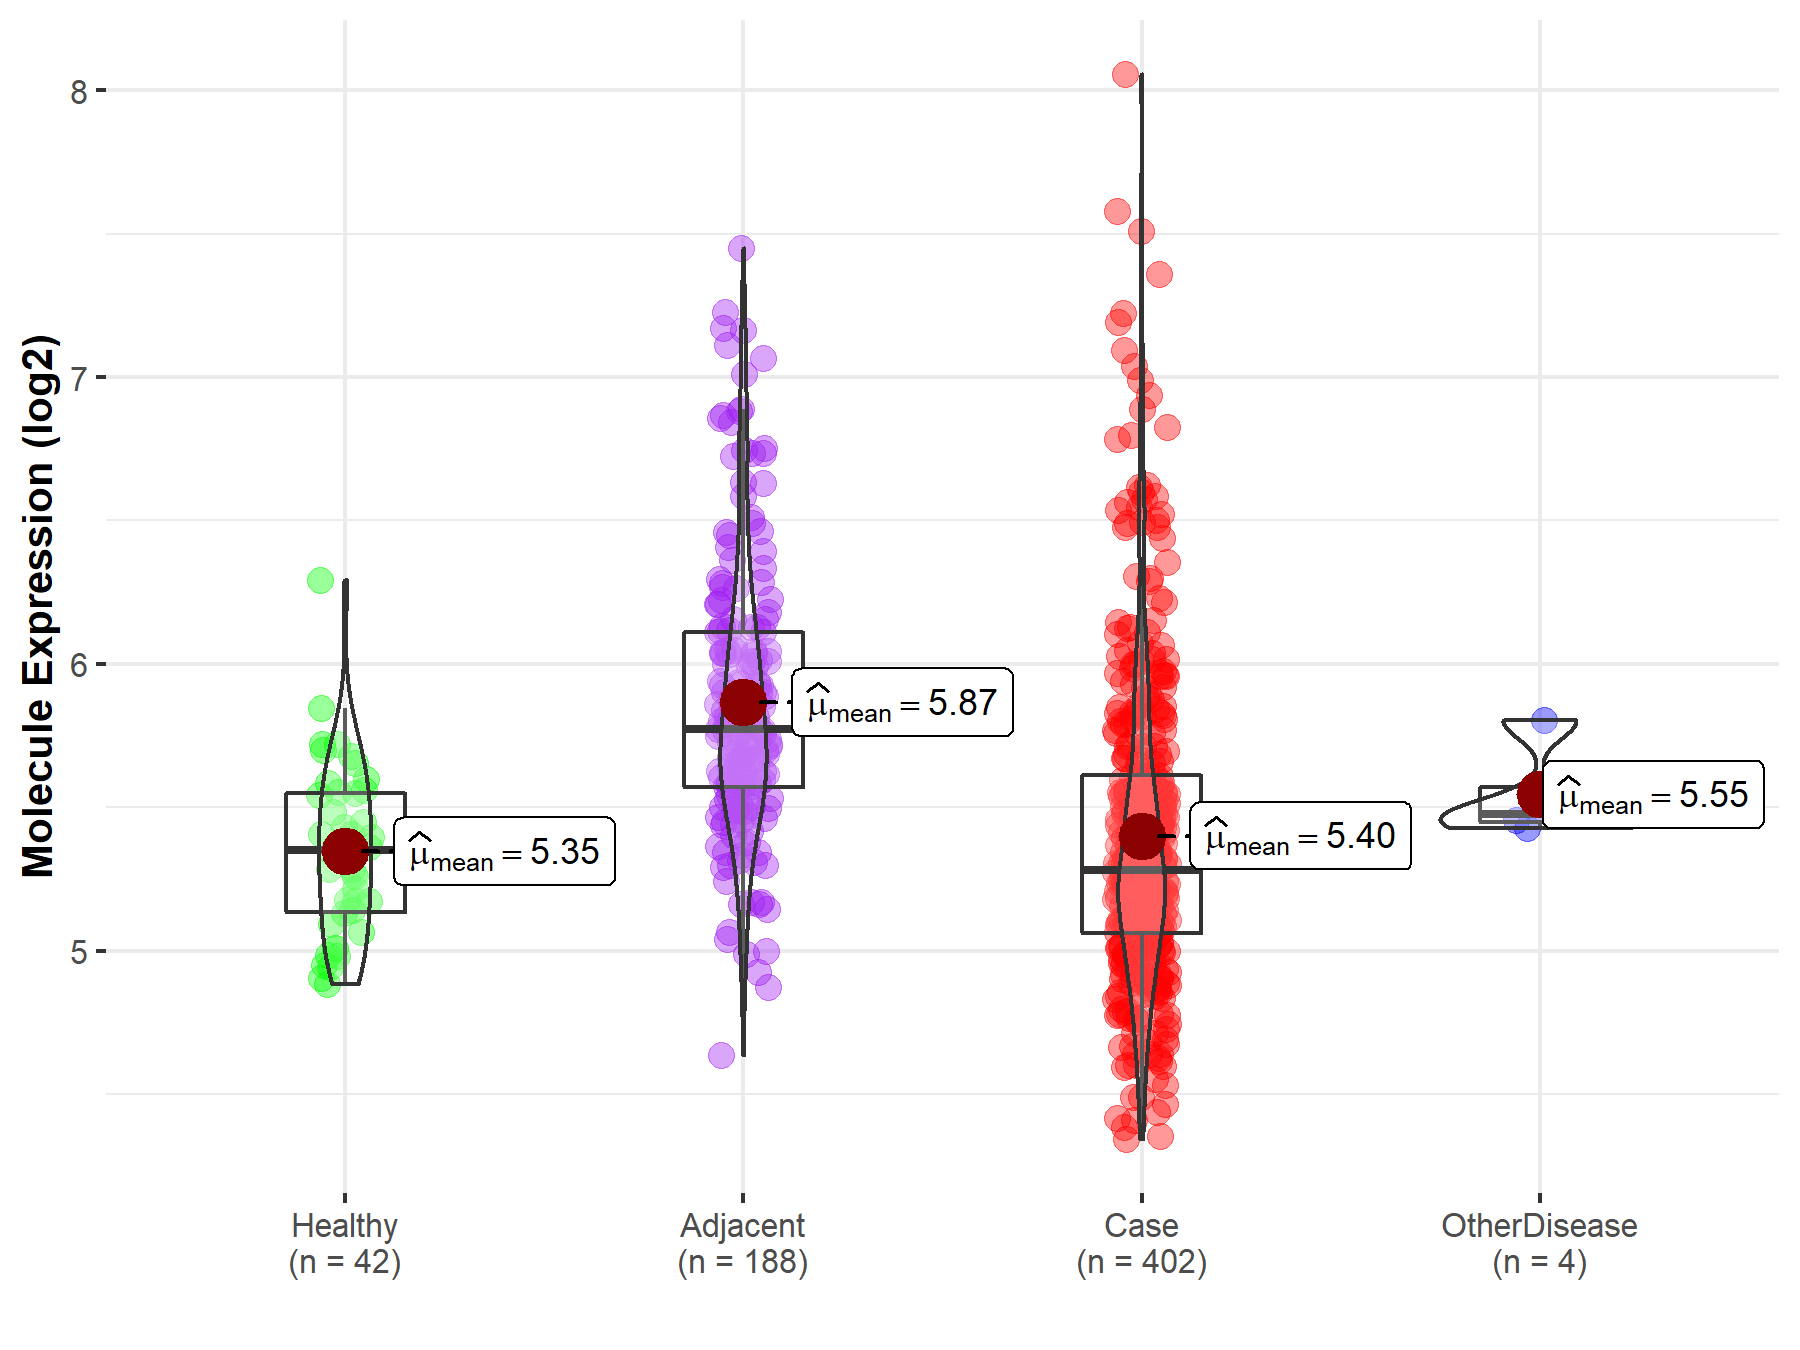
| Differential expression of molecule in resistant diseases | ||
| The Studied Tissue | Liver | |
| The Specified Disease | Liver cancer | |
| The Expression Level of Disease Section Compare with the Healthy Individual Tissue | p-value: 3.24E-01; Fold-change: -7.01E-02; Z-score: -2.34E-01 | |
| The Expression Level of Disease Section Compare with the Adjacent Tissue | p-value: 8.05E-22; Fold-change: -4.92E-01; Z-score: -9.95E-01 | |
| The Expression Level of Disease Section Compare with the Other Disease Section | p-value: 1.97E-01; Fold-change: -1.93E-01; Z-score: -1.11E+00 | |
|
Molecule expression in the normal tissue adjacent to the diseased tissue of patients
Molecule expression in the diseased tissue of patients
Molecule expression in the normal tissue of healthy individuals
Molecule expression in tissue other than the diseased tissue of patients
|
||
| Disease-specific Molecule Abundances |
|
Click to View the Clearer Original Diagram |
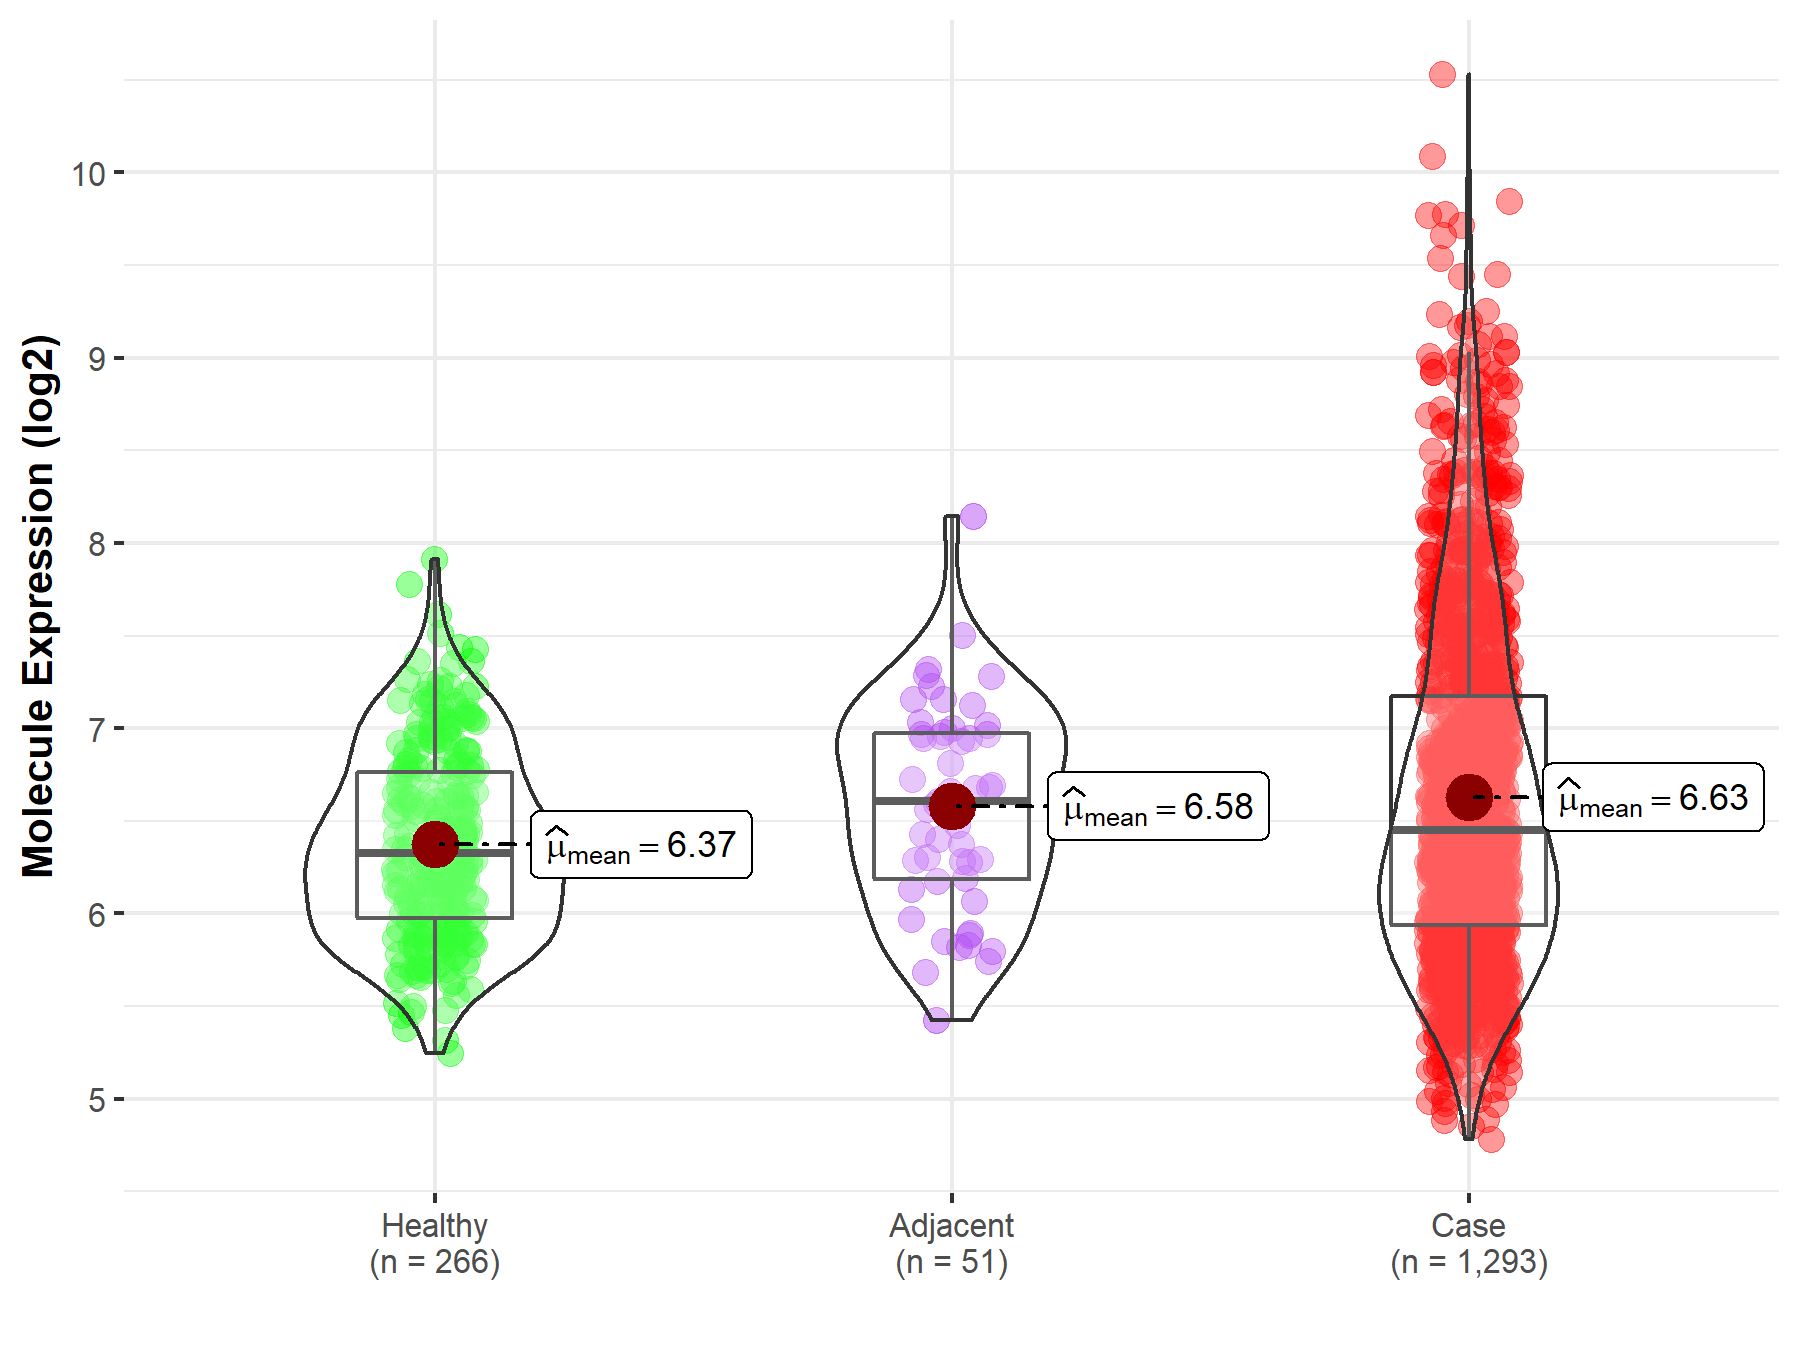
| Differential expression of molecule in resistant diseases | ||
| The Studied Tissue | Breast tissue | |
| The Specified Disease | Breast cancer | |
| The Expression Level of Disease Section Compare with the Healthy Individual Tissue | p-value: 7.67E-10; Fold-change: 1.23E-01; Z-score: 2.42E-01 | |
| The Expression Level of Disease Section Compare with the Adjacent Tissue | p-value: 5.65E-01; Fold-change: -1.60E-01; Z-score: -2.87E-01 | |
|
Molecule expression in the normal tissue adjacent to the diseased tissue of patients
Molecule expression in the diseased tissue of patients
Molecule expression in the normal tissue of healthy individuals
|
||
| Disease-specific Molecule Abundances |
|
Click to View the Clearer Original Diagram |
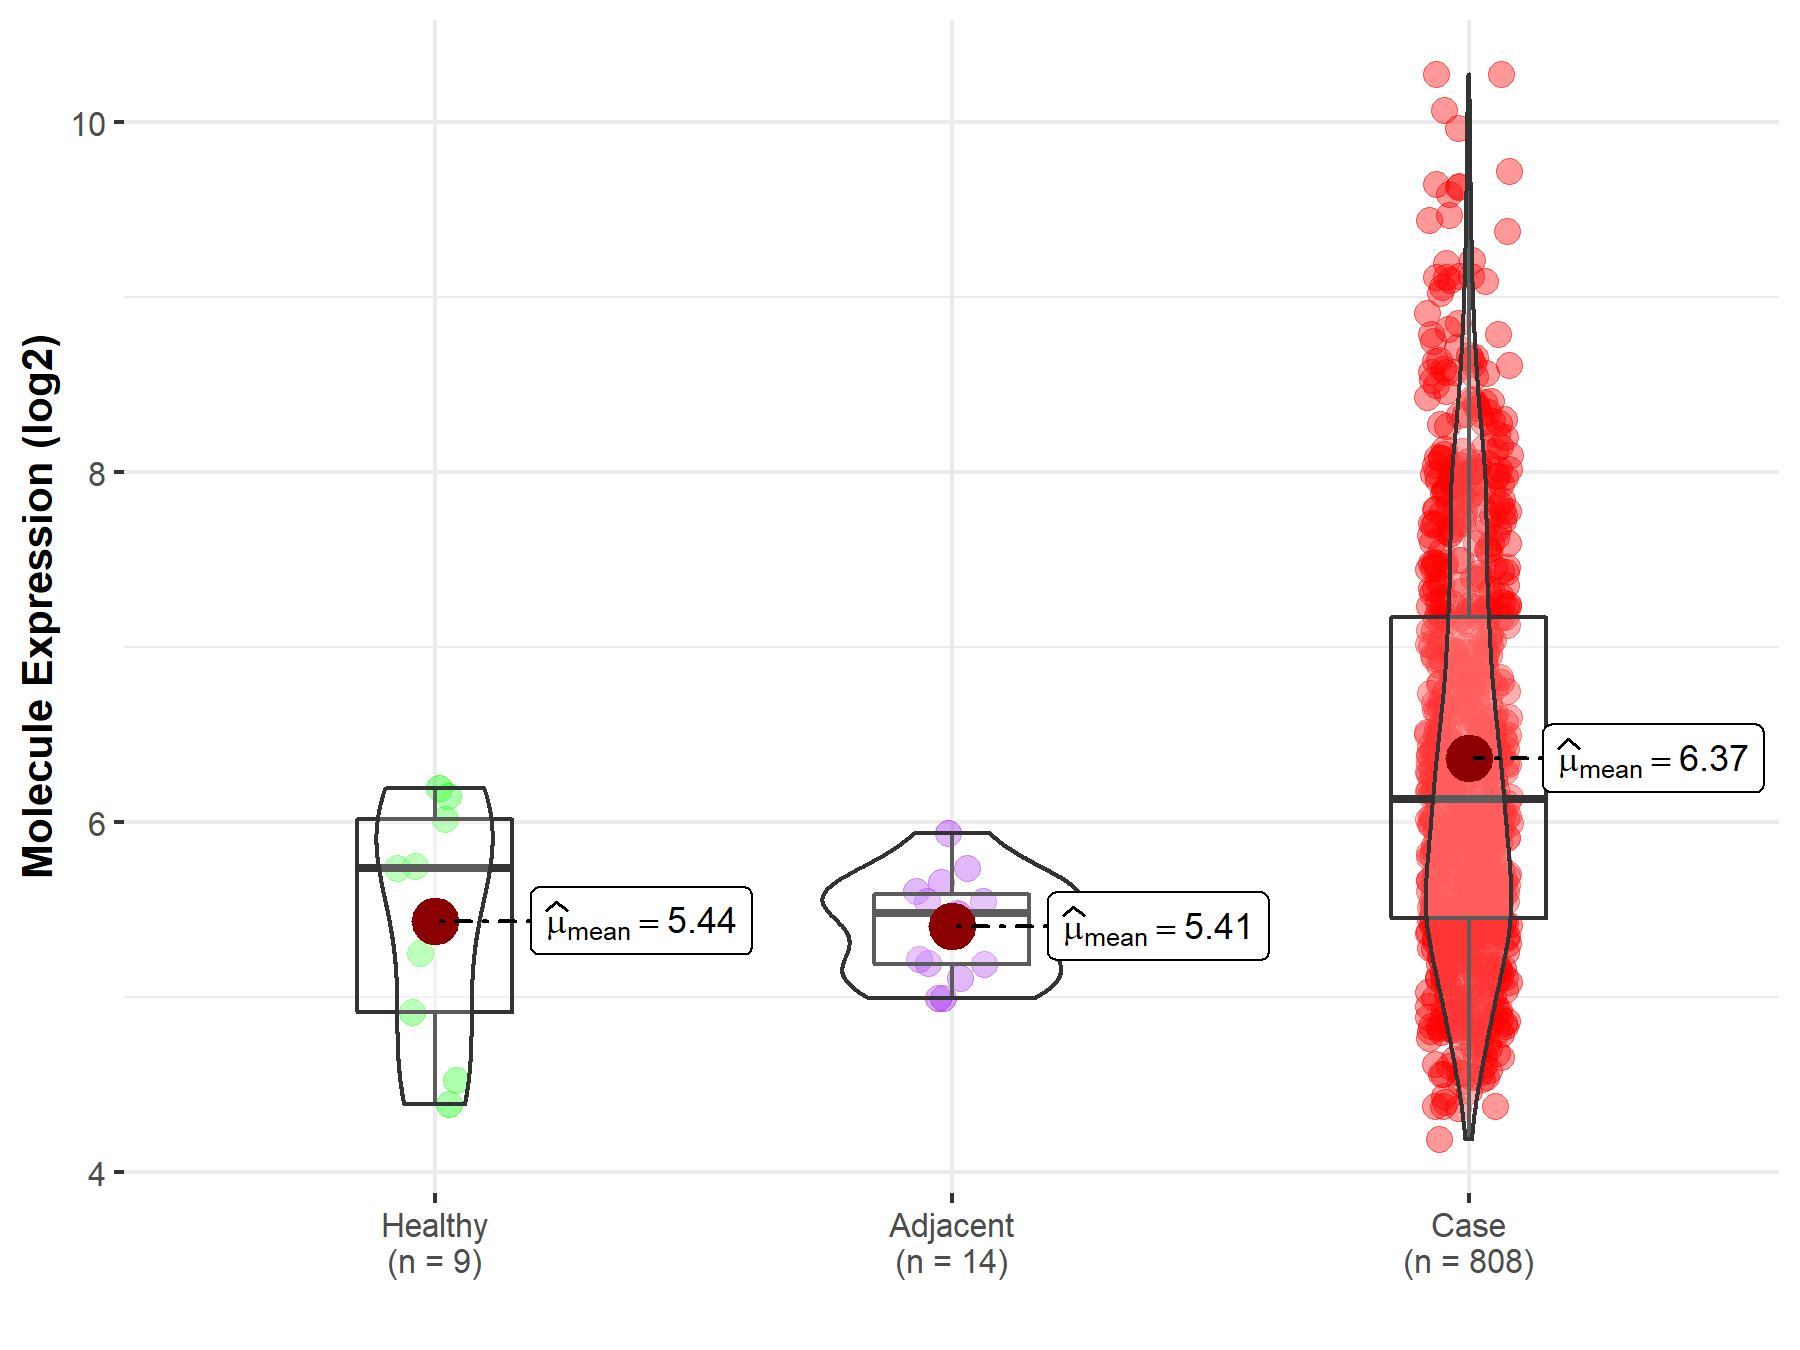
| Differential expression of molecule in resistant diseases | ||
| The Studied Tissue | Ovary | |
| The Specified Disease | Ovarian cancer | |
| The Expression Level of Disease Section Compare with the Healthy Individual Tissue | p-value: 3.70E-03; Fold-change: 3.95E-01; Z-score: 5.71E-01 | |
| The Expression Level of Disease Section Compare with the Adjacent Tissue | p-value: 3.50E-10; Fold-change: 6.55E-01; Z-score: 2.25E+00 | |
|
Molecule expression in the normal tissue adjacent to the diseased tissue of patients
Molecule expression in the diseased tissue of patients
Molecule expression in the normal tissue of healthy individuals
|
||
| Disease-specific Molecule Abundances |
|
Click to View the Clearer Original Diagram |
Tissue-specific Molecule Abundances in Healthy Individuals

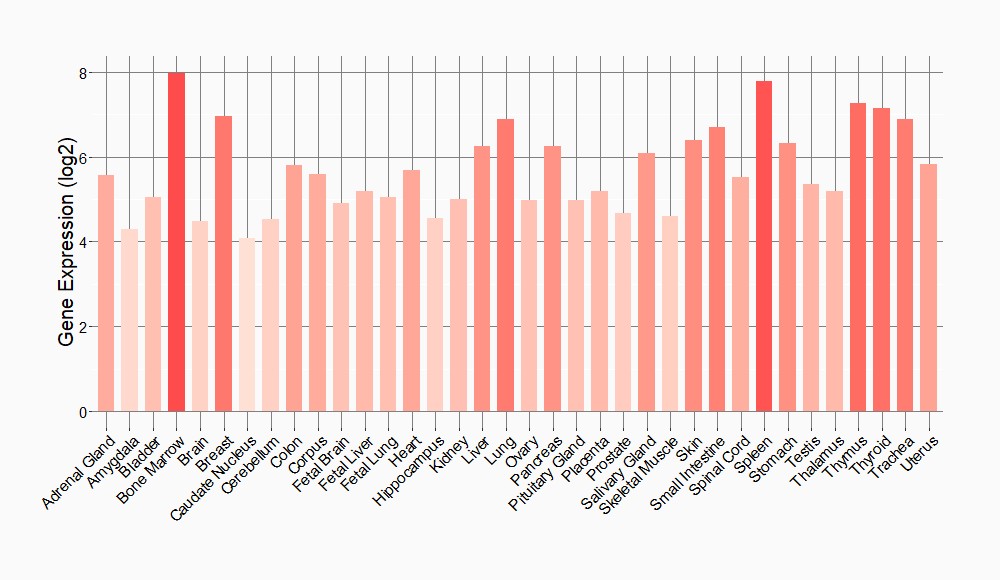
|
||
References
If you find any error in data or bug in web service, please kindly report it to Dr. Sun and Dr. Yu.