Molecule Information
General Information of the Molecule (ID: Mol00614)
| Name |
Runt-related transcription factor 2 (RUNX2)
,Homo sapiens
|
||||
|---|---|---|---|---|---|
| Synonyms |
Acute myeloid leukemia 3 protein; Core-binding factor subunit alpha-1; CBF-alpha-1; Oncogene AML-3; Osteoblast-specific transcription factor 2; OSF-2; Polyomavirus enhancer-binding protein 2 alpha A subunit; PEA2-alpha A; PEBP2-alpha A; SL3-3 enhancer factor 1 alpha A subunit; SL3/AKV core-binding factor alpha A subunit; AML3; CBFA1; OSF2; PEBP2A
Click to Show/Hide
|
||||
| Molecule Type |
Protein
|
||||
| Gene Name |
RUNX2
|
||||
| Gene ID | |||||
| Location |
chr6:45328157-45664349[+]
|
||||
| Sequence |
MASNSLFSTVTPCQQNFFWDPSTSRRFSPPSSSLQPGKMSDVSPVVAAQQQQQQQQQQQQ
QQQQQQQQQQQEAAAAAAAAAAAAAAAAAVPRLRPPHDNRTMVEIIADHPAELVRTDSPN FLCSVLPSHWRCNKTLPVAFKVVALGEVPDGTVVTVMAGNDENYSAELRNASAVMKNQVA RFNDLRFVGRSGRGKSFTLTITVFTNPPQVATYHRAIKVTVDGPREPRRHRQKLDDSKPS LFSDRLSDLGRIPHPSMRVGVPPQNPRPSLNSAPSPFNPQGQSQITDPRQAQSSPPWSYD QSYPSYLSQMTSPSIHSTTPLSSTRGTGLPAITDVPRRISDDDTATSDFCLWPSTLSKKS QAGASELGPFSDPRQFPSISSLTESRFSNPRMHYPATFTYTPPVTSGMSLGMSATTHYHT YLPPPYPGSSQSQSGPFQTSSTPYLYYGTSSGSYQFPMVPGGDRSPSRMLPPCTTTSNGS TLLNPNLPNQNDGVDADGSHSSSPTVLNSSGRMDESVWRPY Click to Show/Hide
|
||||
| 3D-structure |
|
||||
| Function |
Transcription factor involved in osteoblastic differentiation and skeletal morphogenesis. Essential for the maturation of osteoblasts and both intramembranous and endochondral ossification. CBF binds to the core site, 5'-PYGPYGGT-3', of a number of enhancers and promoters, including murine leukemia virus, polyomavirus enhancer, T-cell receptor enhancers, osteocalcin, osteopontin, bone sialoprotein, alpha 1(I) collagen, LCK, IL-3 and GM-CSF promoters. In osteoblasts, supports transcription activation: synergizes with SPEN/MINT to enhance FGFR2-mediated activation of the osteocalcin FGF-responsive element (OCFRE). Inhibits KAT6B-dependent transcriptional activation.
Click to Show/Hide
|
||||
| Uniprot ID | |||||
| Ensembl ID | |||||
| HGNC ID | |||||
| Click to Show/Hide the Complete Species Lineage | |||||
Type(s) of Resistant Mechanism of This Molecule
Drug Resistance Data Categorized by Drug
Approved Drug(s)
1 drug(s) in total
| Drug Sensitivity Data Categorized by Their Corresponding Mechanisms | ||||
|
|
||||
| Disease Class: Glioma [ICD-11: 2A00.1] | [1] | |||
| Sensitive Disease | Glioma [ICD-11: 2A00.1] | |||
| Sensitive Drug | Doxorubicin | |||
| Molecule Alteration | Expression | Down-regulation |
||
| Differential expression of the molecule in resistant disease | ||||
| Classification of Disease | Brain cancer [ICD-11: 2A00] | |||
| The Specified Disease | Neuroectodermal tumor | |||
| The Studied Tissue | Brainstem tissue | |||
| The Expression Level of Disease Section Compare with the Healthy Individual Tissue | p-value: 8.54E-03 Fold-change: -5.73E-02 Z-score: -3.10E+00 |
|||
| Experimental Note | Revealed Based on the Cell Line Data | |||
| Cell Pathway Regulation | AKT signaling pathway | Inhibition | hsa04151 | |
| Cell apoptosis | Activation | hsa04210 | ||
| Cell proliferation | Inhibition | hsa05200 | ||
| In Vitro Model | U251 cells | Brain | Homo sapiens (Human) | CVCL_0021 |
| U87-MG cells | Brain | Homo sapiens (Human) | CVCL_0022 | |
| Experiment for Molecule Alteration |
Western blot analysis | |||
| Experiment for Drug Resistance |
MTS assay; Flow cytometry assay | |||
| Mechanism Description | microRNA-127 silencing significantly affects cell growth and increases the sensitivity to adriamycin. microRNA-127 silencing arrests the cell cycle, potentiates adriamycin-induced apoptosis, and increases cellular Rh-123 uptake. microRNA-127 silencing down-regulates MDR1, MRP1, Runx2, Bcl-2, Survivin and ErbB4 expression while up-regulates p53 expression. microRNA-127 silencing inhibits AkT phosphorylation. | |||
Disease- and Tissue-specific Abundances of This Molecule
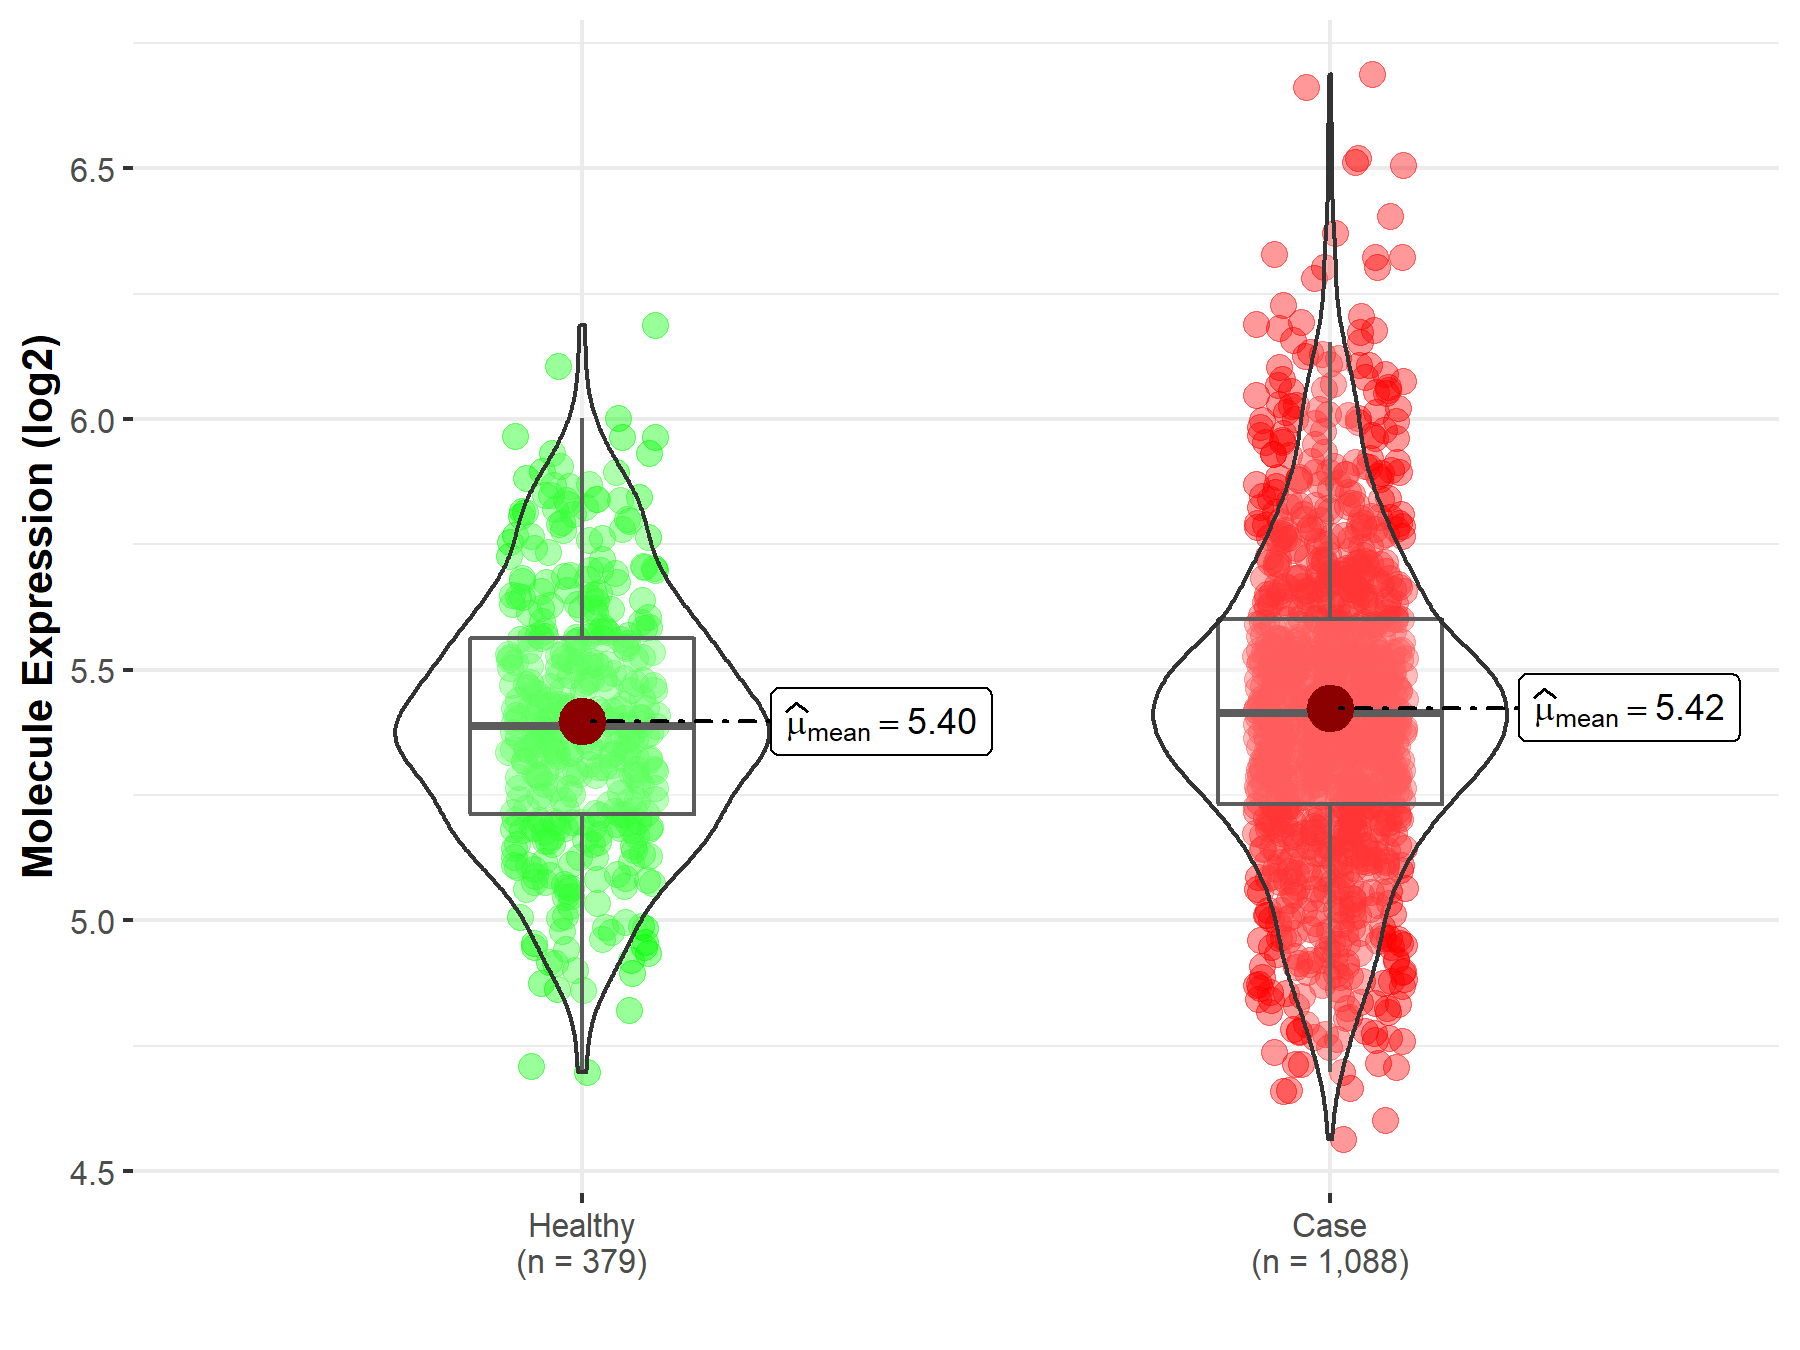
ICD Disease Classification 02

| Differential expression of molecule in resistant diseases | ||
| The Studied Tissue | Nervous tissue | |
| The Specified Disease | Brain cancer | |
| The Expression Level of Disease Section Compare with the Healthy Individual Tissue | p-value: 9.47E-02; Fold-change: 2.64E-02; Z-score: 1.03E-01 | |
|
Molecule expression in the diseased tissue of patients
Molecule expression in the normal tissue of healthy individuals
|
||
| Disease-specific Molecule Abundances |

|
Click to View the Clearer Original Diagram |
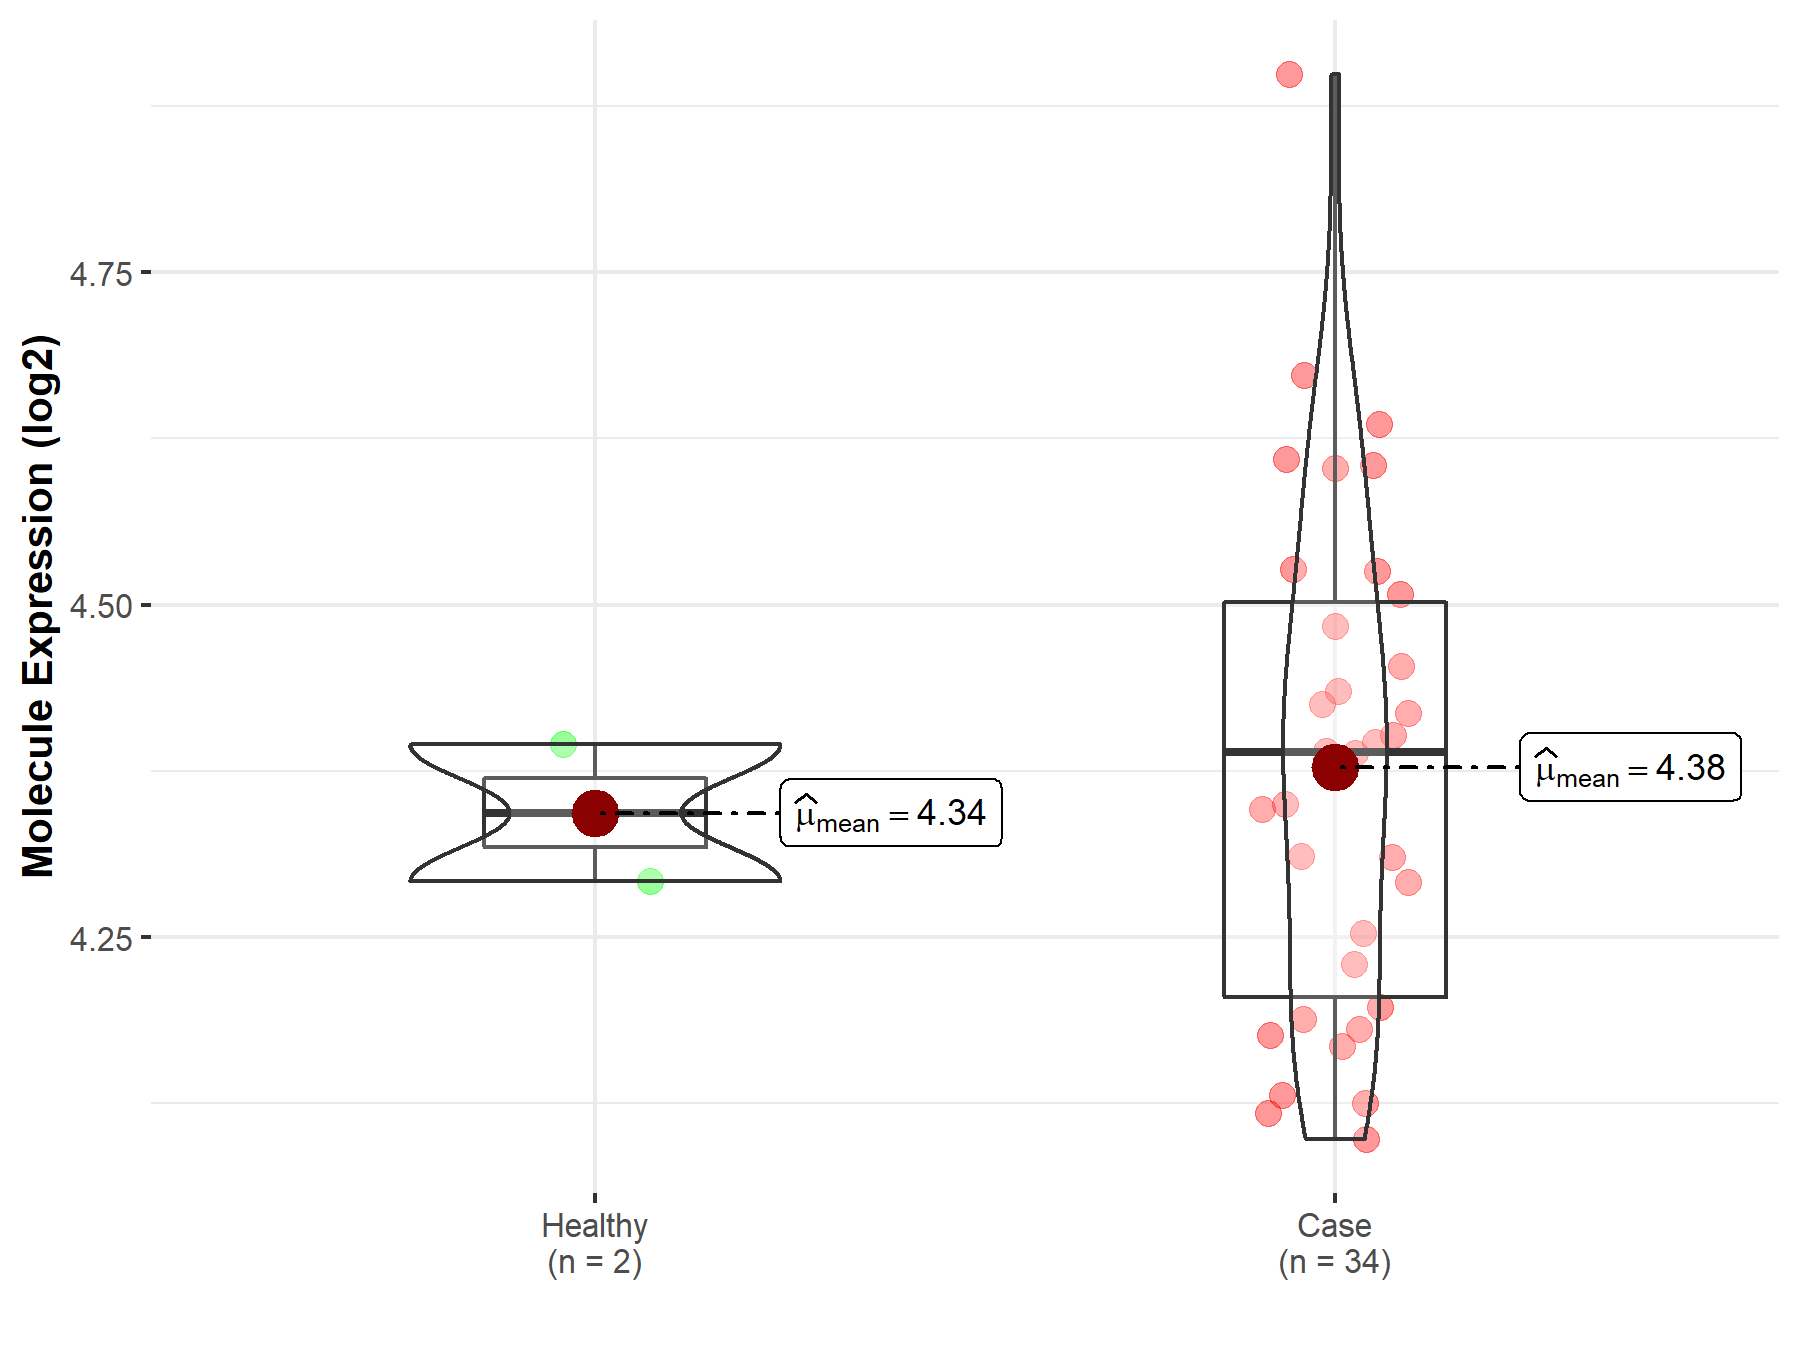
| The Studied Tissue | Brainstem tissue | |
| The Specified Disease | Glioma | |
| The Expression Level of Disease Section Compare with the Healthy Individual Tissue | p-value: 6.30E-01; Fold-change: 4.57E-02; Z-score: 6.25E-01 | |
|
Molecule expression in the diseased tissue of patients
Molecule expression in the normal tissue of healthy individuals
|
||
| Disease-specific Molecule Abundances |

|
Click to View the Clearer Original Diagram |
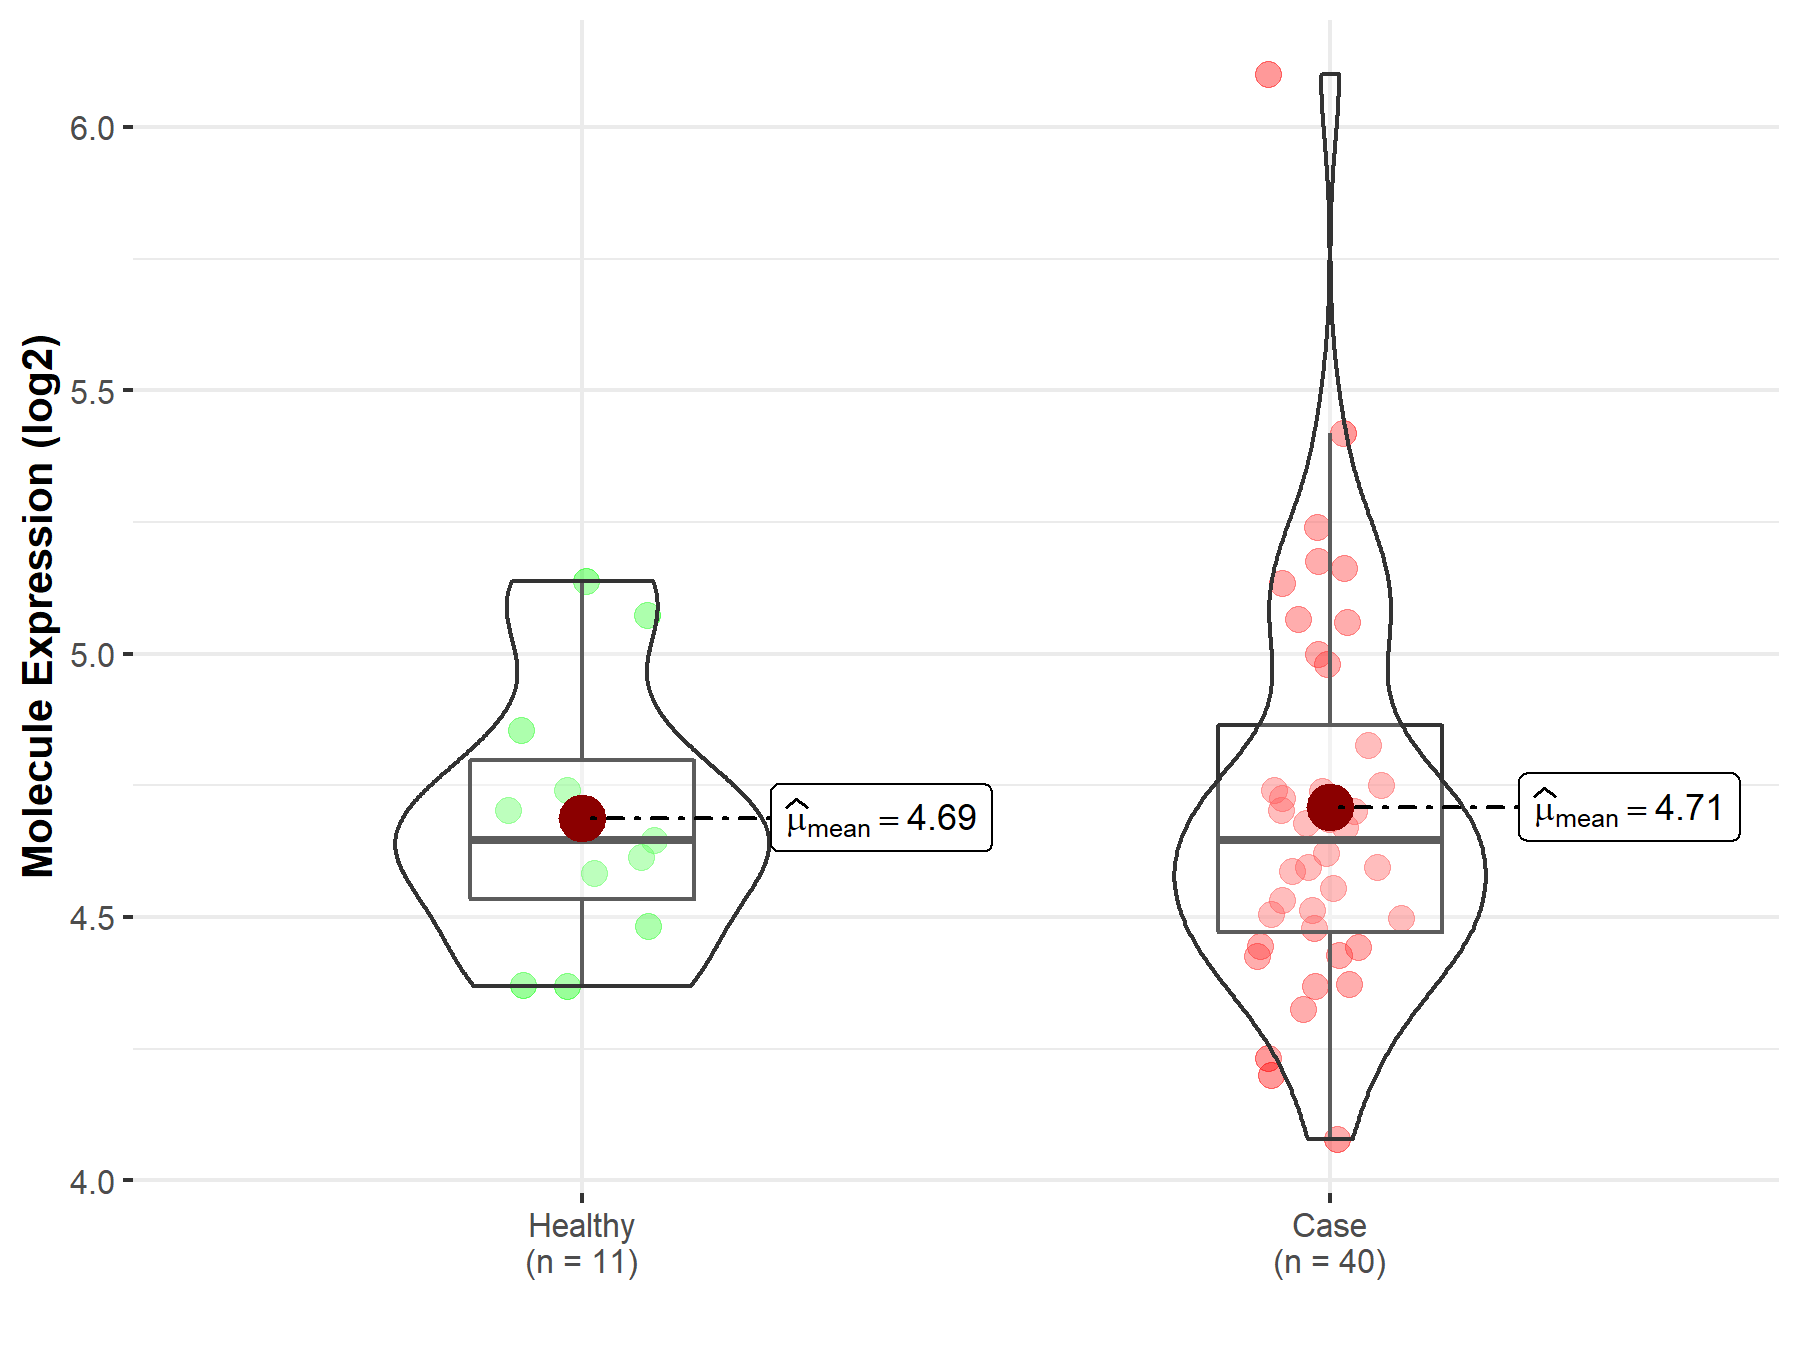
| The Studied Tissue | White matter | |
| The Specified Disease | Glioma | |
| The Expression Level of Disease Section Compare with the Healthy Individual Tissue | p-value: 8.36E-01; Fold-change: 1.03E-03; Z-score: 4.05E-03 | |
|
Molecule expression in the diseased tissue of patients
Molecule expression in the normal tissue of healthy individuals
|
||
| Disease-specific Molecule Abundances |

|
Click to View the Clearer Original Diagram |
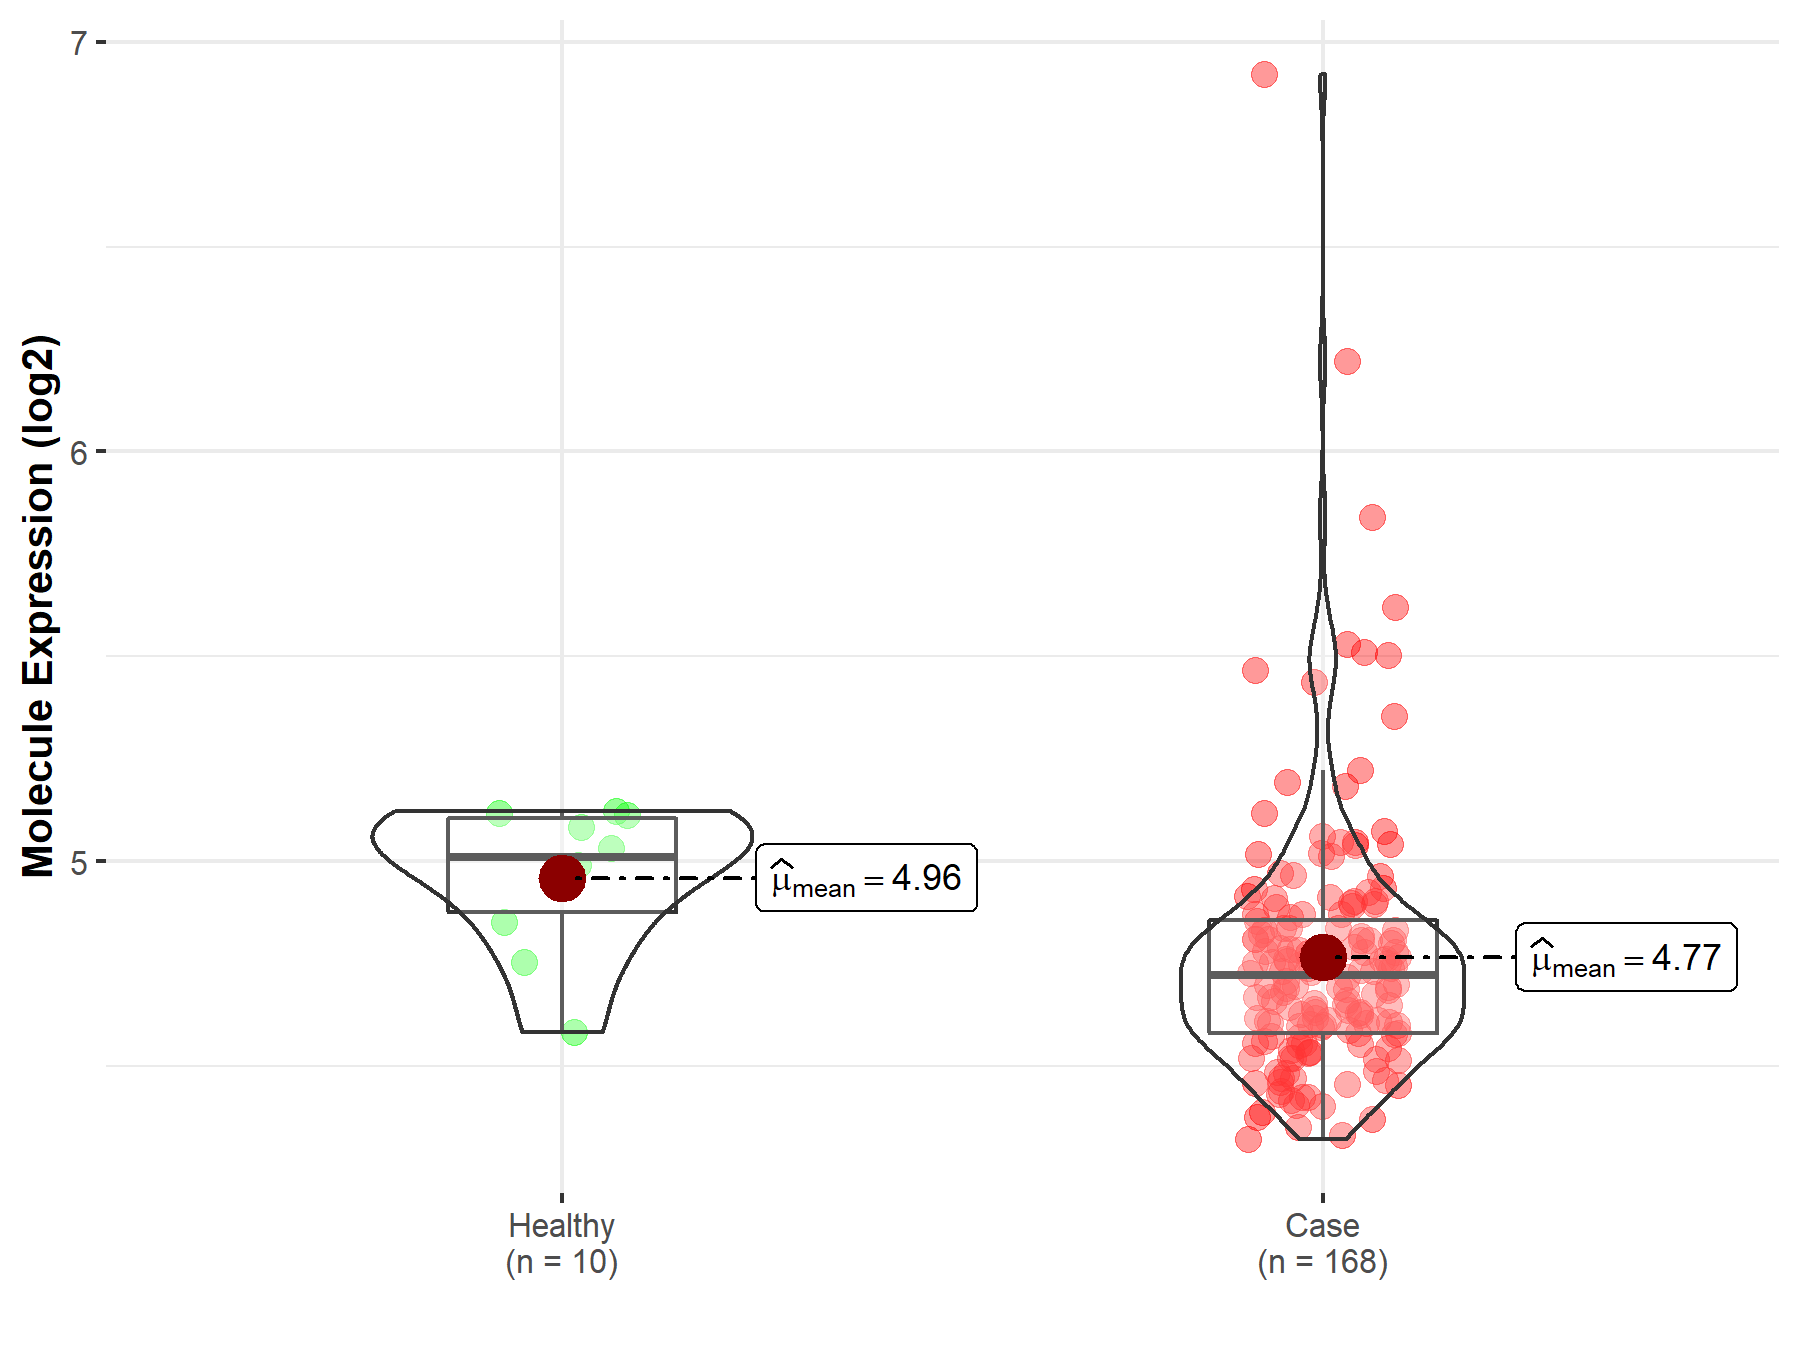
| The Studied Tissue | Brainstem tissue | |
| The Specified Disease | Neuroectodermal tumor | |
| The Expression Level of Disease Section Compare with the Healthy Individual Tissue | p-value: 8.54E-03; Fold-change: -2.90E-01; Z-score: -1.61E+00 | |
|
Molecule expression in the diseased tissue of patients
Molecule expression in the normal tissue of healthy individuals
|
||
| Disease-specific Molecule Abundances |

|
Click to View the Clearer Original Diagram |
Tissue-specific Molecule Abundances in Healthy Individuals


|
||
References
If you find any error in data or bug in web service, please kindly report it to Dr. Sun and Dr. Yu.
