Molecule Information
General Information of the Molecule (ID: Mol00589)
| Name |
Ras-related protein Rap-1b (RAP1B)
,Homo sapiens
|
||||
|---|---|---|---|---|---|
| Synonyms |
GTP-binding protein smg p21B; OK/SW-cl.11
Click to Show/Hide
|
||||
| Molecule Type |
Protein
|
||||
| Gene Name |
RAP1B
|
||||
| Gene ID | |||||
| Location |
chr12:68610855-68671901[+]
|
||||
| Sequence |
MREYKLVVLGSGGVGKSALTVQFVQGIFVEKYDPTIEDSYRKQVEVDAQQCMLEILDTAG
TEQFTAMRDLYMKNGQGFALVYSITAQSTFNDLQDLREQILRVKDTDDVPMILVGNKCDL EDERVVGKEQGQNLARQWNNCAFLESSAKSKINVNEIFYDLVRQINRKTPVPGKARKKSS CQLL Click to Show/Hide
|
||||
| 3D-structure |
|
||||
| Function |
GTP-binding protein that possesses intrinsic GTPase activity. Contributes to the polarizing activity of KRIT1 and CDH5 in the establishment and maintenance of correct endothelial cell polarity and vascular lumen. Required for the localization of phosphorylated PRKCZ, PARD3 and TIAM1 to the cell junction. Plays a role in the establishment of basal endothelial barrier function.
Click to Show/Hide
|
||||
| Uniprot ID | |||||
| Ensembl ID | |||||
| HGNC ID | |||||
| Click to Show/Hide the Complete Species Lineage | |||||
Type(s) of Resistant Mechanism of This Molecule
Drug Resistance Data Categorized by Drug
Approved Drug(s)
1 drug(s) in total
| Drug Sensitivity Data Categorized by Their Corresponding Mechanisms | ||||
|
|
||||
| Disease Class: Glioblastoma [ICD-11: 2A00.02] | [1] | |||
| Sensitive Disease | Glioblastoma [ICD-11: 2A00.02] | |||
| Sensitive Drug | Temozolomide | |||
| Molecule Alteration | Expression | Down-regulation |
||
| Differential expression of the molecule in resistant disease | ||||
| Classification of Disease | Brain cancer [ICD-11: 2A00] | |||
| The Specified Disease | Glioblastoma | |||
| The Studied Tissue | Nervous tissue | |||
| The Expression Level of Disease Section Compare with the Healthy Individual Tissue | p-value: 3.37E-09 Fold-change: -3.47E-01 Z-score: -7.90E+00 |
|||
| Experimental Note | Revealed Based on the Cell Line Data | |||
| Cell Pathway Regulation | Cell invasion | Inhibition | hsa05200 | |
| Cell proliferation | Inhibition | hsa05200 | ||
| In Vitro Model | U251 cells | Brain | Homo sapiens (Human) | CVCL_0021 |
| U87 cells | Brain | Homo sapiens (Human) | CVCL_0022 | |
| Experiment for Molecule Alteration |
Western blot analysis | |||
| Experiment for Drug Resistance |
MTT assay | |||
| Mechanism Description | Expression of Rap1B is negatively regulated by miR-128 and miR-149. TMZ inhibits Rap1B expression by upregulating miR-128 and miR-149. miR-128 and miR-149 suppress cell proliferation and invasion, and alter cytoskeletal remodeling by affecting Rap1B-associated small GTPase. miR-128 and miR-149 increase the chemosensitivity of TMZ in glioblastoma cells. | |||
| Disease Class: Glioblastoma [ICD-11: 2A00.02] | [2] | |||
| Sensitive Disease | Glioblastoma [ICD-11: 2A00.02] | |||
| Sensitive Drug | Temozolomide | |||
| Molecule Alteration | Expression | Down-regulation |
||
| Differential expression of the molecule in resistant disease | ||||
| Classification of Disease | Brain cancer [ICD-11: 2A00] | |||
| The Specified Disease | Glioma | |||
| The Studied Tissue | White matter | |||
| The Expression Level of Disease Section Compare with the Healthy Individual Tissue | p-value: 2.81E-03 Fold-change: -2.95E-02 Z-score: -3.38E+00 |
|||
| Experimental Note | Identified from the Human Clinical Data | |||
| Cell Pathway Regulation | Cell invasion | Inhibition | hsa05200 | |
| Cell proliferation | Inhibition | hsa05200 | ||
| In Vitro Model | U251 cells | Brain | Homo sapiens (Human) | CVCL_0021 |
| U87 cells | Brain | Homo sapiens (Human) | CVCL_0022 | |
| Experiment for Molecule Alteration |
Western blot analysis | |||
| Experiment for Drug Resistance |
MTT assay | |||
| Mechanism Description | Ras-associated protein 1 (Rap1), a growth regulatory protein, belongs to a member of RAS-like small GTP-binding protein superfamily. Rap1 regulates several basic cellular functions: migration, adhesion and growth. TMZ can inhibit the Rap1B expression to exert its cell killing by upregulating miR-181a/b/c/d subunits; conversely, each miR-181a/b/c/d subunit enhanced the chemosensitivity of TMZ in glioblastoma. | |||
Disease- and Tissue-specific Abundances of This Molecule
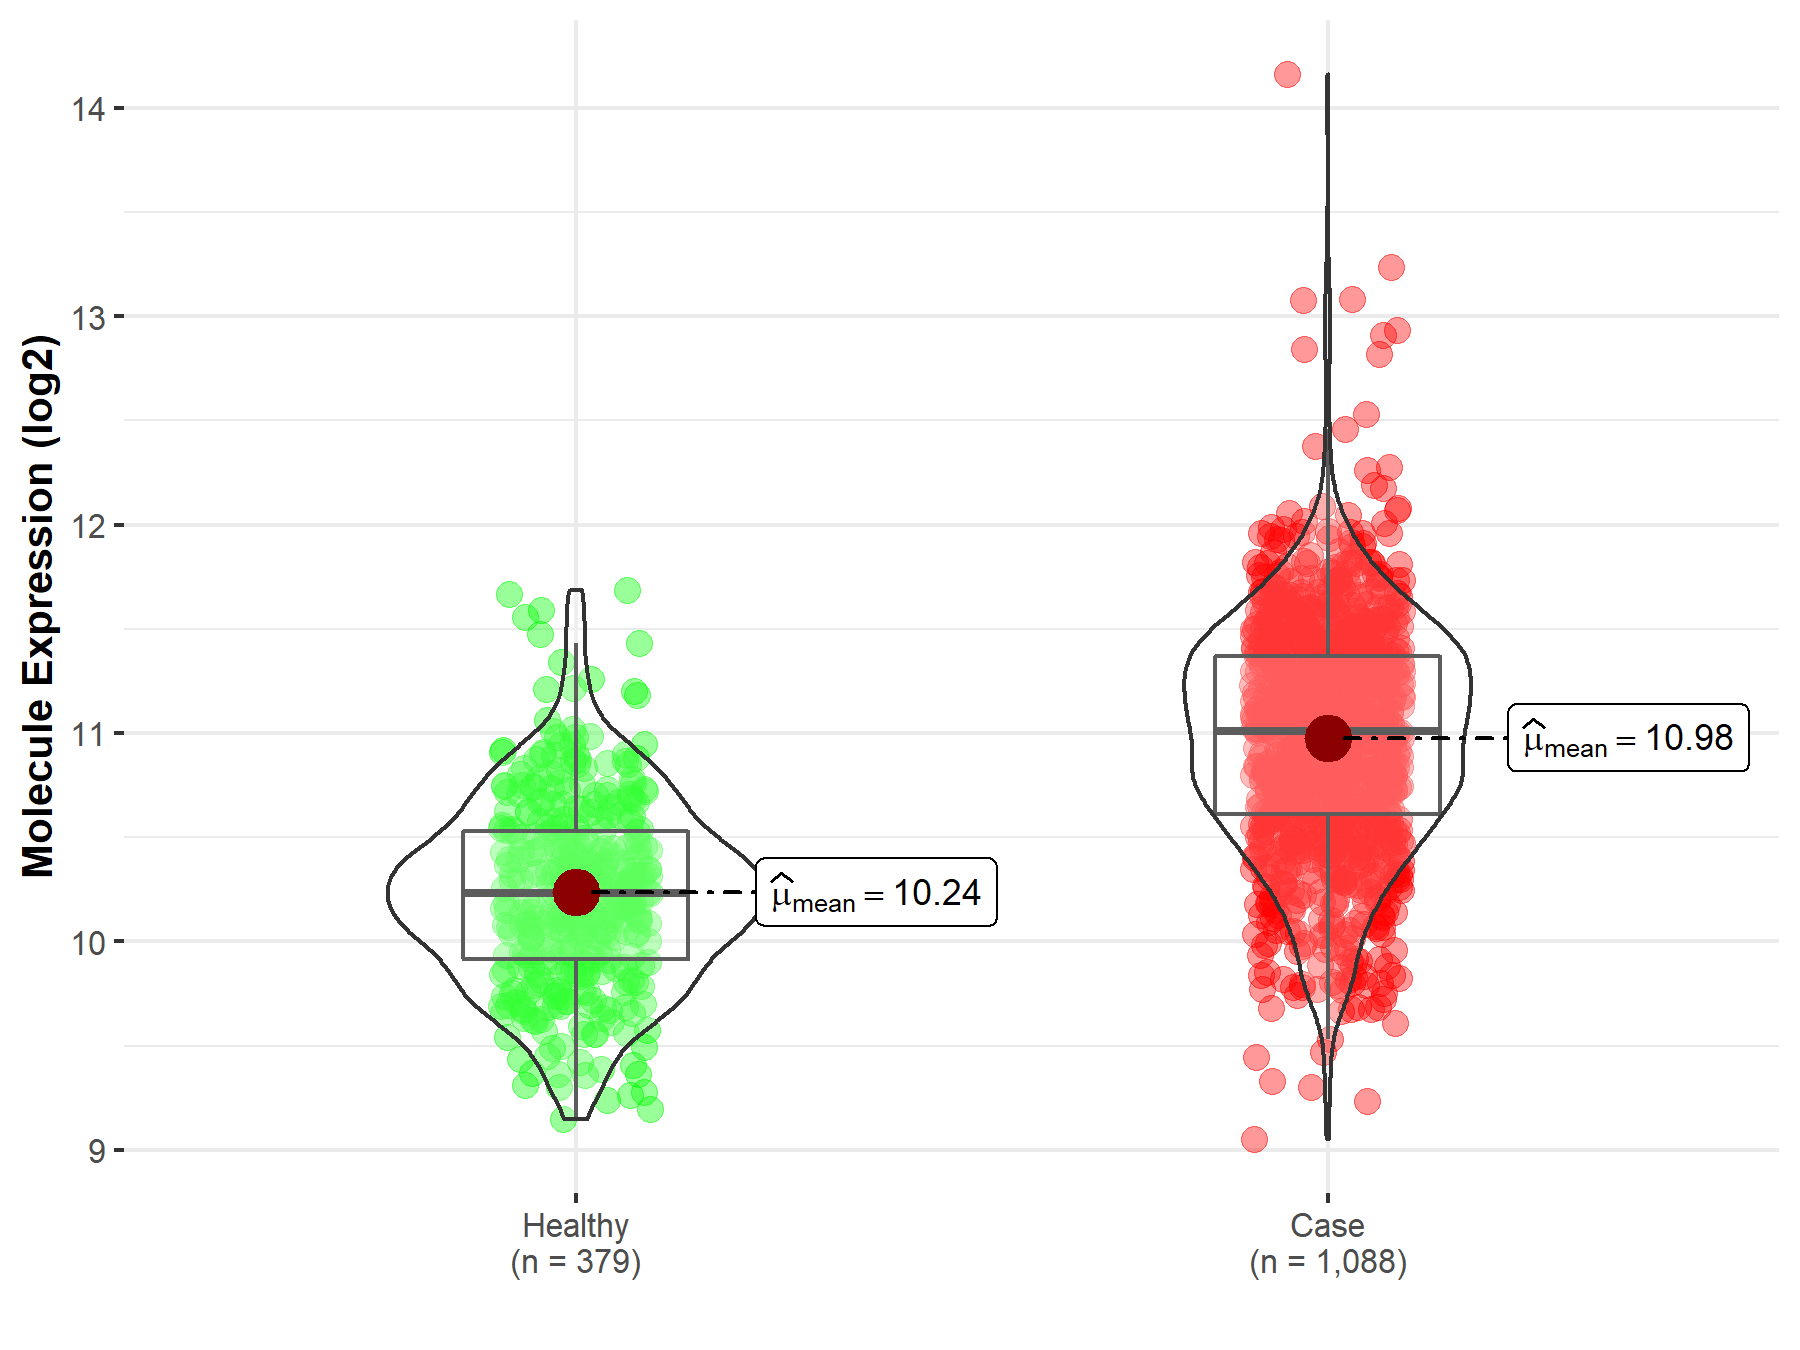
ICD Disease Classification 02

| Differential expression of molecule in resistant diseases | ||
| The Studied Tissue | Nervous tissue | |
| The Specified Disease | Brain cancer | |
| The Expression Level of Disease Section Compare with the Healthy Individual Tissue | p-value: 5.83E-106; Fold-change: 7.81E-01; Z-score: 1.72E+00 | |
|
Molecule expression in the diseased tissue of patients
Molecule expression in the normal tissue of healthy individuals
|
||
| Disease-specific Molecule Abundances |
|
Click to View the Clearer Original Diagram |
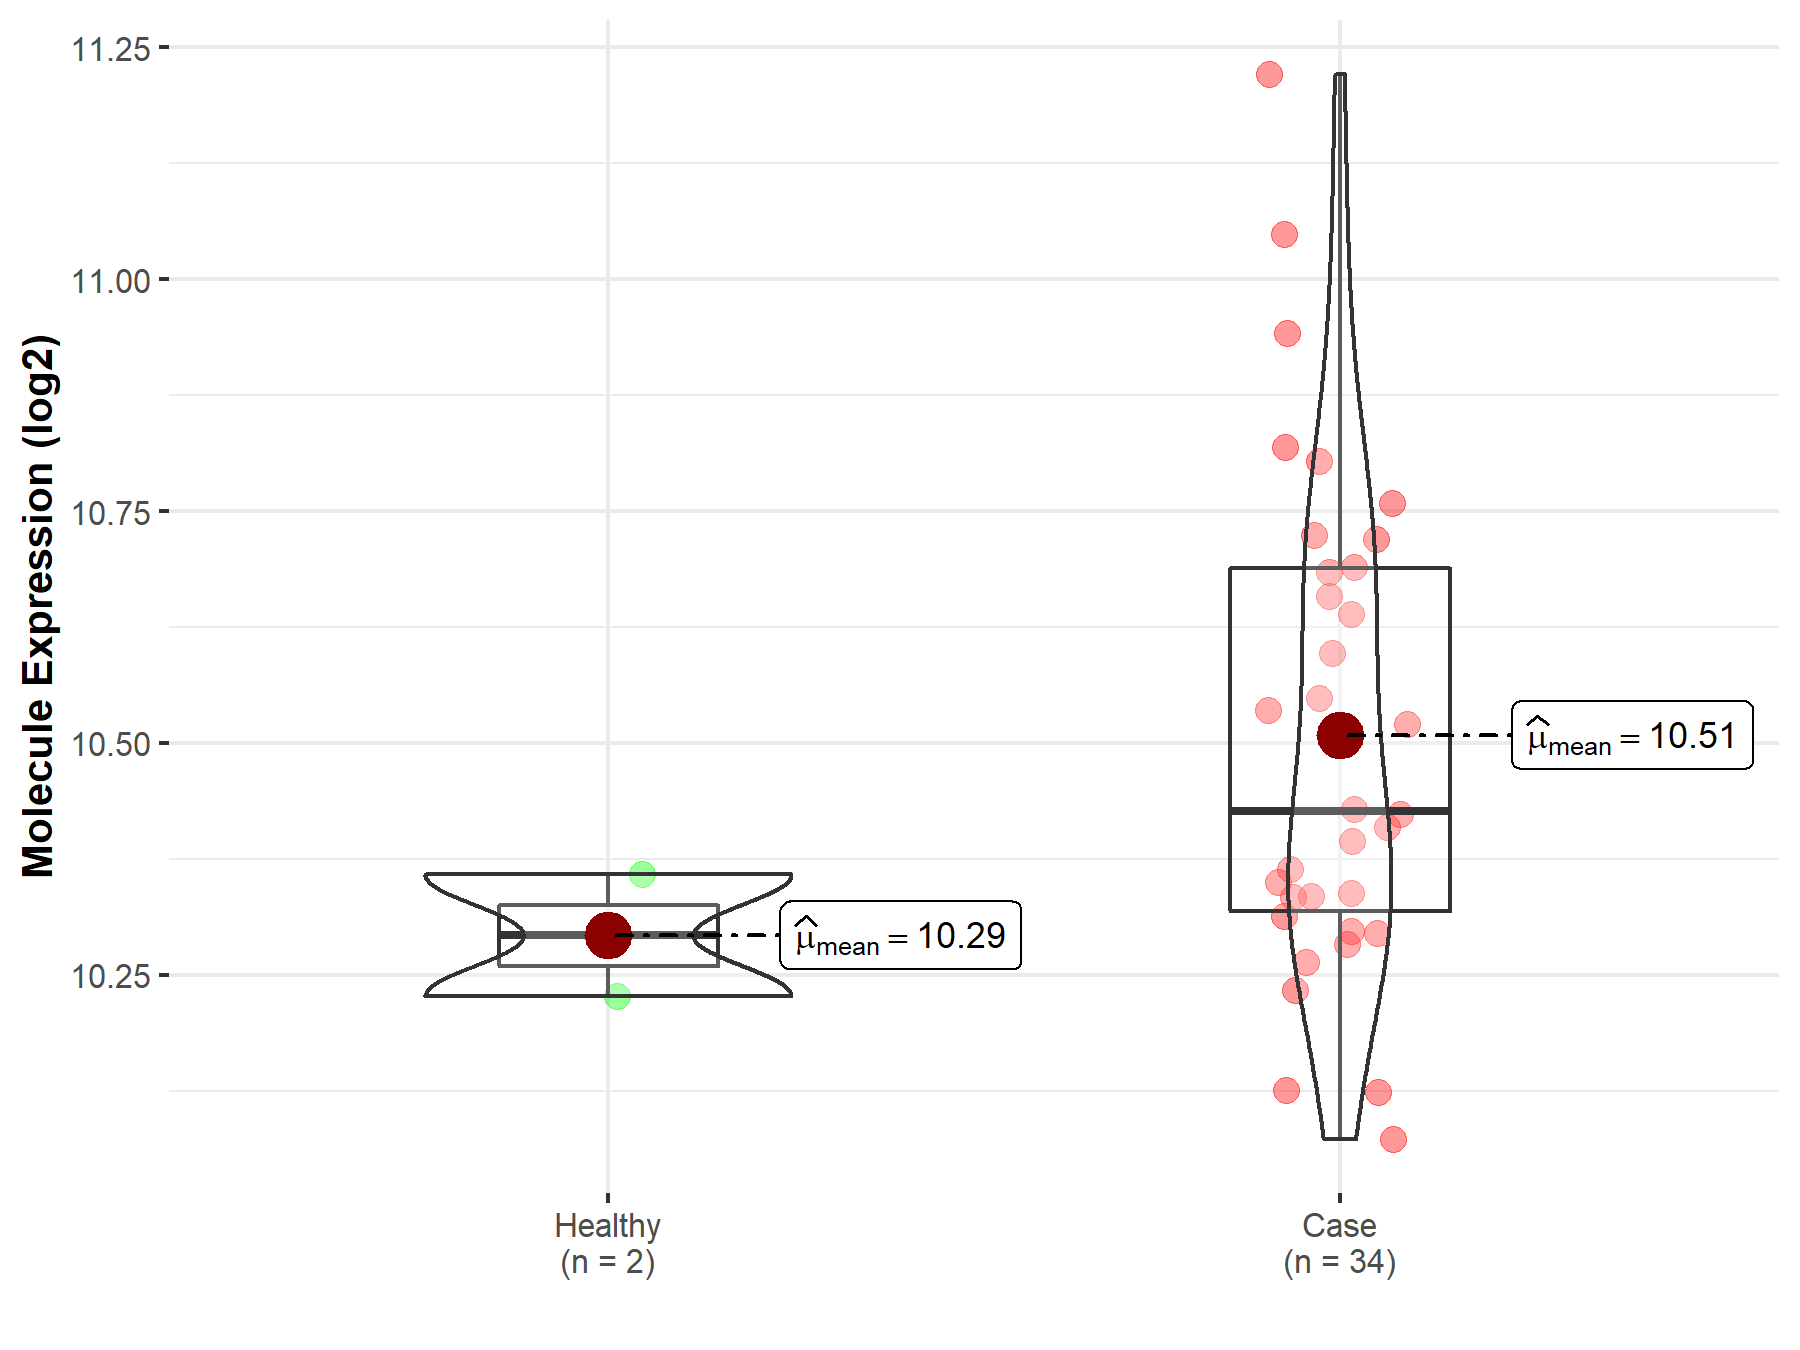
| The Studied Tissue | Brainstem tissue | |
| The Specified Disease | Glioma | |
| The Expression Level of Disease Section Compare with the Healthy Individual Tissue | p-value: 1.03E-01; Fold-change: 1.34E-01; Z-score: 1.44E+00 | |
|
Molecule expression in the diseased tissue of patients
Molecule expression in the normal tissue of healthy individuals
|
||
| Disease-specific Molecule Abundances |
|
Click to View the Clearer Original Diagram |
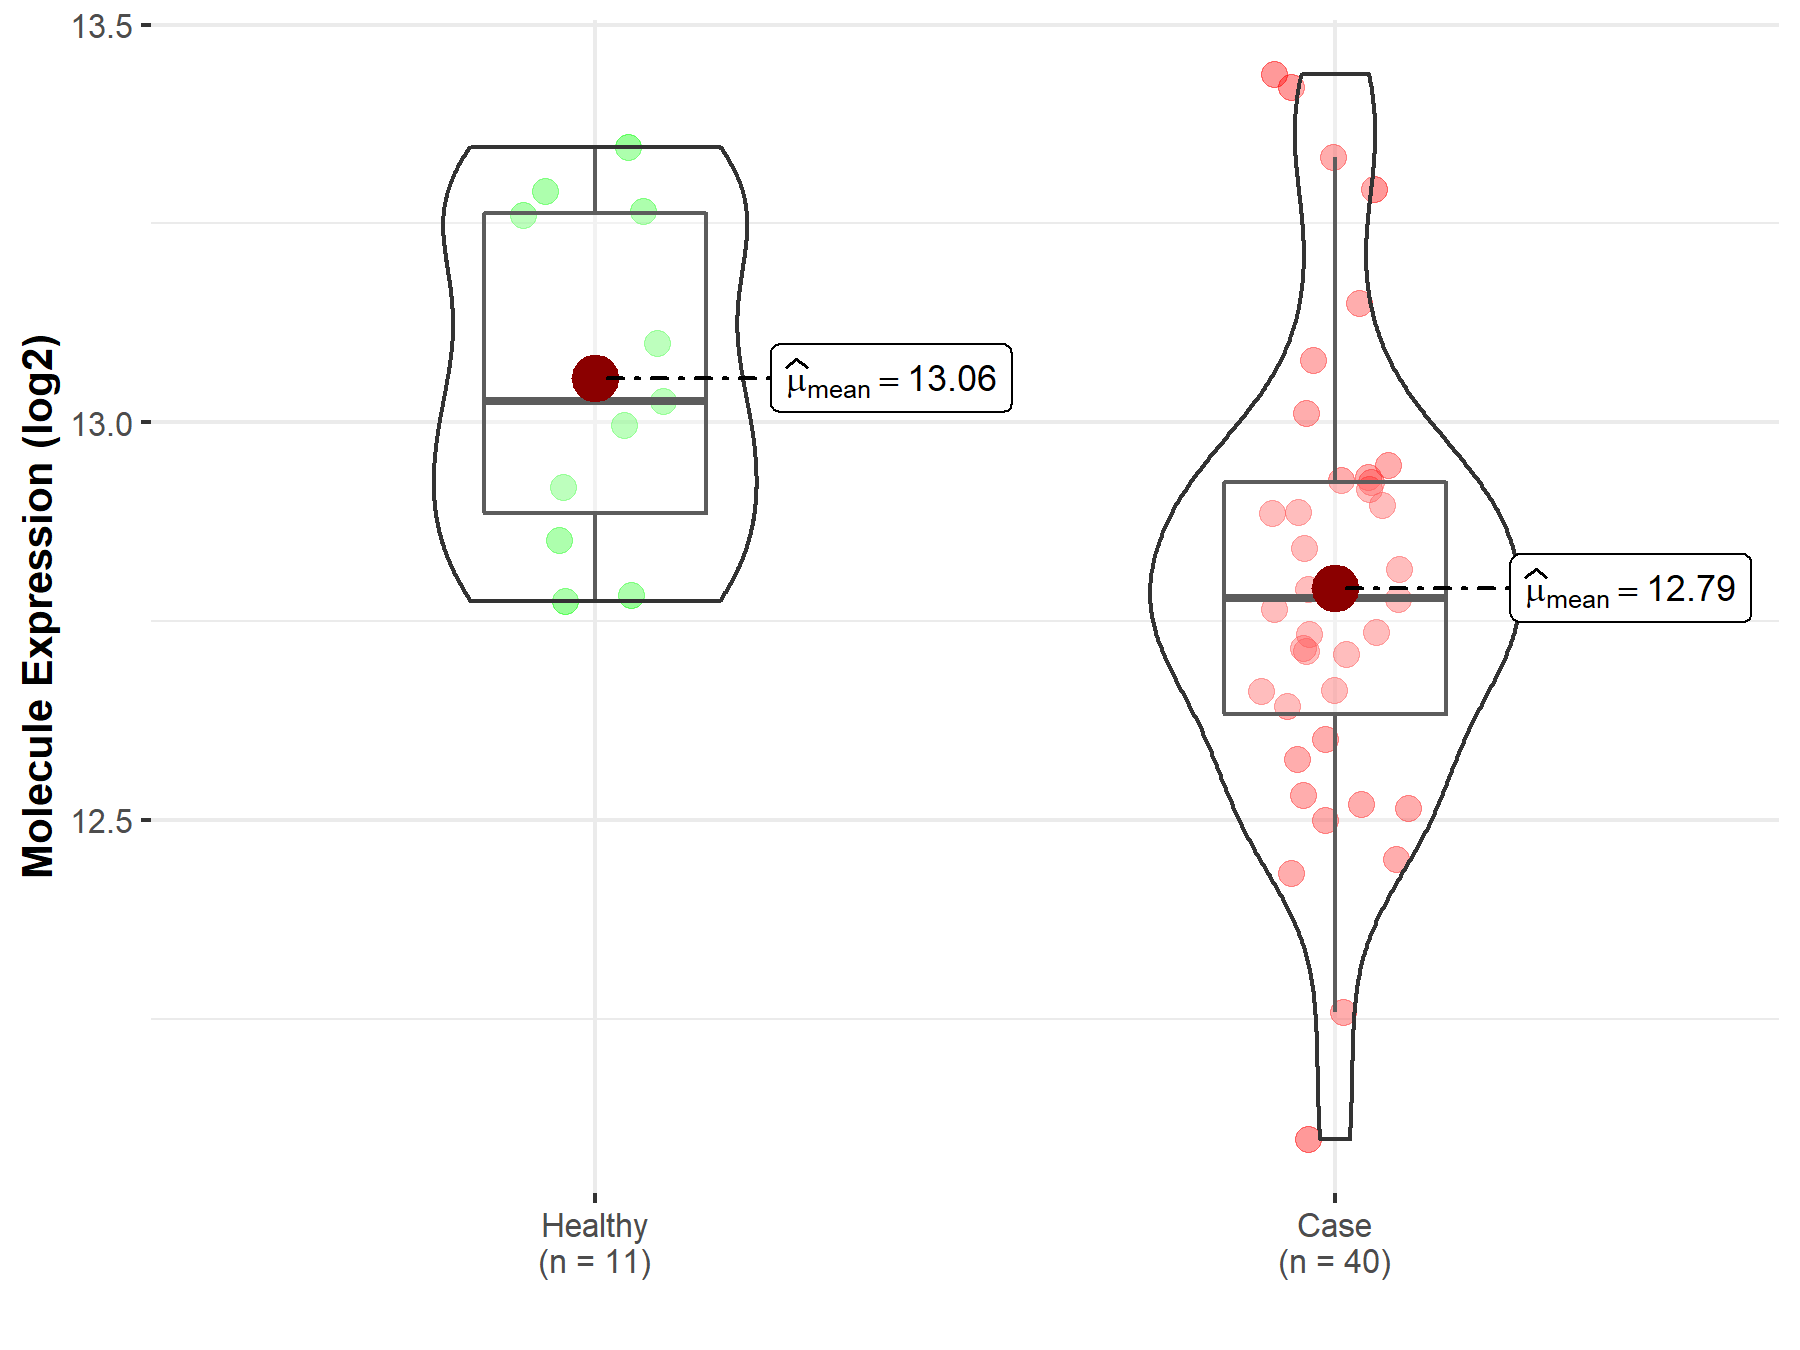
| The Studied Tissue | White matter | |
| The Specified Disease | Glioma | |
| The Expression Level of Disease Section Compare with the Healthy Individual Tissue | p-value: 2.81E-03; Fold-change: -2.48E-01; Z-score: -1.17E+00 | |
|
Molecule expression in the diseased tissue of patients
Molecule expression in the normal tissue of healthy individuals
|
||
| Disease-specific Molecule Abundances |
|
Click to View the Clearer Original Diagram |
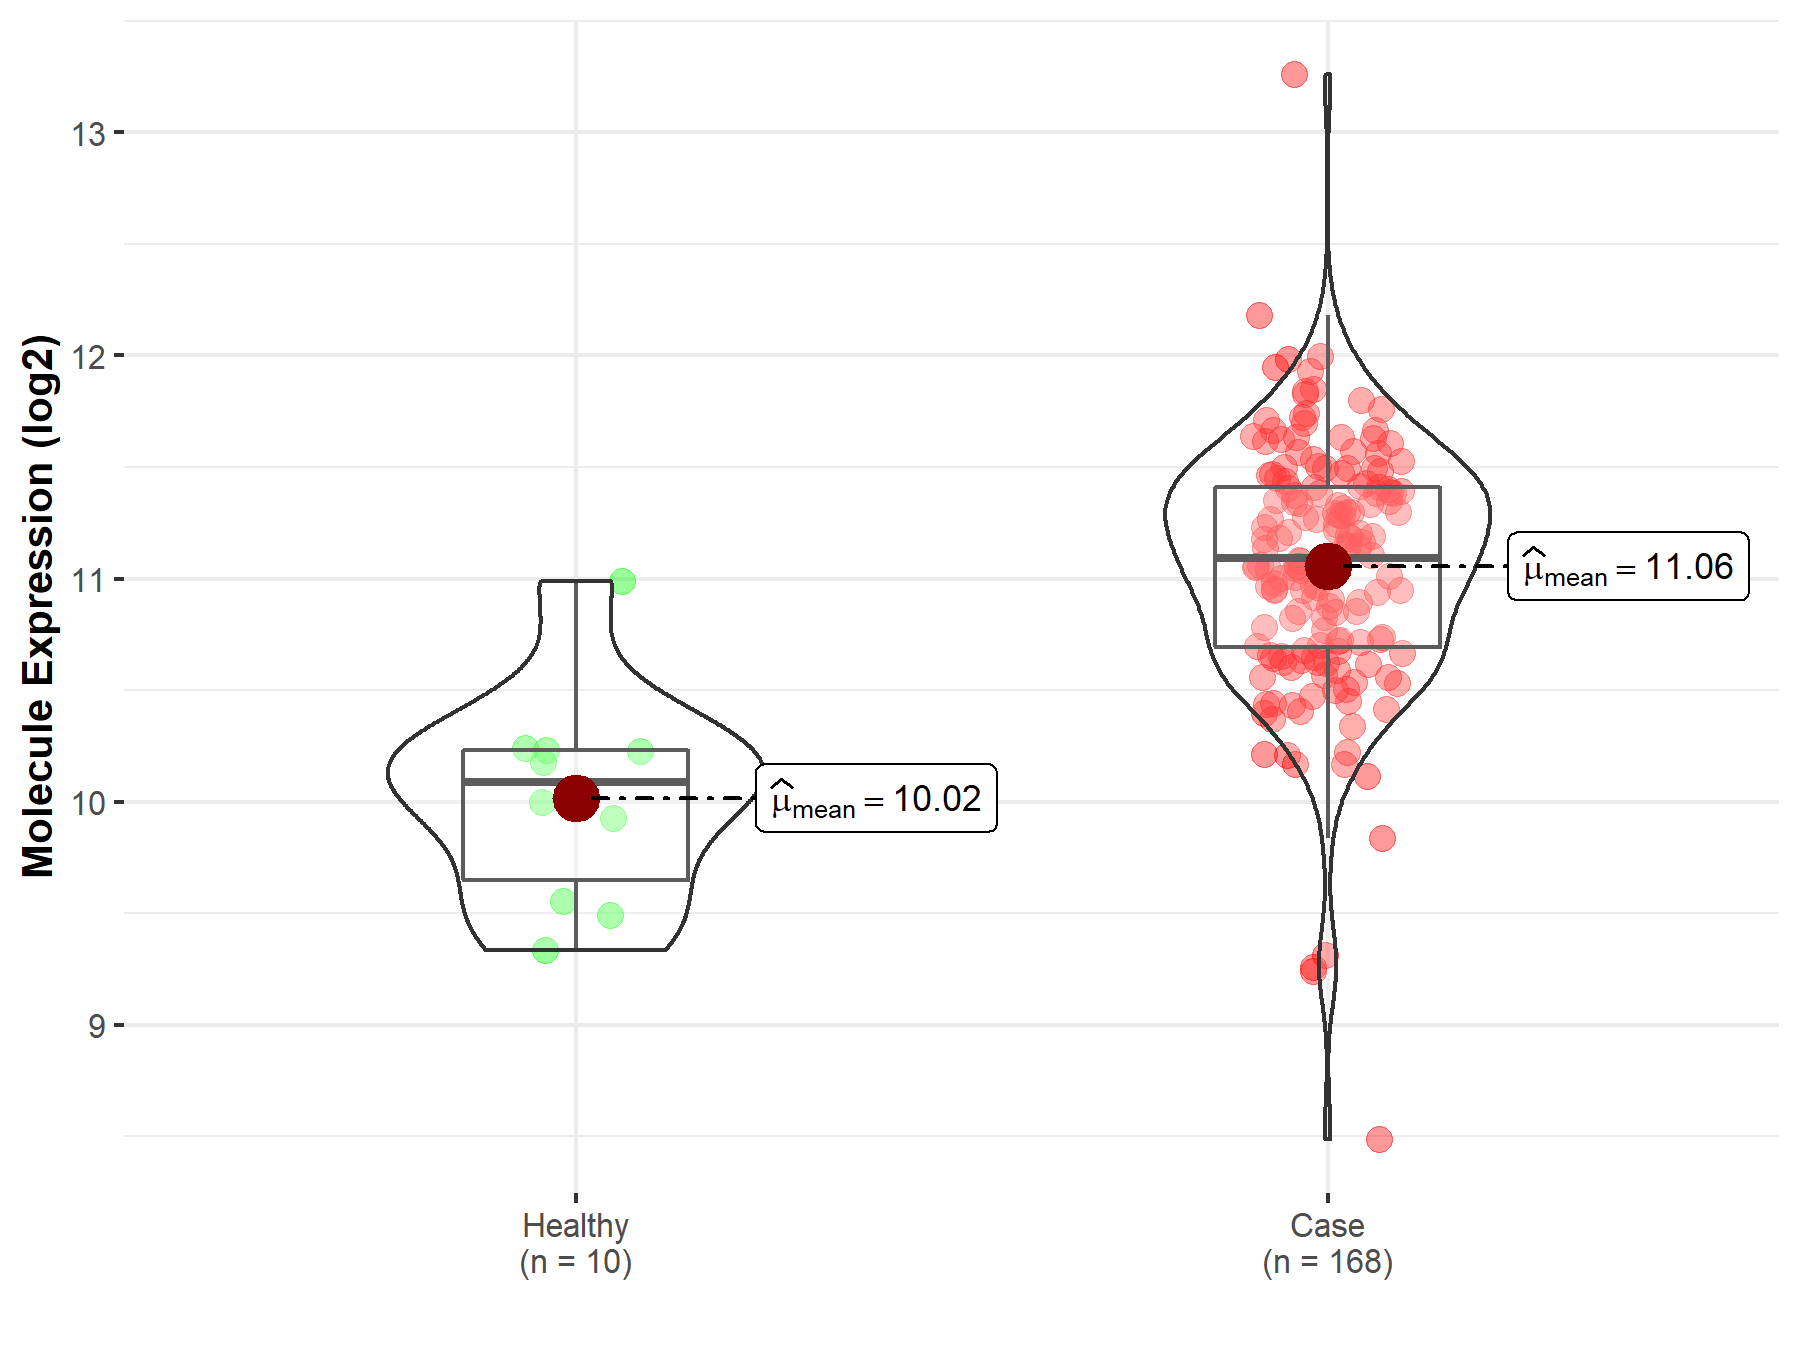
| The Studied Tissue | Brainstem tissue | |
| The Specified Disease | Neuroectodermal tumor | |
| The Expression Level of Disease Section Compare with the Healthy Individual Tissue | p-value: 4.78E-05; Fold-change: 1.01E+00; Z-score: 2.10E+00 | |
|
Molecule expression in the diseased tissue of patients
Molecule expression in the normal tissue of healthy individuals
|
||
| Disease-specific Molecule Abundances |
|
Click to View the Clearer Original Diagram |
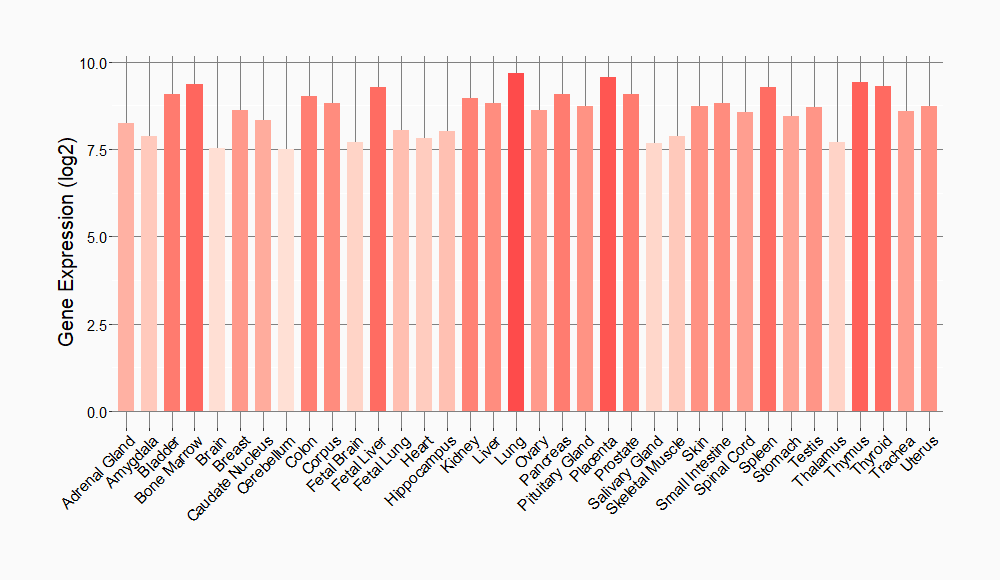
Tissue-specific Molecule Abundances in Healthy Individuals

|
||
References
If you find any error in data or bug in web service, please kindly report it to Dr. Sun and Dr. Yu.
