Molecule Information
General Information of the Molecule (ID: Mol00586)
| Name |
RAF proto-oncogene serine/threonine-protein kinase (RAF1)
,Homo sapiens
|
||||
|---|---|---|---|---|---|
| Synonyms |
Proto-oncogene c-RAF; cRaf; Raf-1; RAF
Click to Show/Hide
|
||||
| Molecule Type |
Protein
|
||||
| Gene Name |
RAF1
|
||||
| Gene ID | |||||
| Location |
chr3:12582101-12664201[-]
|
||||
| Sequence |
MEHIQGAWKTISNGFGFKDAVFDGSSCISPTIVQQFGYQRRASDDGKLTDPSKTSNTIRV
FLPNKQRTVVNVRNGMSLHDCLMKALKVRGLQPECCAVFRLLHEHKGKKARLDWNTDAAS LIGEELQVDFLDHVPLTTHNFARKTFLKLAFCDICQKFLLNGFRCQTCGYKFHEHCSTKV PTMCVDWSNIRQLLLFPNSTIGDSGVPALPSLTMRRMRESVSRMPVSSQHRYSTPHAFTF NTSSPSSEGSLSQRQRSTSTPNVHMVSTTLPVDSRMIEDAIRSHSESASPSALSSSPNNL SPTGWSQPKTPVPAQRERAPVSGTQEKNKIRPRGQRDSSYYWEIEASEVMLSTRIGSGSF GTVYKGKWHGDVAVKILKVVDPTPEQFQAFRNEVAVLRKTRHVNILLFMGYMTKDNLAIV TQWCEGSSLYKHLHVQETKFQMFQLIDIARQTAQGMDYLHAKNIIHRDMKSNNIFLHEGL TVKIGDFGLATVKSRWSGSQQVEQPTGSVLWMAPEVIRMQDNNPFSFQSDVYSYGIVLYE LMTGELPYSHINNRDQIIFMVGRGYASPDLSKLYKNCPKAMKRLVADCVKKVKEERPLFP QILSSIELLQHSLPKINRSASEPSLHRAAHTEDINACTLTTSPRLPVF Click to Show/Hide
|
||||
| 3D-structure |
|
||||
| Function |
Serine/threonine-protein kinase that acts as a regulatory link between the membrane-associated Ras GTPases and the MAPK/ERK cascade, and this critical regulatory link functions as a switch determining cell fate decisions including proliferation, differentiation, apoptosis, survival and oncogenic transformation. RAF1 activation initiates a mitogen-activated protein kinase (MAPK) cascade that comprises a sequential phosphorylation of the dual-specific MAPK kinases (MAP2K1/MEK1 and MAP2K2/MEK2) and the extracellular signal-regulated kinases (MAPK3/ERK1 and MAPK1/ERK2). The phosphorylated form of RAF1 (on residues Ser-338 and Ser-339, by PAK1) phosphorylates BAD/Bcl2-antagonist of cell death at 'Ser-75'. Phosphorylates adenylyl cyclases: ADCY2, ADCY5 and ADCY6, resulting in their activation. Phosphorylates PPP1R12A resulting in inhibition of the phosphatase activity. Phosphorylates TNNT2/cardiac muscle troponin T. Can promote NF-kB activation and inhibit signal transducers involved in motility (ROCK2), apoptosis (MAP3K5/ASK1 and STK3/MST2), proliferation and angiogenesis (RB1). Can protect cells from apoptosis also by translocating to the mitochondria where it binds BCL2 and displaces BAD/Bcl2-antagonist of cell death. Regulates Rho signaling and migration, and is required for normal wound healing. Plays a role in the oncogenic transformation of epithelial cells via repression of the TJ protein, occludin (OCLN) by inducing the up-regulation of a transcriptional repressor SNAI2/SLUG, which induces down-regulation of OCLN. Restricts caspase activation in response to selected stimuli, notably Fas stimulation, pathogen-mediated macrophage apoptosis, and erythroid differentiation.
Click to Show/Hide
|
||||
| Uniprot ID | |||||
| Ensembl ID | |||||
| HGNC ID | |||||
| Click to Show/Hide the Complete Species Lineage | |||||
Type(s) of Resistant Mechanism of This Molecule
Drug Resistance Data Categorized by Drug
Approved Drug(s)
4 drug(s) in total
| Drug Sensitivity Data Categorized by Their Corresponding Mechanisms | ||||
|
|
||||
| Disease Class: Melanoma [ICD-11: 2C30.0] | [1] | |||
| Sensitive Disease | Melanoma [ICD-11: 2C30.0] | |||
| Sensitive Drug | Vemurafenib | |||
| Molecule Alteration | Expression | Down-regulation |
||
| Differential expression of the molecule in resistant disease | ||||
| Classification of Disease | Melanoma [ICD-11: 2C30] | |||
| The Specified Disease | Melanoma | |||
| The Studied Tissue | Skin | |||
| The Expression Level of Disease Section Compare with the Healthy Individual Tissue | p-value: 4.47E-01 Fold-change: -1.48E-02 Z-score: -7.72E-01 |
|||
| Experimental Note | Revealed Based on the Cell Line Data | |||
| Cell Pathway Regulation | Cell proliferation | Inhibition | hsa05200 | |
| MAPK/PI3K/AKT signaling pathway | Inhibition | hsa05235 | ||
| In Vitro Model | A375 cells | Skin | Homo sapiens (Human) | CVCL_0132 |
| Mel-CV cells | Skin | Homo sapiens (Human) | CVCL_S996 | |
| Experiment for Molecule Alteration |
Immunohistochemical staining assay; Western blot analysis | |||
| Experiment for Drug Resistance |
CCK8 assay | |||
| Mechanism Description | miR-7 expression was decreased in both VemR A375 and Mel-CVR melanoma cells and its low expression contributed to BRAFi resistance. Furthermore, by decreasing the expression levels of EGFR, IGF-1R and CRAF, miR-7 could inhibit the activation of RAS/RAF/MEk/ERk (MAPk) and PI3k/AkT pathway and partially reverse the resistance to BRAFi in VemR A375 melanoma cells. | |||
| Drug Sensitivity Data Categorized by Their Corresponding Mechanisms | ||||
|
|
||||
| Disease Class: Colorectal cancer [ICD-11: 2B91.1] | [2] | |||
| Sensitive Disease | Colorectal cancer [ICD-11: 2B91.1] | |||
| Sensitive Drug | Cetuximab | |||
| Molecule Alteration | Expression | Up-regulation |
||
| Experimental Note | Identified from the Human Clinical Data | |||
| Cell Pathway Regulation | Cell proliferation | Inhibition | hsa05200 | |
| In Vitro Model | SW480 cells | Colon | Homo sapiens (Human) | CVCL_0546 |
| HCT116 cells | Colon | Homo sapiens (Human) | CVCL_0291 | |
| Experiment for Molecule Alteration |
Western blot analysis | |||
| Experiment for Drug Resistance |
CCK8 assay | |||
| Mechanism Description | microRNA-7 expression in colorectal cancer is associated with poor prognosis and regulates cetuximab sensitivity via EGFR regulation. | |||
| Drug Sensitivity Data Categorized by Their Corresponding Mechanisms | ||||
|
|
||||
| Disease Class: Breast cancer [ICD-11: 2C60.3] | [3] | |||
| Sensitive Disease | Breast cancer [ICD-11: 2C60.3] | |||
| Sensitive Drug | Doxorubicin | |||
| Molecule Alteration | Expression | Down-regulation |
||
| Experimental Note | Identified from the Human Clinical Data | |||
| Cell Pathway Regulation | Cell apoptosis | Activation | hsa04210 | |
| Cell viability | Inhibition | hsa05200 | ||
| PI3K/PTEN/AKT signaling pathway | Regulation | N.A. | ||
| RAS/RAF/MEK/ERK signaling pathway | Regulation | N.A. | ||
| In Vitro Model | MCF-7 cells | Breast | Homo sapiens (Human) | CVCL_0031 |
| HBL-100 cells | Breast | Homo sapiens (Human) | CVCL_4362 | |
| Experiment for Molecule Alteration |
Western blot analysis | |||
| Experiment for Drug Resistance |
MTT assay | |||
| Mechanism Description | Induction of miR-195 expression promoted tumor cell apoptosis and inhibited breast cancer cell viability, but induced the sensitivity of breast cancer cells to Adriamycin treatment and was associated with inhibition of Raf-1 expression in breast cancer cells. | |||
| Drug Sensitivity Data Categorized by Their Corresponding Mechanisms | ||||
|
|
||||
| Disease Class: Liver cancer [ICD-11: 2C12.6] | [4] | |||
| Sensitive Disease | Liver cancer [ICD-11: 2C12.6] | |||
| Sensitive Drug | Sorafenib | |||
| Molecule Alteration | Expression | Down-regulation |
||
| Experimental Note | Identified from the Human Clinical Data | |||
| Cell Pathway Regulation | Cell apoptosis | Activation | hsa04210 | |
| Cell invasion | Inhibition | hsa05200 | ||
| Cell proliferation | Inhibition | hsa05200 | ||
| MAPK signaling pathway | Inhibition | hsa04010 | ||
| In Vitro Model | HepG2 cells | Liver | Homo sapiens (Human) | CVCL_0027 |
| SMMC7721 cells | Uterus | Homo sapiens (Human) | CVCL_0534 | |
| Experiment for Molecule Alteration |
Western blot analysis; Luciferase reporter assay | |||
| Experiment for Drug Resistance |
MTT assay | |||
| Mechanism Description | miR 378a enhances the sensitivity of liver cancer to sorafenib by targeting VEGFR, PDGFRbeta and c Raf. Sorafenib can suppress tumor growth through the inhibition of multiple tyrosine kinases, including VEGFR, PDGFRbeta and c-Raf. | |||
Disease- and Tissue-specific Abundances of This Molecule
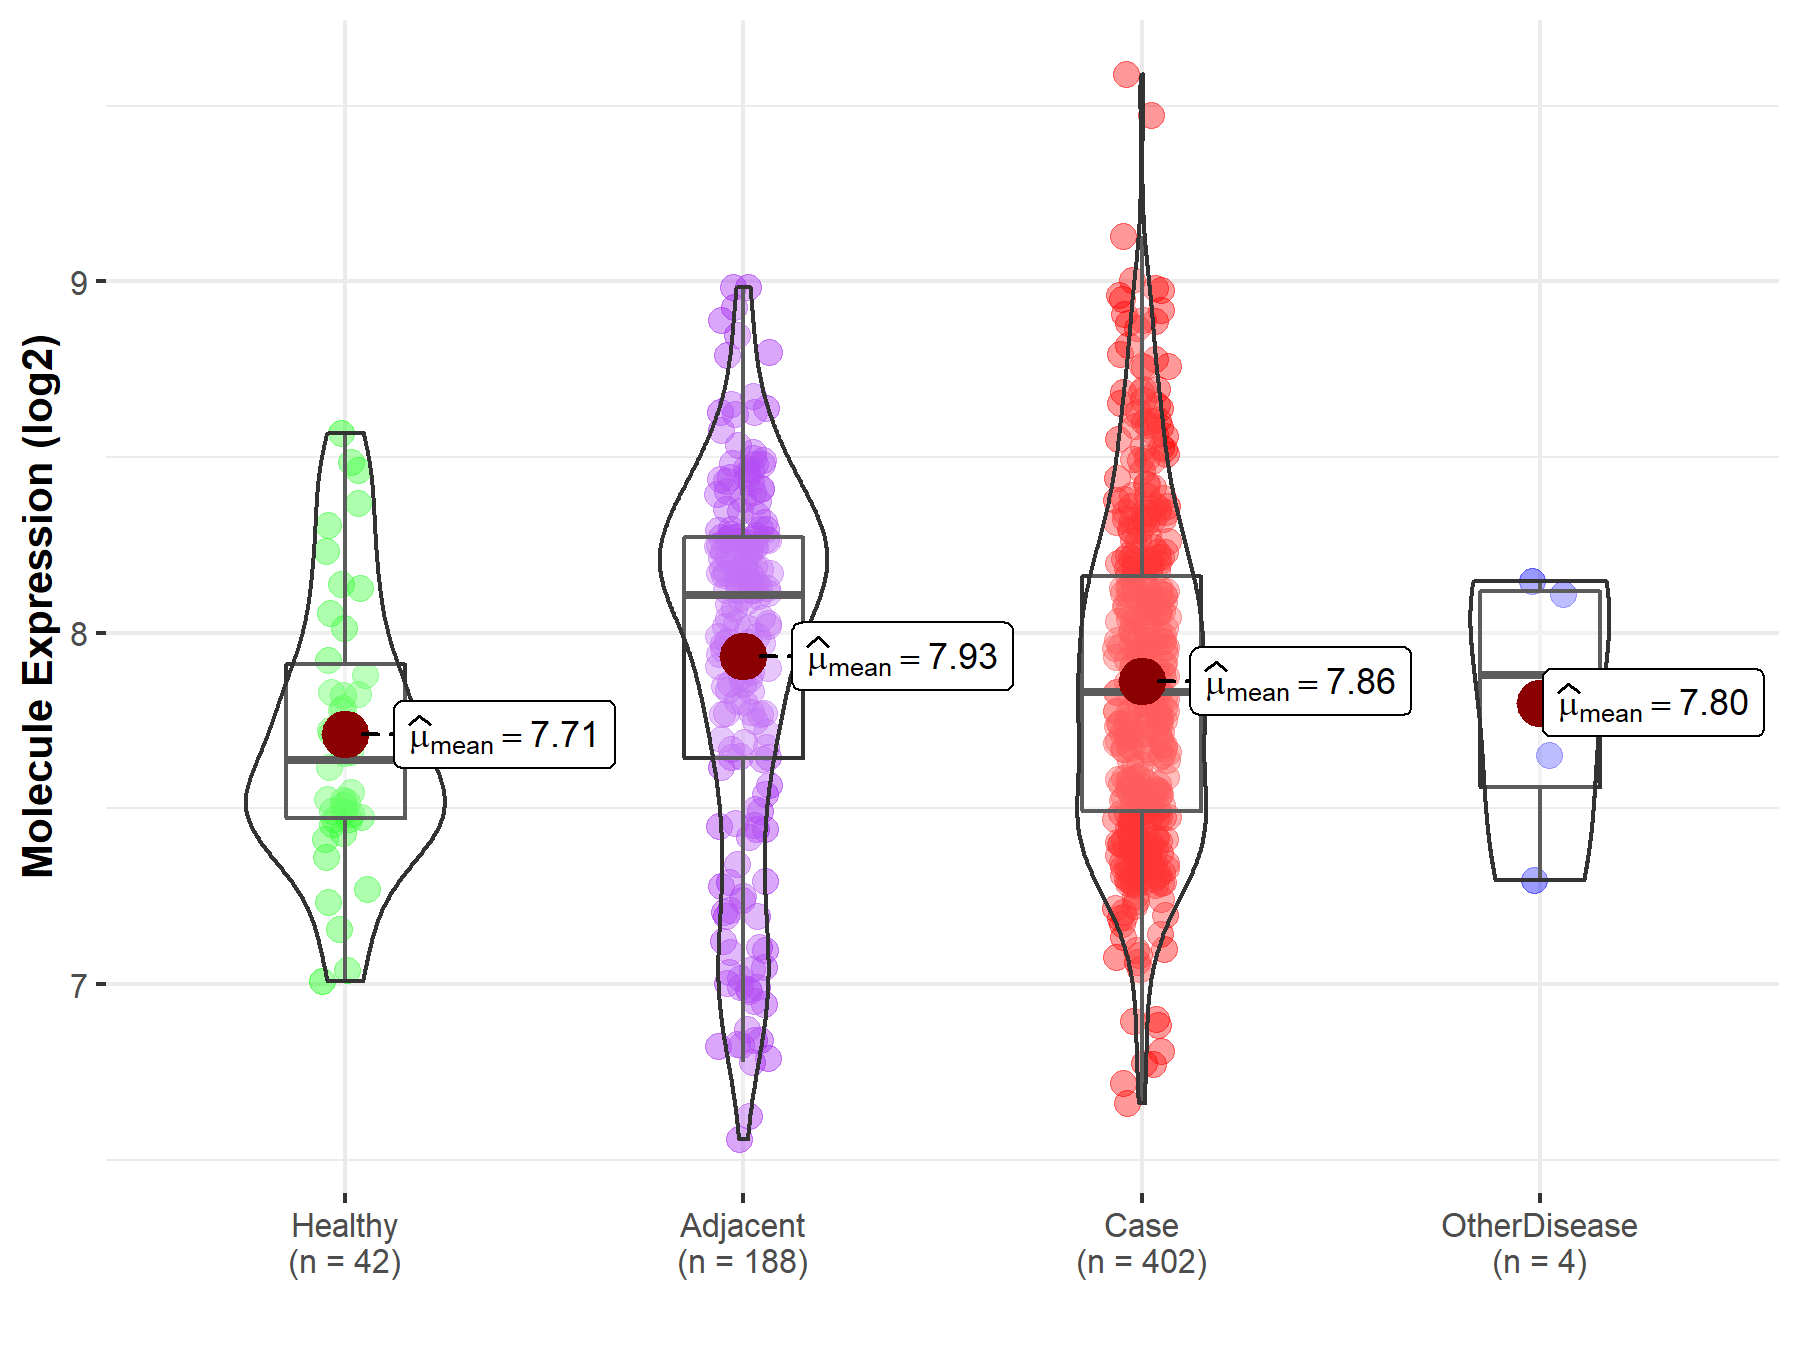
ICD Disease Classification 02

| Differential expression of molecule in resistant diseases | ||
| The Studied Tissue | Liver | |
| The Specified Disease | Liver cancer | |
| The Expression Level of Disease Section Compare with the Healthy Individual Tissue | p-value: 2.20E-02; Fold-change: 1.92E-01; Z-score: 4.95E-01 | |
| The Expression Level of Disease Section Compare with the Adjacent Tissue | p-value: 1.29E-01; Fold-change: -2.77E-01; Z-score: -5.14E-01 | |
| The Expression Level of Disease Section Compare with the Other Disease Section | p-value: 7.81E-01; Fold-change: -5.02E-02; Z-score: -1.24E-01 | |
|
Molecule expression in the normal tissue adjacent to the diseased tissue of patients
Molecule expression in the diseased tissue of patients
Molecule expression in the normal tissue of healthy individuals
Molecule expression in tissue other than the diseased tissue of patients
|
||
| Disease-specific Molecule Abundances |

|
Click to View the Clearer Original Diagram |
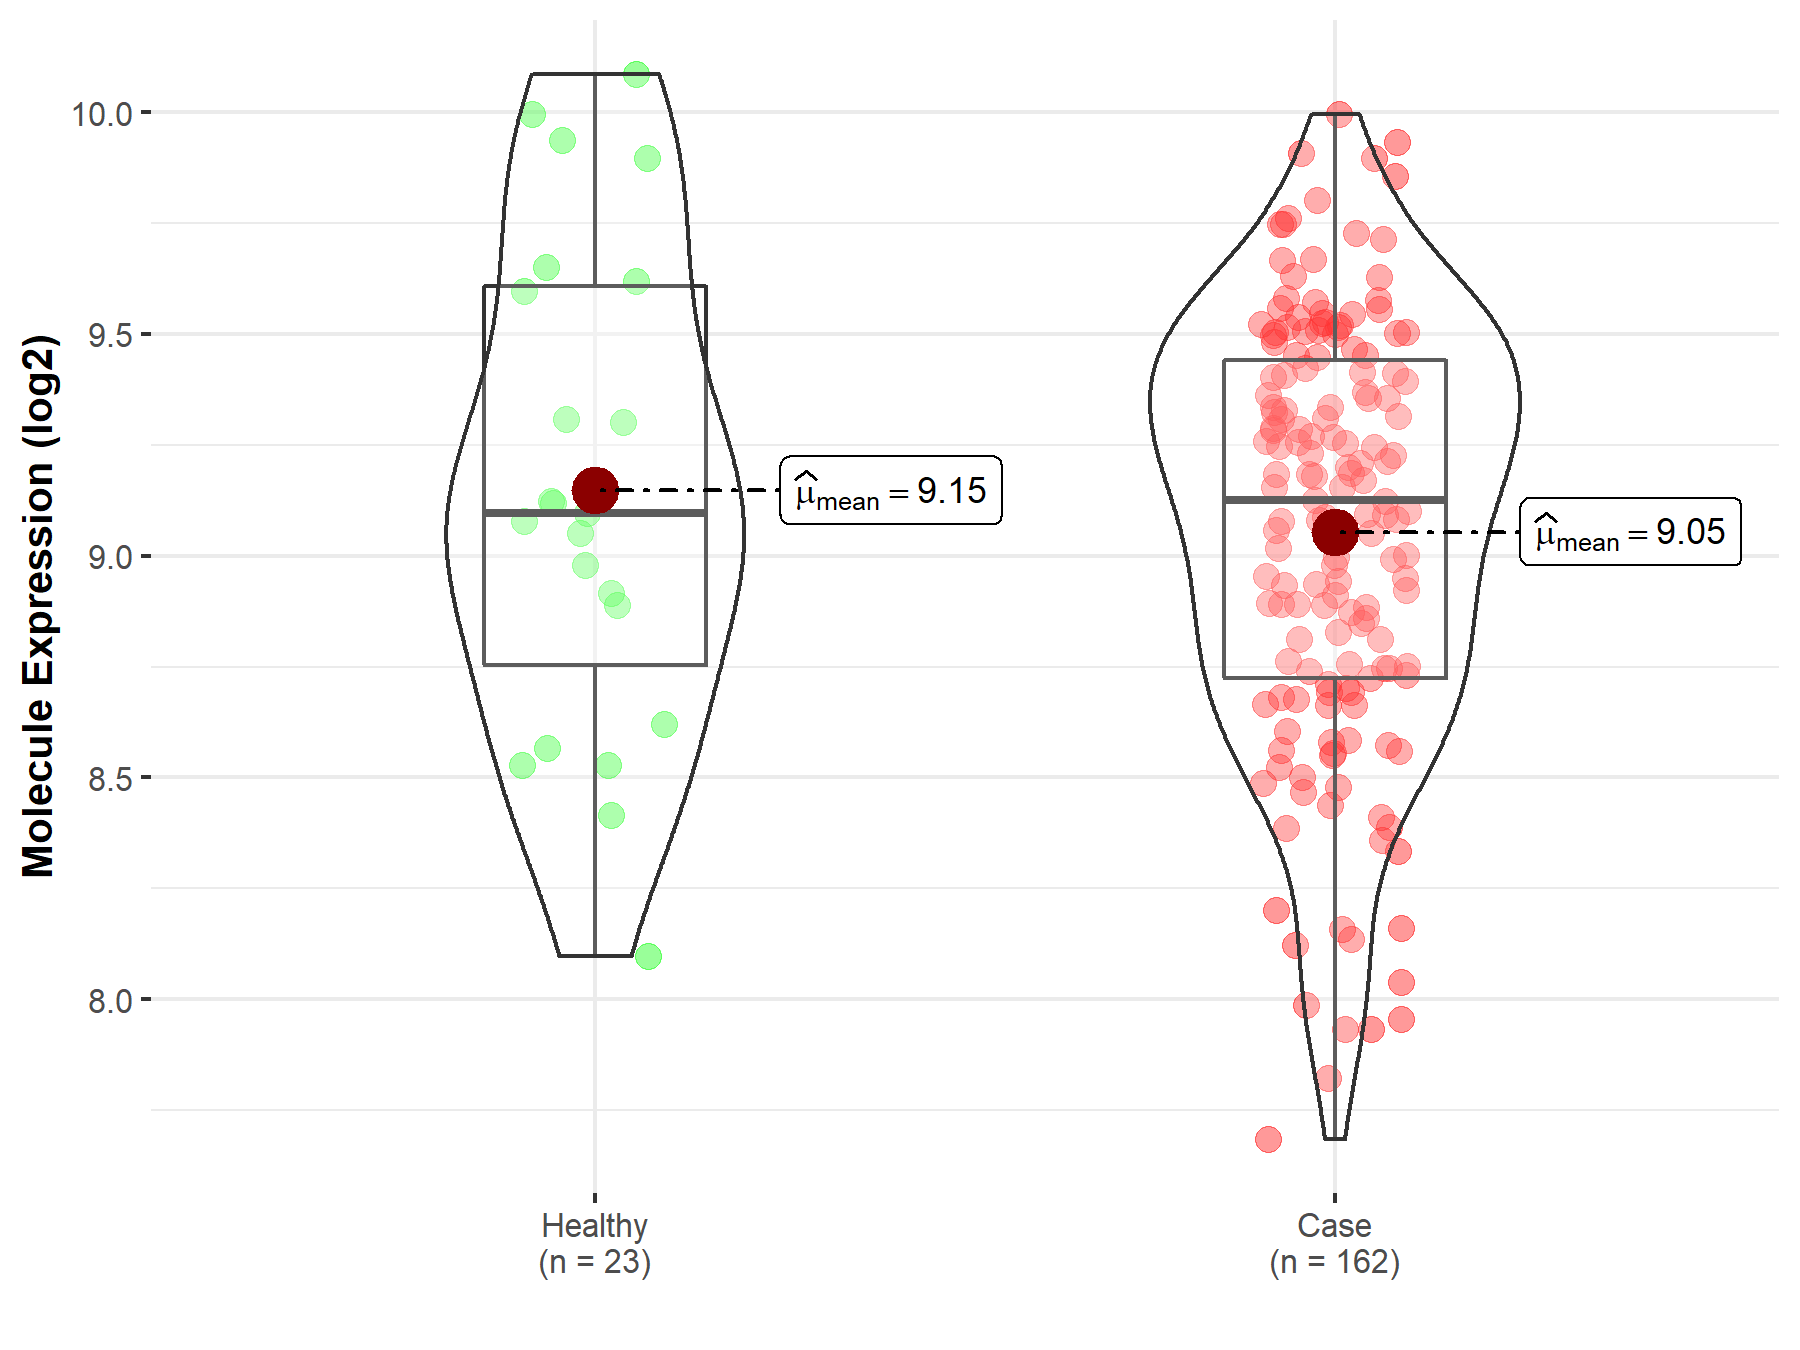
| Differential expression of molecule in resistant diseases | ||
| The Studied Tissue | Skin | |
| The Specified Disease | Melanoma | |
| The Expression Level of Disease Section Compare with the Healthy Individual Tissue | p-value: 4.47E-01; Fold-change: 2.85E-02; Z-score: 5.16E-02 | |
|
Molecule expression in the diseased tissue of patients
Molecule expression in the normal tissue of healthy individuals
|
||
| Disease-specific Molecule Abundances |

|
Click to View the Clearer Original Diagram |
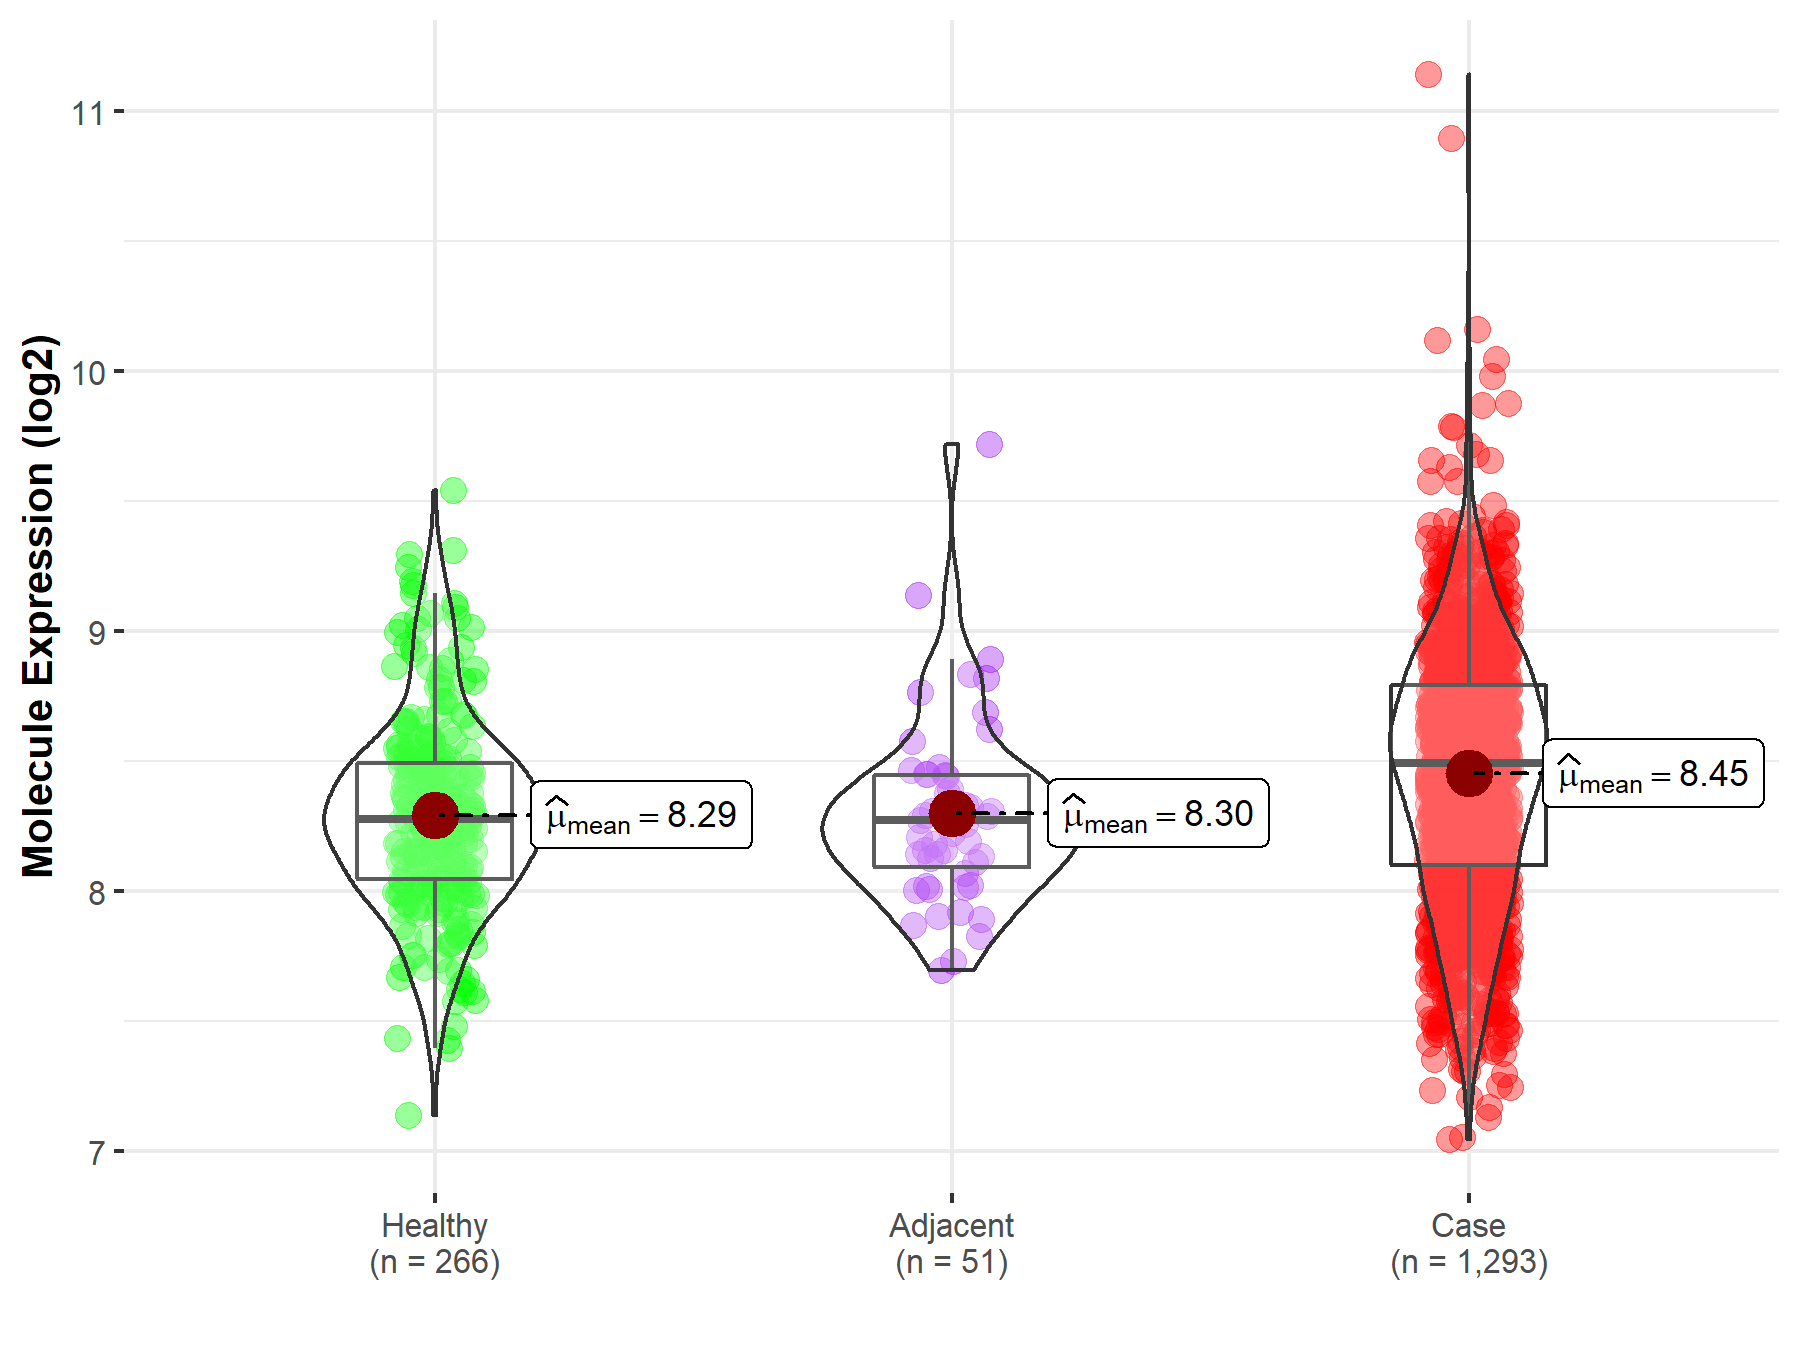
| Differential expression of molecule in resistant diseases | ||
| The Studied Tissue | Breast tissue | |
| The Specified Disease | Breast cancer | |
| The Expression Level of Disease Section Compare with the Healthy Individual Tissue | p-value: 7.45E-09; Fold-change: 2.13E-01; Z-score: 5.59E-01 | |
| The Expression Level of Disease Section Compare with the Adjacent Tissue | p-value: 5.29E-03; Fold-change: 2.19E-01; Z-score: 6.04E-01 | |
|
Molecule expression in the normal tissue adjacent to the diseased tissue of patients
Molecule expression in the diseased tissue of patients
Molecule expression in the normal tissue of healthy individuals
|
||
| Disease-specific Molecule Abundances |

|
Click to View the Clearer Original Diagram |
Tissue-specific Molecule Abundances in Healthy Individuals


|
||
References
If you find any error in data or bug in web service, please kindly report it to Dr. Sun and Dr. Yu.
