Molecule Information
General Information of the Molecule (ID: Mol00575)
| Name |
Protein-tyrosine phosphatase 1B (PTPN1)
,Homo sapiens
|
||||
|---|---|---|---|---|---|
| Synonyms |
Protein-tyrosine phosphatase 1B; PTP-1B; PTP1B
Click to Show/Hide
|
||||
| Molecule Type |
Protein
|
||||
| Gene Name |
PTPN1
|
||||
| Gene ID | |||||
| Location |
chr20:50510321-50585241[+]
|
||||
| Sequence |
MEMEKEFEQIDKSGSWAAIYQDIRHEASDFPCRVAKLPKNKNRNRYRDVSPFDHSRIKLH
QEDNDYINASLIKMEEAQRSYILTQGPLPNTCGHFWEMVWEQKSRGVVMLNRVMEKGSLK CAQYWPQKEEKEMIFEDTNLKLTLISEDIKSYYTVRQLELENLTTQETREILHFHYTTWP DFGVPESPASFLNFLFKVRESGSLSPEHGPVVVHCSAGIGRSGTFCLADTCLLLMDKRKD PSSVDIKKVLLEMRKFRMGLIQTADQLRFSYLAVIEGAKFIMGDSSVQDQWKELSHEDLE PPPEHIPPPPRPPKRILEPHNGKCREFFPNHQWVKEETQEDKDCPIKEEKGSPLNAAPYG IESMSQDTEVRSRVVGGSLRGAQAASPAKGEPSLPEKDEDHALSYWKPFLVNMCVATVLT AGAYLCYRFLFNSNT Click to Show/Hide
|
||||
| 3D-structure |
|
||||
| Function |
Tyrosine-protein phosphatase which acts as a regulator of endoplasmic reticulum unfolded protein response. Mediates dephosphorylation of EIF2AK3/PERK; inactivating the protein kinase activity of EIF2AK3/PERK. May play an important role in CKII- and p60c-src-induced signal transduction cascades. May regulate the EFNA5-EPHA3 signaling pathway which modulates cell reorganization and cell-cell repulsion. May also regulate the hepatocyte growth factor receptor signaling pathway through dephosphorylation of MET.
Click to Show/Hide
|
||||
| Uniprot ID | |||||
| Ensembl ID | |||||
| HGNC ID | |||||
| Click to Show/Hide the Complete Species Lineage | |||||
Type(s) of Resistant Mechanism of This Molecule
Drug Resistance Data Categorized by Drug
Approved Drug(s)
1 drug(s) in total
| Drug Resistance Data Categorized by Their Corresponding Mechanisms | ||||
|
|
||||
| Disease Class: Hepatocellular carcinoma [ICD-11: 2C12.2] | [1] | |||
| Resistant Disease | Hepatocellular carcinoma [ICD-11: 2C12.2] | |||
| Resistant Drug | Doxorubicin | |||
| Molecule Alteration | Expression | Down-regulation |
||
| Differential expression of the molecule in resistant disease | ||||
| Classification of Disease | Liver cancer [ICD-11: 2C12] | |||
| The Specified Disease | Liver cancer | |||
| The Studied Tissue | Liver tissue | |||
| The Expression Level of Disease Section Compare with the Healthy Individual Tissue | p-value: 7.82E-08 Fold-change: -4.84E-02 Z-score: -6.18E+00 |
|||
| Experimental Note | Revealed Based on the Cell Line Data | |||
| Cell Pathway Regulation | STAT3 signaling pathway | Activation | hsa04550 | |
| In Vitro Model | Huh-7 cells | Liver | Homo sapiens (Human) | CVCL_0336 |
| HepG2 cells | Liver | Homo sapiens (Human) | CVCL_0027 | |
| Hep3B cells | Liver | Homo sapiens (Human) | CVCL_0326 | |
| QGY-7703 cells | Liver | Homo sapiens (Human) | CVCL_6715 | |
| SMMC7721 cells | Uterus | Homo sapiens (Human) | CVCL_0534 | |
| 97H cells | Liver | Homo sapiens (Human) | N.A. | |
| PLC cells | Liver | Homo sapiens (Human) | CVCL_0485 | |
| Experiment for Molecule Alteration |
Western blot analysis; Luciferase reporter assay | |||
| Experiment for Drug Resistance |
Flow cytometric analysis; Spheroid formation assay | |||
| Mechanism Description | miR589-5p promotes the cancer stem cell characteristics and chemoresistance via targeting multiple negative regulators of STAT3 signaling pathway, including SOCS2, SOCS5, PTPN1 and PTPN11, leading to constitutive activation of STAT3 signaling. | |||
Disease- and Tissue-specific Abundances of This Molecule
ICD Disease Classification 02

| Differential expression of molecule in resistant diseases | ||
| The Studied Tissue | Liver | |
| The Specified Disease | Liver cancer | |
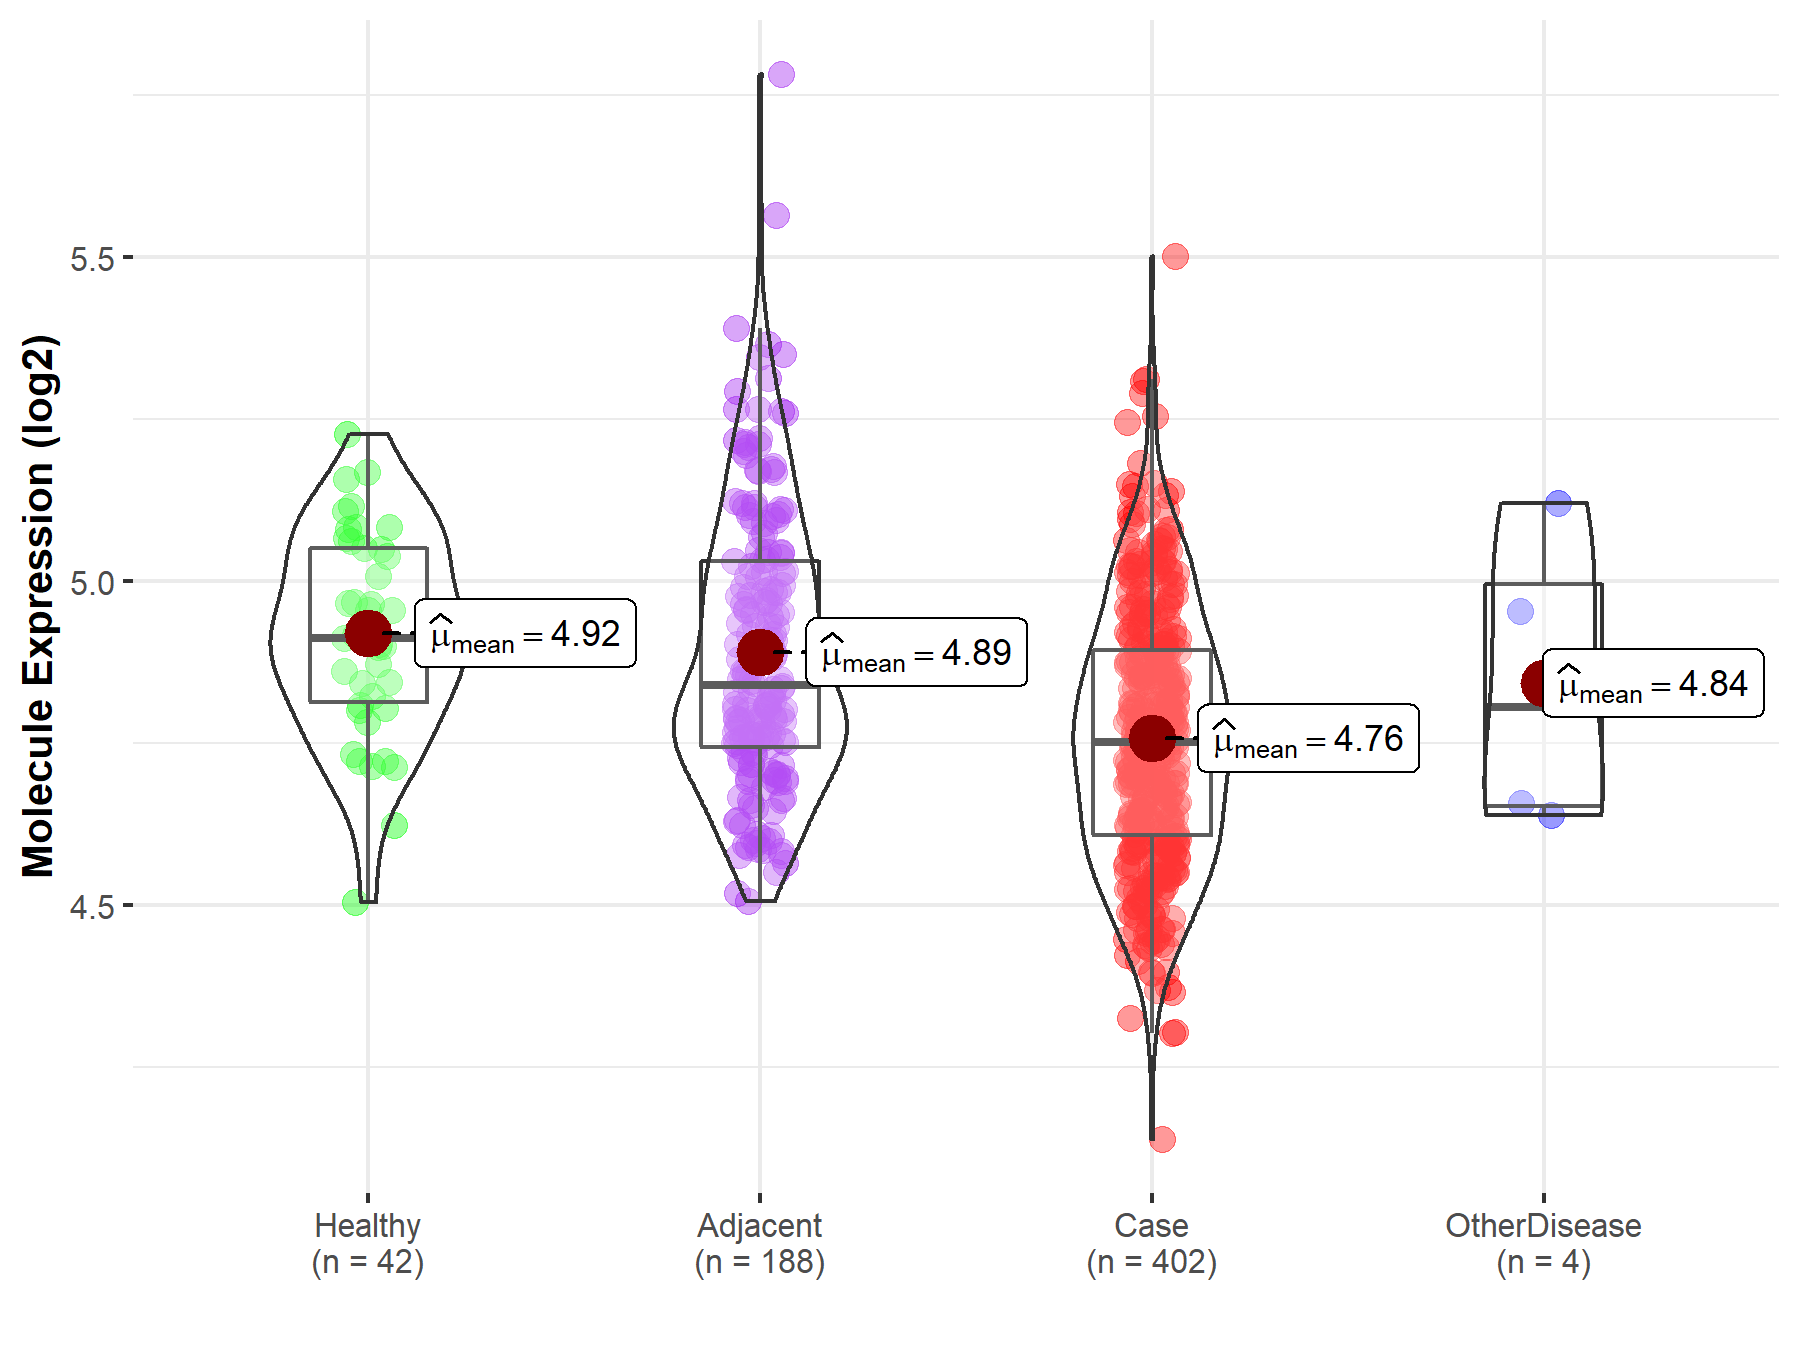
| The Expression Level of Disease Section Compare with the Healthy Individual Tissue | p-value: 7.82E-08; Fold-change: -1.60E-01; Z-score: -1.02E+00 | |
| The Expression Level of Disease Section Compare with the Adjacent Tissue | p-value: 7.16E-12; Fold-change: -8.77E-02; Z-score: -4.05E-01 | |
| The Expression Level of Disease Section Compare with the Other Disease Section | p-value: 5.20E-01; Fold-change: -5.40E-02; Z-score: -2.30E-01 | |
|
Molecule expression in the normal tissue adjacent to the diseased tissue of patients
Molecule expression in the diseased tissue of patients
Molecule expression in the normal tissue of healthy individuals
Molecule expression in tissue other than the diseased tissue of patients
|
||
| Disease-specific Molecule Abundances |

|
Click to View the Clearer Original Diagram |
Tissue-specific Molecule Abundances in Healthy Individuals


|
||
References
If you find any error in data or bug in web service, please kindly report it to Dr. Sun and Dr. Yu.
