Molecule Information
General Information of the Molecule (ID: Mol00560)
| Name |
E3 SUMO-protein ligase PIAS3 (PIAS3)
,Homo sapiens
|
||||
|---|---|---|---|---|---|
| Synonyms |
E3 SUMO-protein transferase PIAS3; Protein inhibitor of activated STAT protein 3
Click to Show/Hide
|
||||
| Molecule Type |
Protein
|
||||
| Gene Name |
PIAS3
|
||||
| Gene ID | |||||
| Location |
chr1:145848522-145859836[-]
|
||||
| Sequence |
MAELGELKHMVMSFRVSELQVLLGFAGRNKSGRKHELLAKALHLLKSSCAPSVQMKIKEL
YRRRFPRKTLGPSDLSLLSLPPGTSPVGSPGPLAPIPPTLLAPGTLLGPKREVDMHPPLP QPVHPDVTMKPLPFYEVYGELIRPTTLASTSSQRFEEAHFTFALTPQQVQQILTSREVLP GAKCDYTIQVQLRFCLCETSCPQEDYFPPNLFVKVNGKLCPLPGYLPPTKNGAEPKRPSR PINITPLARLSATVPNTIVVNWSSEFGRNYSLSVYLVRQLTAGTLLQKLRAKGIRNPDHS RALIKEKLTADPDSEVATTSLRVSLMCPLGKMRLTVPCRALTCAHLQSFDAALYLQMNEK KPTWTCPVCDKKAPYESLIIDGLFMEILSSCSDCDEIQFMEDGSWCPMKPKKEASEVCPP PGYGLDGLQYSPVQGGDPSENKKKVEVIDLTIESSSDEEDLPPTKKHCSVTSAAIPALPG SKGVLTSGHQPSSVLRSPAMGTLGGDFLSSLPLHEYPPAFPLGADIQGLDLFSFLQTESQ HYGPSVITSLDEQDALGHFFQYRGTPSHFLGPLAPTLGSSHCSATPAPPPGRVSSIVAPG GALREGHGGPLPSGPSLTGCRSDIISLD Click to Show/Hide
|
||||
| 3D-structure |
|
||||
| Function |
Functions as an E3-type small ubiquitin-like modifier (SUMO) ligase, stabilizing the interaction between UBE2I and the substrate, and as a SUMO-tethering factor. Plays a crucial role as a transcriptional coregulation in various cellular pathways, including the STAT pathway and the steroid hormone signaling pathway. Involved in regulating STAT3 signaling via inhibiting STAT3 DNA-binding and suppressing cell growth. Enhances the sumoylation of MTA1 and may participate in its paralog-selective sumoylation. Sumoylates CCAR2 which promotes its interaction with SIRT1. Diminishes the sumoylation of ZFHX3 by preventing the colocalization of ZFHX3 with SUMO1 in the nucleus.
Click to Show/Hide
|
||||
| Uniprot ID | |||||
| Ensembl ID | |||||
| HGNC ID | |||||
| Click to Show/Hide the Complete Species Lineage | |||||
Type(s) of Resistant Mechanism of This Molecule
Drug Resistance Data Categorized by Drug
Approved Drug(s)
1 drug(s) in total
| Drug Sensitivity Data Categorized by Their Corresponding Mechanisms | ||||
|
|
||||
| Disease Class: Glioblastoma [ICD-11: 2A00.02] | [1] | |||
| Sensitive Disease | Glioblastoma [ICD-11: 2A00.02] | |||
| Sensitive Drug | Temozolomide | |||
| Molecule Alteration | Expression | Up-regulation |
||
| Differential expression of the molecule in resistant disease | ||||
| Classification of Disease | Brain cancer [ICD-11: 2A00] | |||
| The Specified Disease | Brain cancer | |||
| The Studied Tissue | Nervous tissue | |||
| The Expression Level of Disease Section Compare with the Healthy Individual Tissue | p-value: 3.18E-47 Fold-change: 7.14E-02 Z-score: 1.52E+01 |
|||
| Experimental Note | Identified from the Human Clinical Data | |||
| Cell Pathway Regulation | Cell migration | Inhibition | hsa04670 | |
| In Vitro Model | GSCs cells | Brain | Homo sapiens (Human) | N.A. |
| In Vivo Model | Nude mouse xenograft model | Mus musculus | ||
| Experiment for Molecule Alteration |
Western blot analysis | |||
| Experiment for Drug Resistance |
Transwell invasion assay | |||
| Mechanism Description | Inhibition of miR-125b expression may enhance sensitivity of GSCs to temozolomide by targeting PIAS3 on cell invasion. | |||
Disease- and Tissue-specific Abundances of This Molecule
ICD Disease Classification 02

| Differential expression of molecule in resistant diseases | ||
| The Studied Tissue | Nervous tissue | |
| The Specified Disease | Brain cancer | |
| The Expression Level of Disease Section Compare with the Healthy Individual Tissue | p-value: 3.18E-47; Fold-change: 4.27E-01; Z-score: 1.20E+00 | |
|
Molecule expression in the diseased tissue of patients
Molecule expression in the normal tissue of healthy individuals
|
||
| Disease-specific Molecule Abundances |

|
Click to View the Clearer Original Diagram |
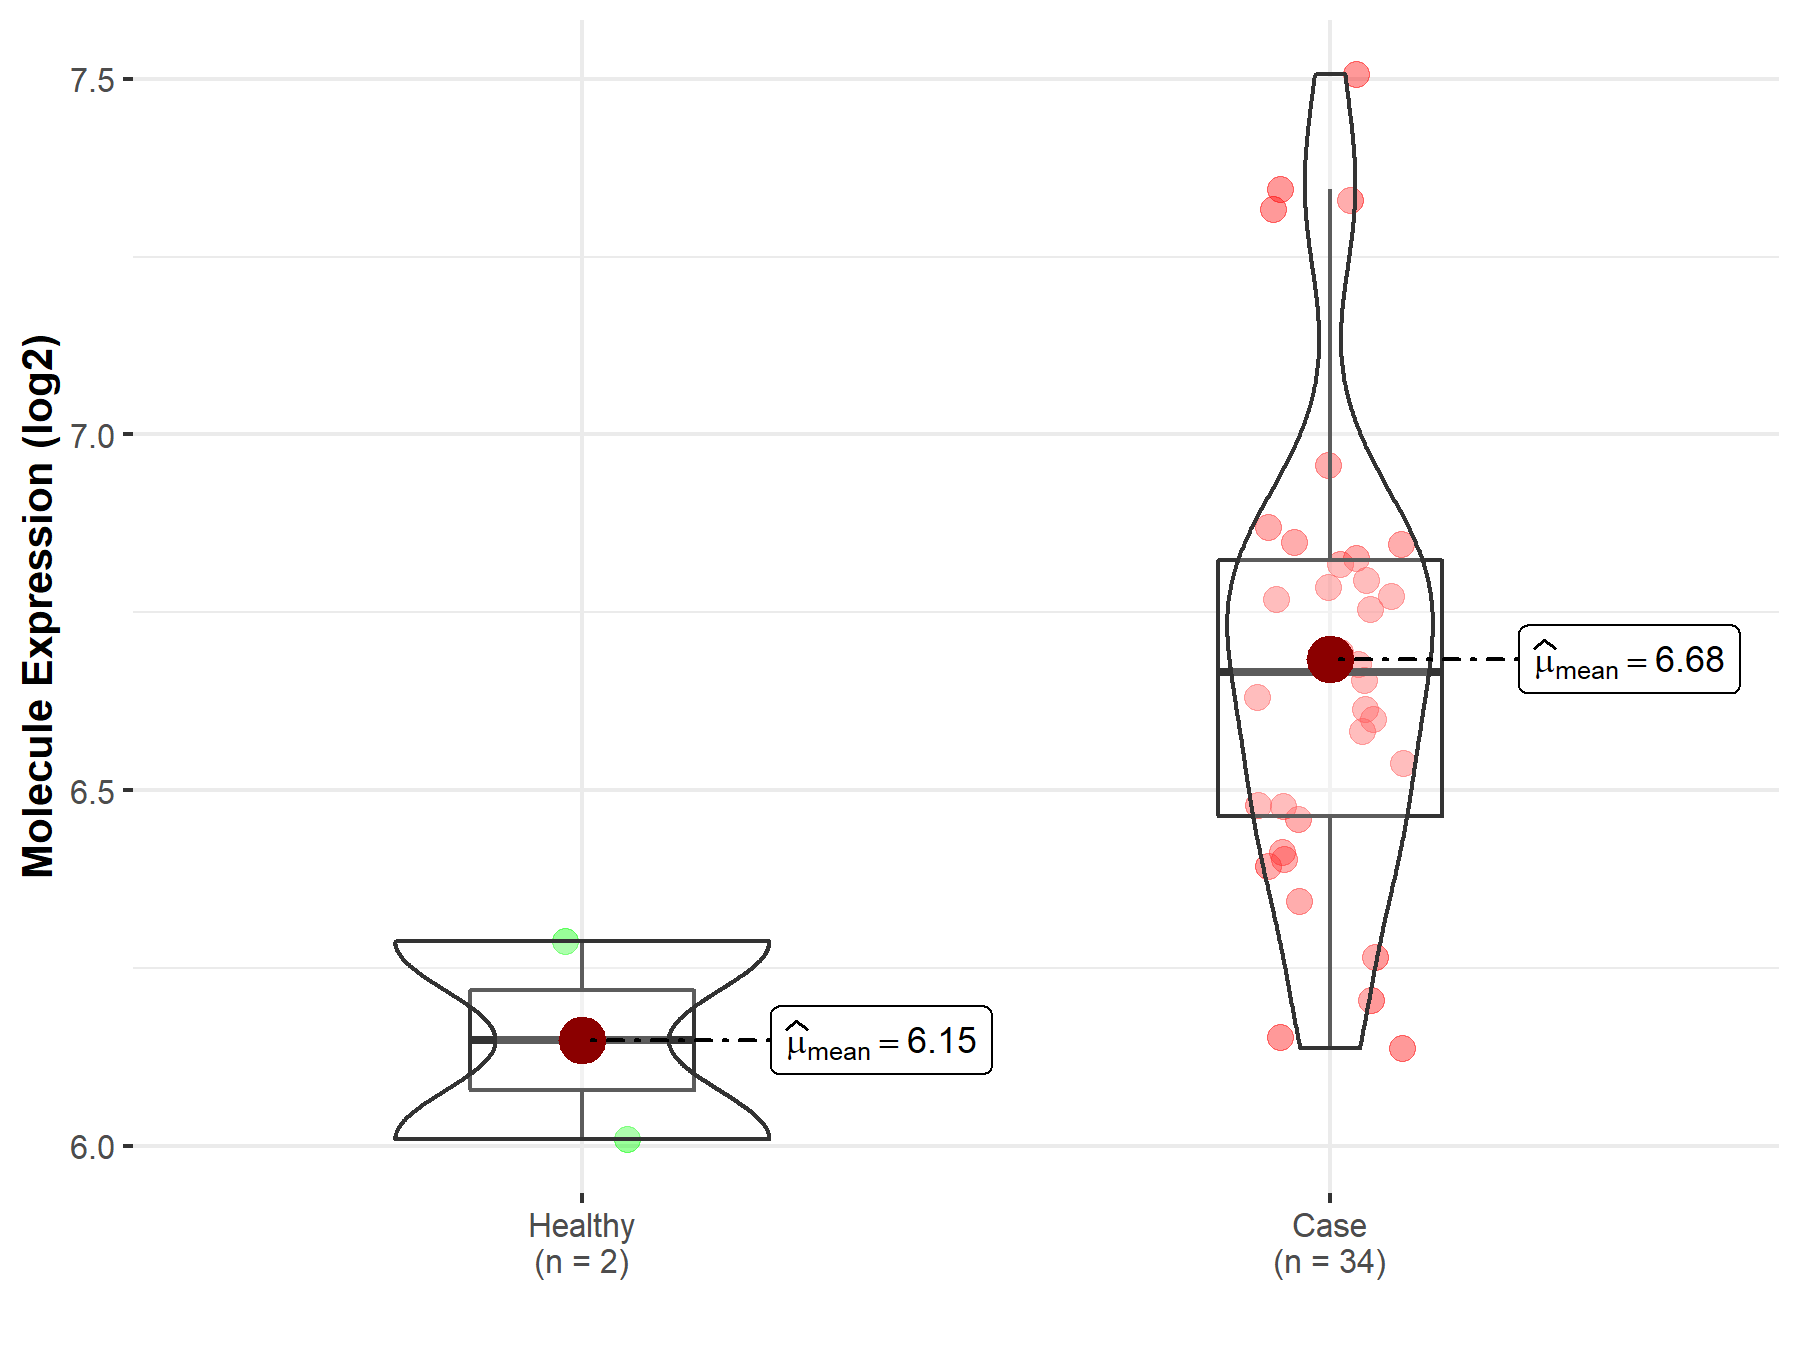
| The Studied Tissue | Brainstem tissue | |
| The Specified Disease | Glioma | |
| The Expression Level of Disease Section Compare with the Healthy Individual Tissue | p-value: 1.20E-01; Fold-change: 5.18E-01; Z-score: 2.62E+00 | |
|
Molecule expression in the diseased tissue of patients
Molecule expression in the normal tissue of healthy individuals
|
||
| Disease-specific Molecule Abundances |

|
Click to View the Clearer Original Diagram |
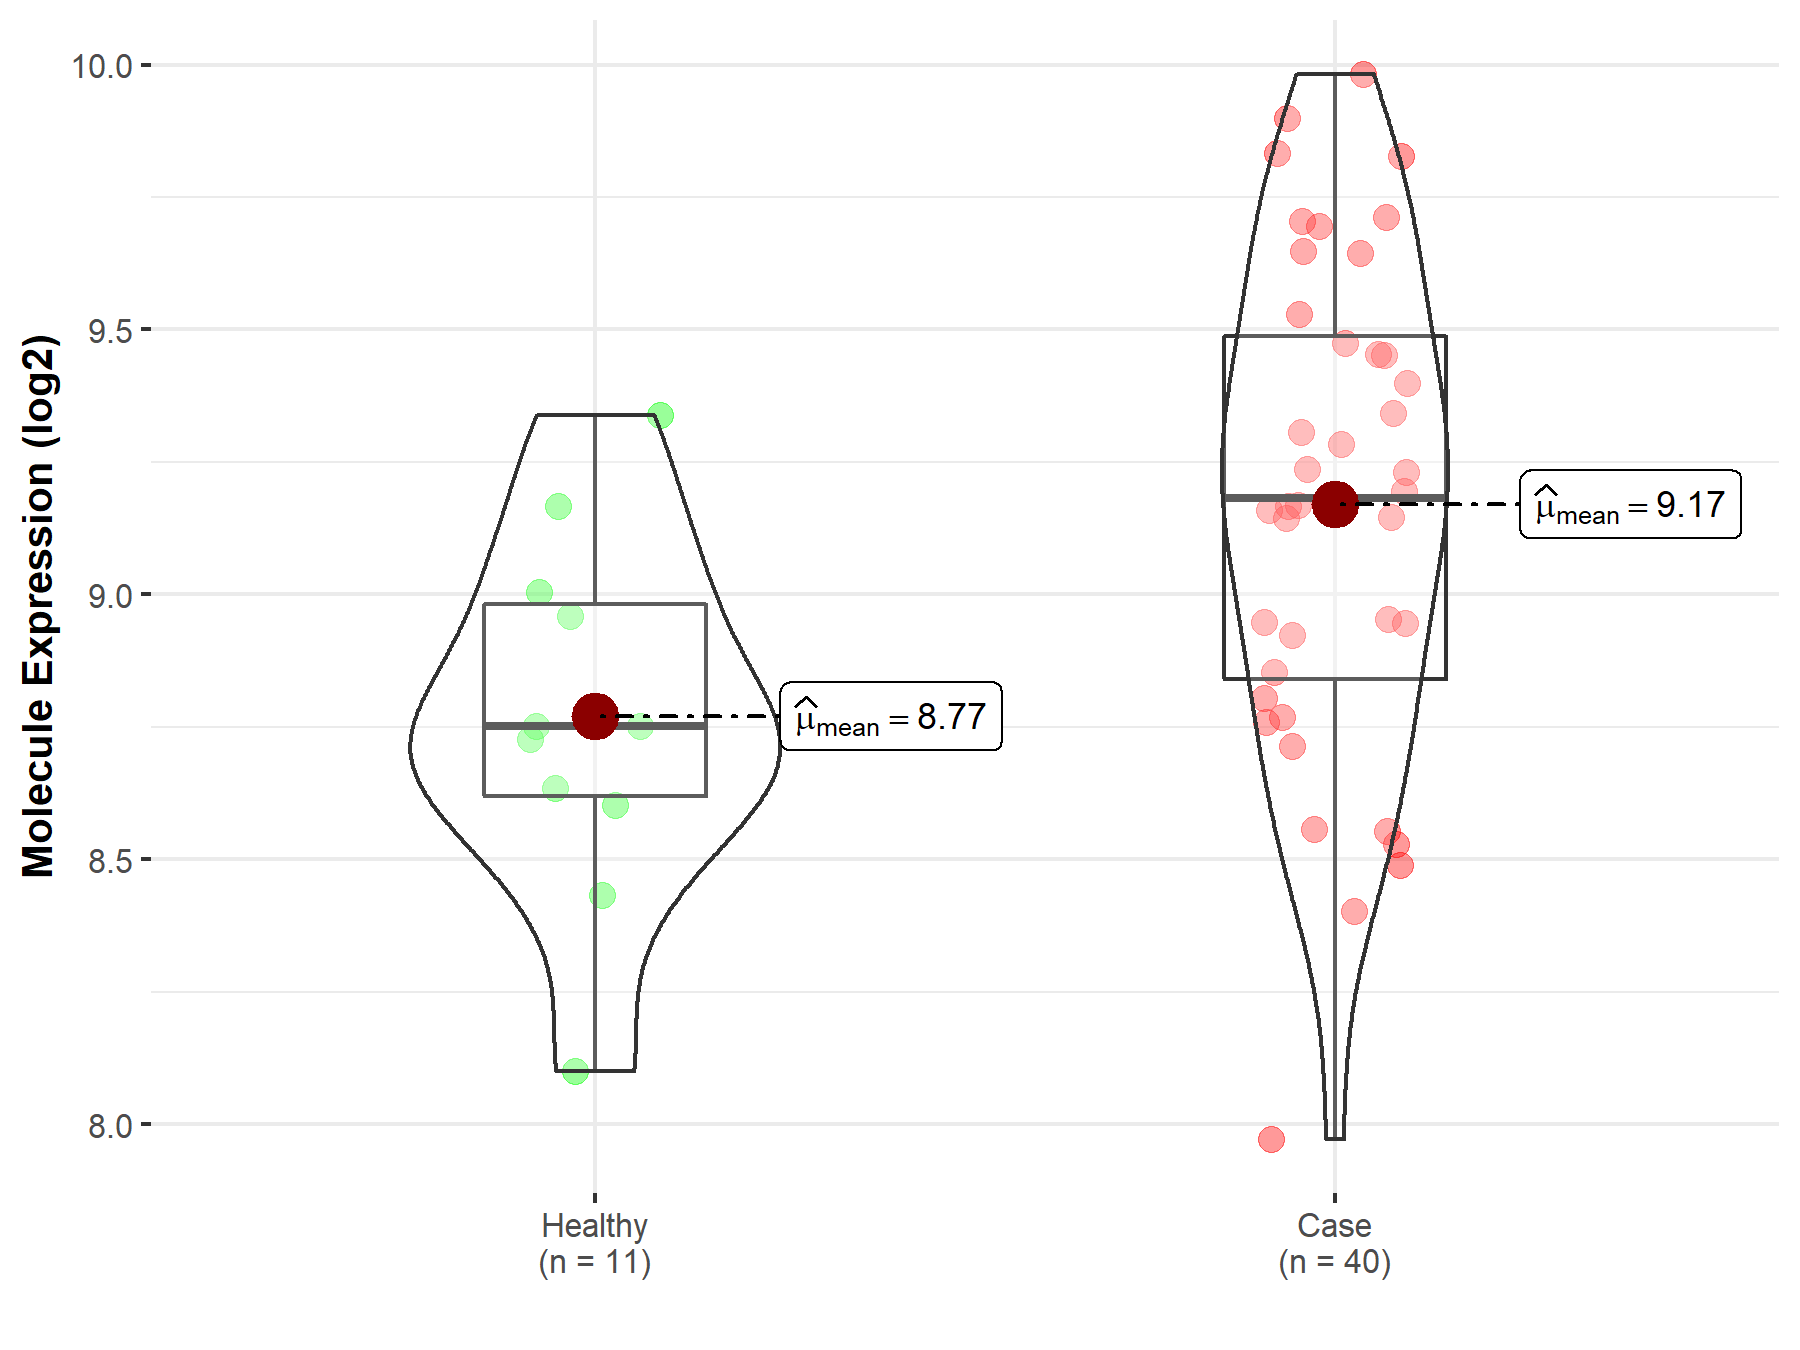
| The Studied Tissue | White matter | |
| The Specified Disease | Glioma | |
| The Expression Level of Disease Section Compare with the Healthy Individual Tissue | p-value: 4.83E-03; Fold-change: 4.31E-01; Z-score: 1.26E+00 | |
|
Molecule expression in the diseased tissue of patients
Molecule expression in the normal tissue of healthy individuals
|
||
| Disease-specific Molecule Abundances |

|
Click to View the Clearer Original Diagram |
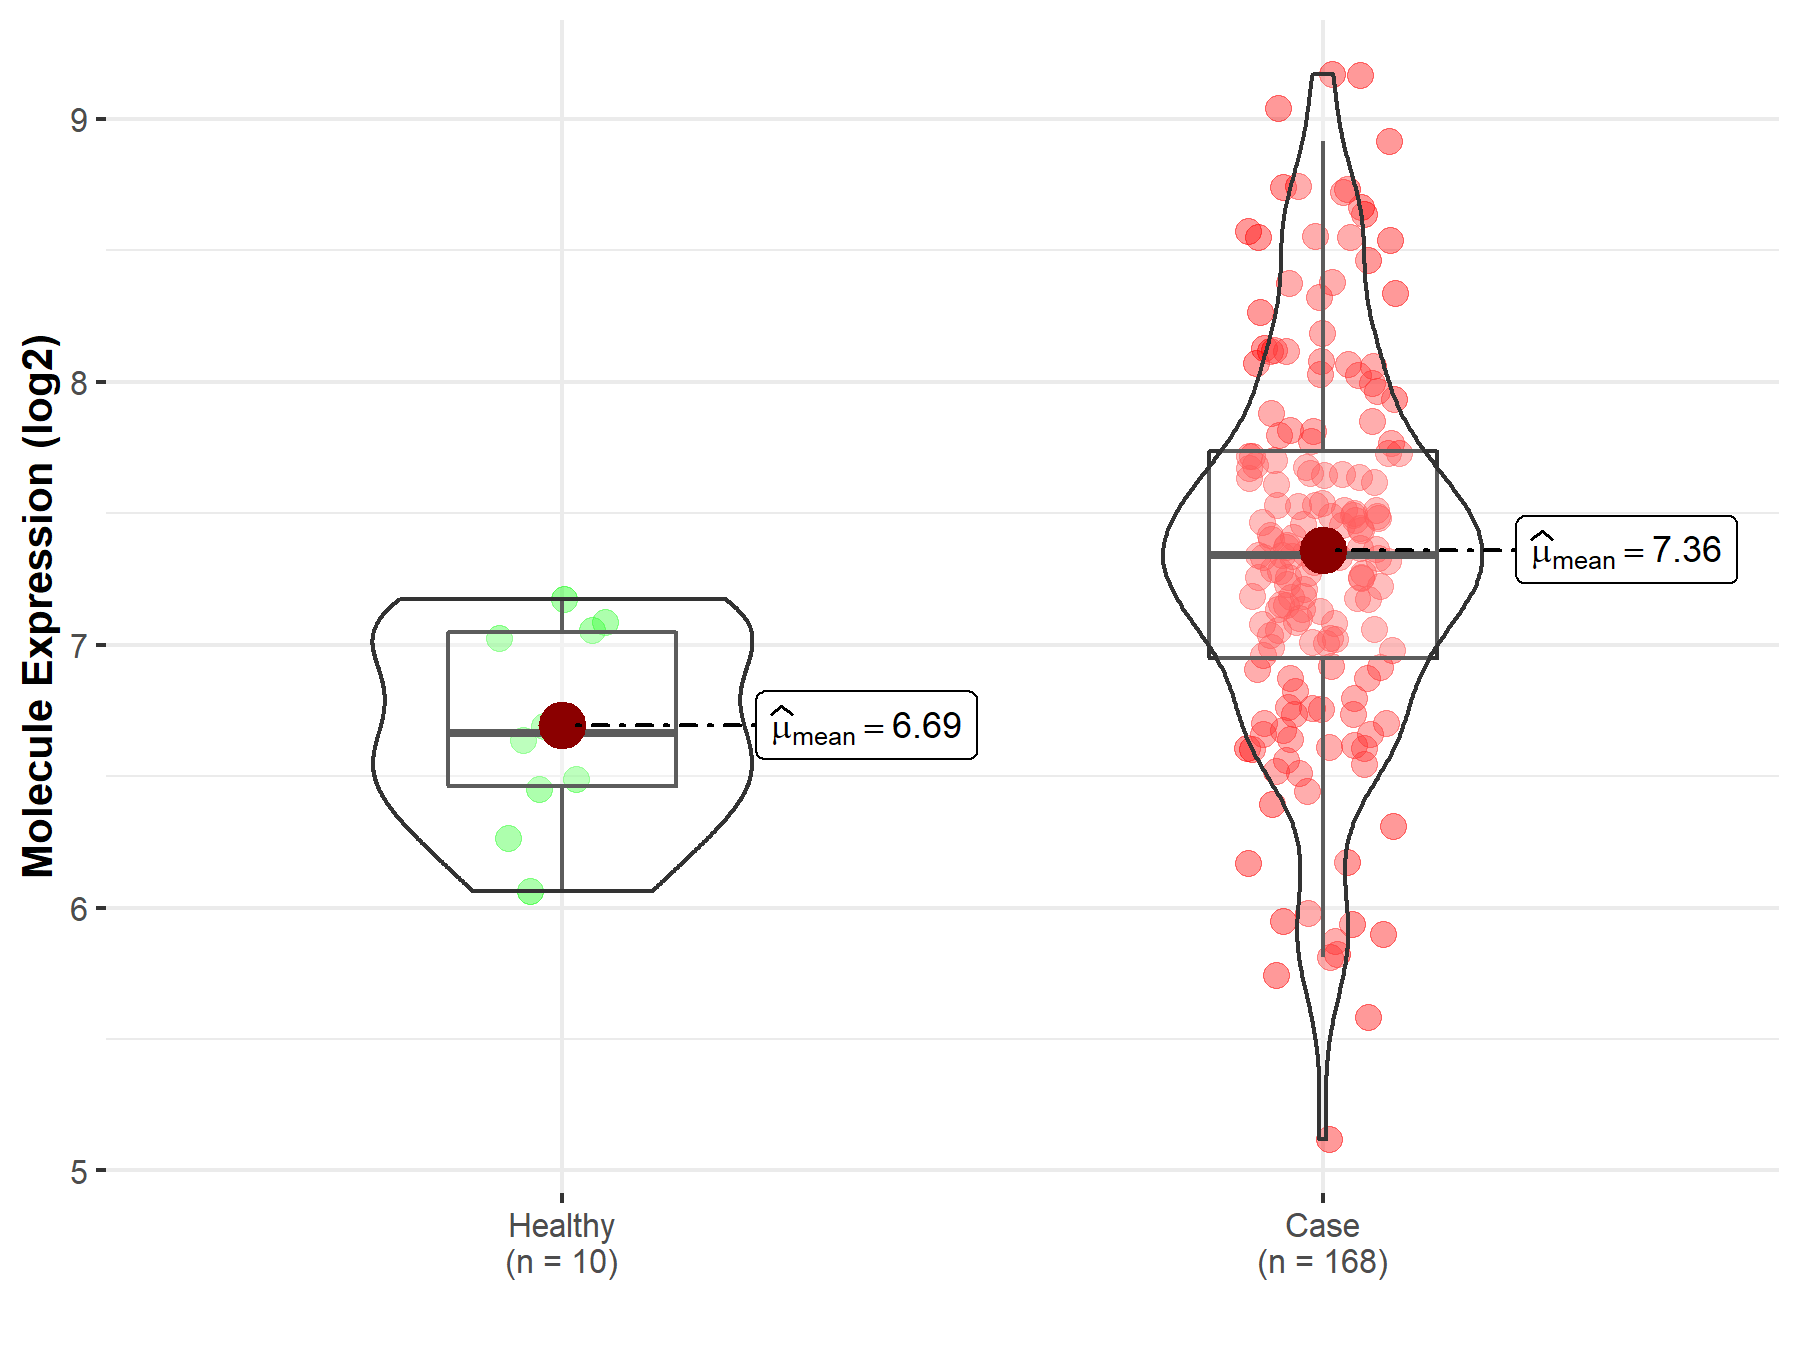
| The Studied Tissue | Brainstem tissue | |
| The Specified Disease | Neuroectodermal tumor | |
| The Expression Level of Disease Section Compare with the Healthy Individual Tissue | p-value: 2.19E-04; Fold-change: 6.76E-01; Z-score: 1.77E+00 | |
|
Molecule expression in the diseased tissue of patients
Molecule expression in the normal tissue of healthy individuals
|
||
| Disease-specific Molecule Abundances |

|
Click to View the Clearer Original Diagram |
Tissue-specific Molecule Abundances in Healthy Individuals


|
||
References
If you find any error in data or bug in web service, please kindly report it to Dr. Sun and Dr. Yu.
