Molecule Information
General Information of the Molecule (ID: Mol00549)
| Name |
Paired box protein Pax-6 (PAX6)
,Homo sapiens
|
||||
|---|---|---|---|---|---|
| Synonyms |
Aniridia type II protein; Oculorhombin; AN2
Click to Show/Hide
|
||||
| Molecule Type |
Protein
|
||||
| Gene Name |
PAX6
|
||||
| Gene ID | |||||
| Location |
chr11:31784779-31817961[-]
|
||||
| Sequence |
MQNSHSGVNQLGGVFVNGRPLPDSTRQKIVELAHSGARPCDISRILQVSNGCVSKILGRY
YETGSIRPRAIGGSKPRVATPEVVSKIAQYKRECPSIFAWEIRDRLLSEGVCTNDNIPSV SSINRVLRNLASEKQQMGADGMYDKLRMLNGQTGSWGTRPGWYPGTSVPGQPTQDGCQQQ EGGGENTNSISSNGEDSDEAQMRLQLKRKLQRNRTSFTQEQIEALEKEFERTHYPDVFAR ERLAAKIDLPEARIQVWFSNRRAKWRREEKLRNQRRQASNTPSHIPISSSFSTSVYQPIP QPTTPVSSFTSGSMLGRTDTALTNTYSALPPMPSFTMANNLPMQPPVPSQTSSYSCMLPT SPSVNGRSYDTYTPPHMQTHMNSQPMGTSGTTSTGLISPGVSVPVQVPGSEPDMSQYWPR LQ Click to Show/Hide
|
||||
| 3D-structure |
|
||||
| Function |
Transcription factor with important functions in the development of the eye, nose, central nervous system and pancreas. Required for the differentiation of pancreatic islet alpha cells (By similarity). Competes with PAX4 in binding to a common element in the glucagon, insulin and somatostatin promoters. Regulates specification of the ventral neuron subtypes by establishing the correct progenitor domains (By similarity). Acts as a transcriptional repressor of NFATC1-mediated gene expression (By similarity).
Click to Show/Hide
|
||||
| Uniprot ID | |||||
| Ensembl ID | |||||
| HGNC ID | |||||
| Click to Show/Hide the Complete Species Lineage | |||||
Type(s) of Resistant Mechanism of This Molecule
Drug Resistance Data Categorized by Drug
Approved Drug(s)
1 drug(s) in total
| Drug Resistance Data Categorized by Their Corresponding Mechanisms | ||||
|
|
||||
| Disease Class: Glioblastoma [ICD-11: 2A00.02] | [1] | |||
| Resistant Disease | Glioblastoma [ICD-11: 2A00.02] | |||
| Resistant Drug | Temozolomide | |||
| Molecule Alteration | Expression | Down-regulation |
||
| Differential expression of the molecule in resistant disease | ||||
| Classification of Disease | Brain cancer [ICD-11: 2A00] | |||
| The Specified Disease | Glioma | |||
| The Studied Tissue | Brainstem tissue | |||
| The Expression Level of Disease Section Compare with the Healthy Individual Tissue | p-value: 8.73E-01 Fold-change: -2.68E-02 Z-score: -1.96E-01 |
|||
| Experimental Note | Revealed Based on the Cell Line Data | |||
| Cell Pathway Regulation | PI3K/AKT signaling pathway | Inhibition | hsa04151 | |
| In Vitro Model | U251 cells | Brain | Homo sapiens (Human) | CVCL_0021 |
| Experiment for Molecule Alteration |
Western blot analysis | |||
| Experiment for Drug Resistance |
Transwell assay; Transwell matrix penetration assay; MTT assay; BrdU incorporation assay | |||
| Mechanism Description | miR223/PAX6 axis regulates glioblastoma stem cell proliferation and the chemo resistance to TMZ via inhibition of PI3k/Akt pathway. | |||
Disease- and Tissue-specific Abundances of This Molecule
ICD Disease Classification 02

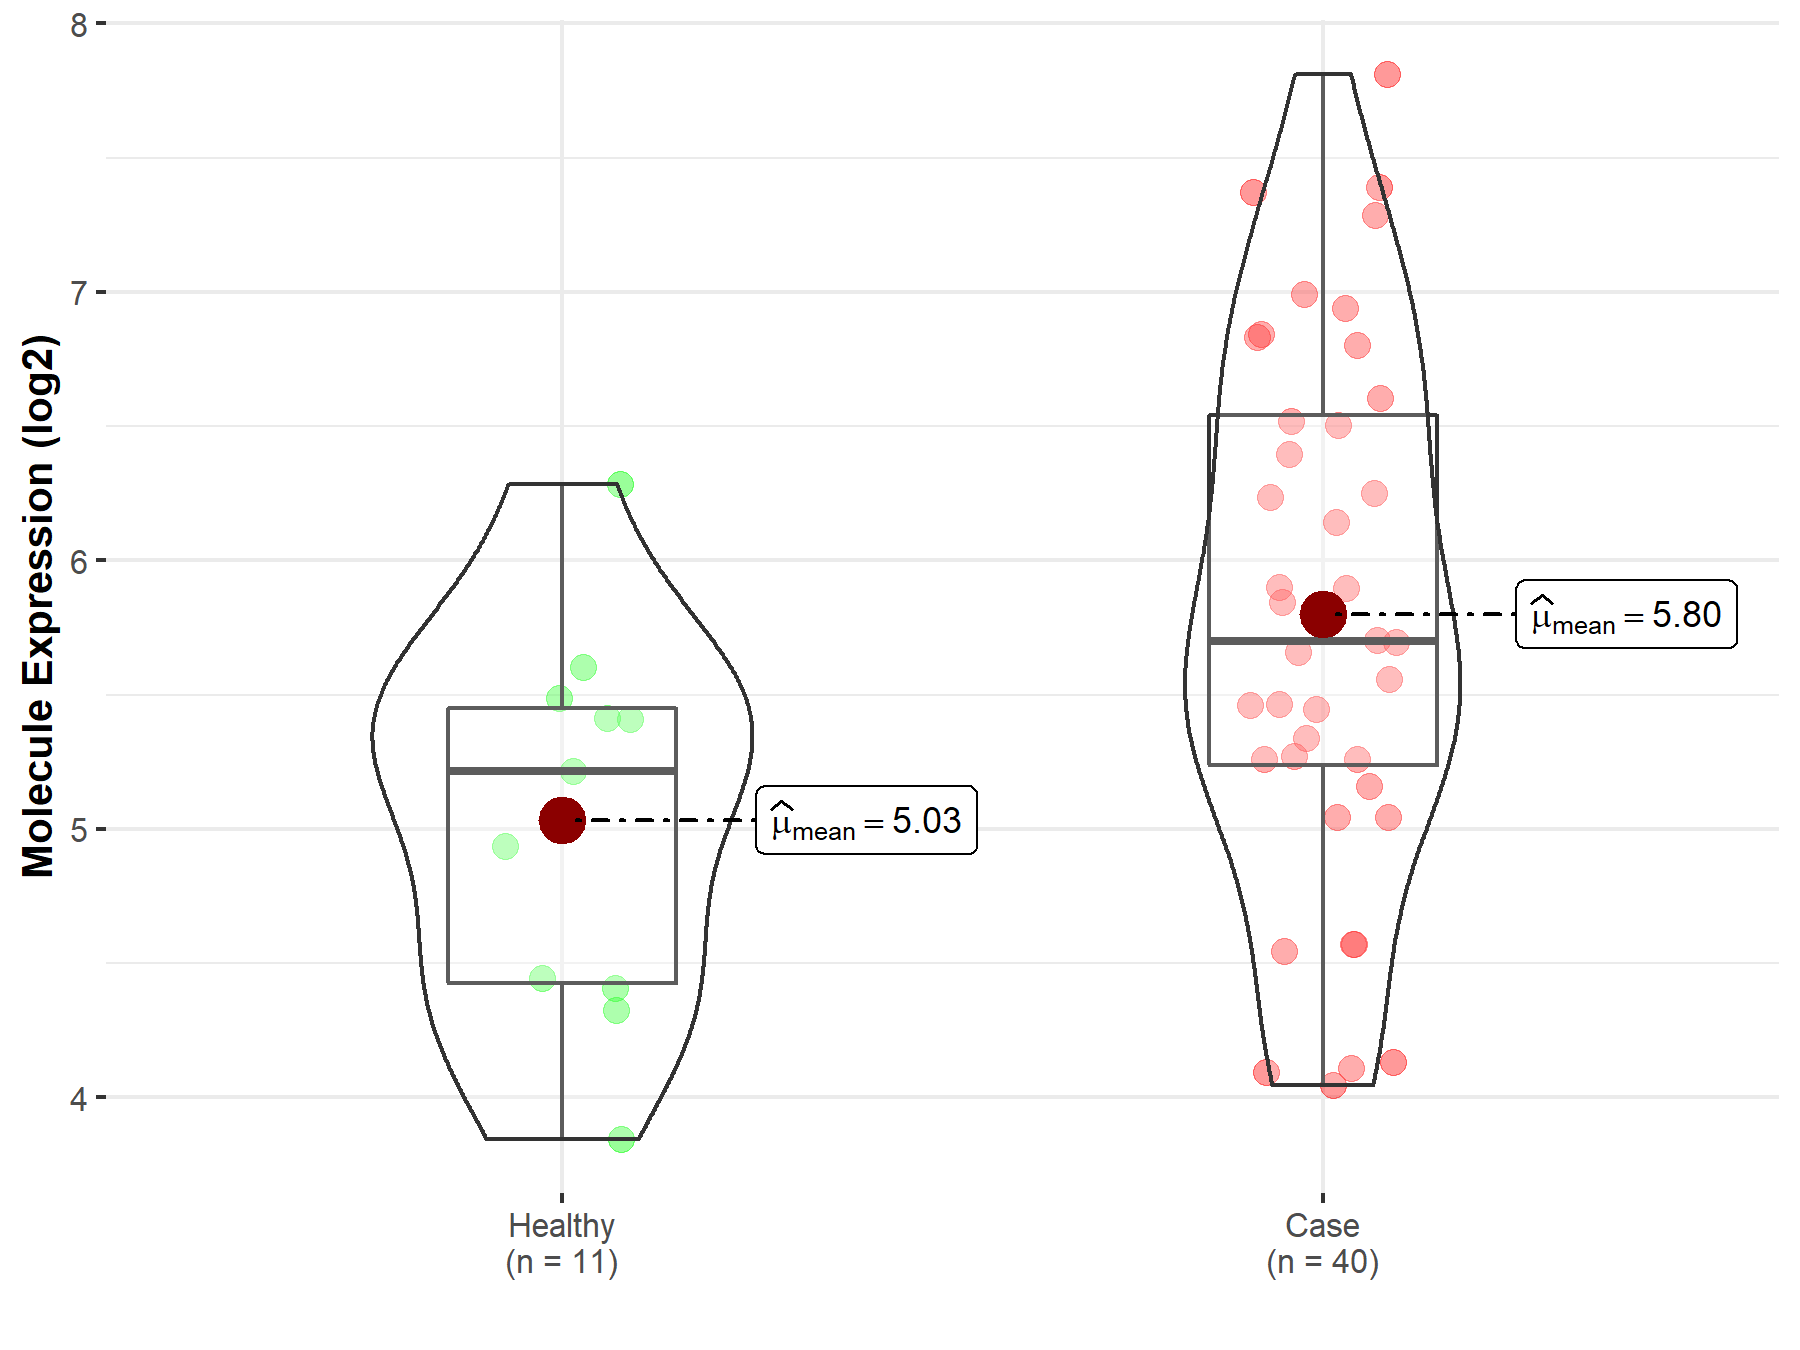
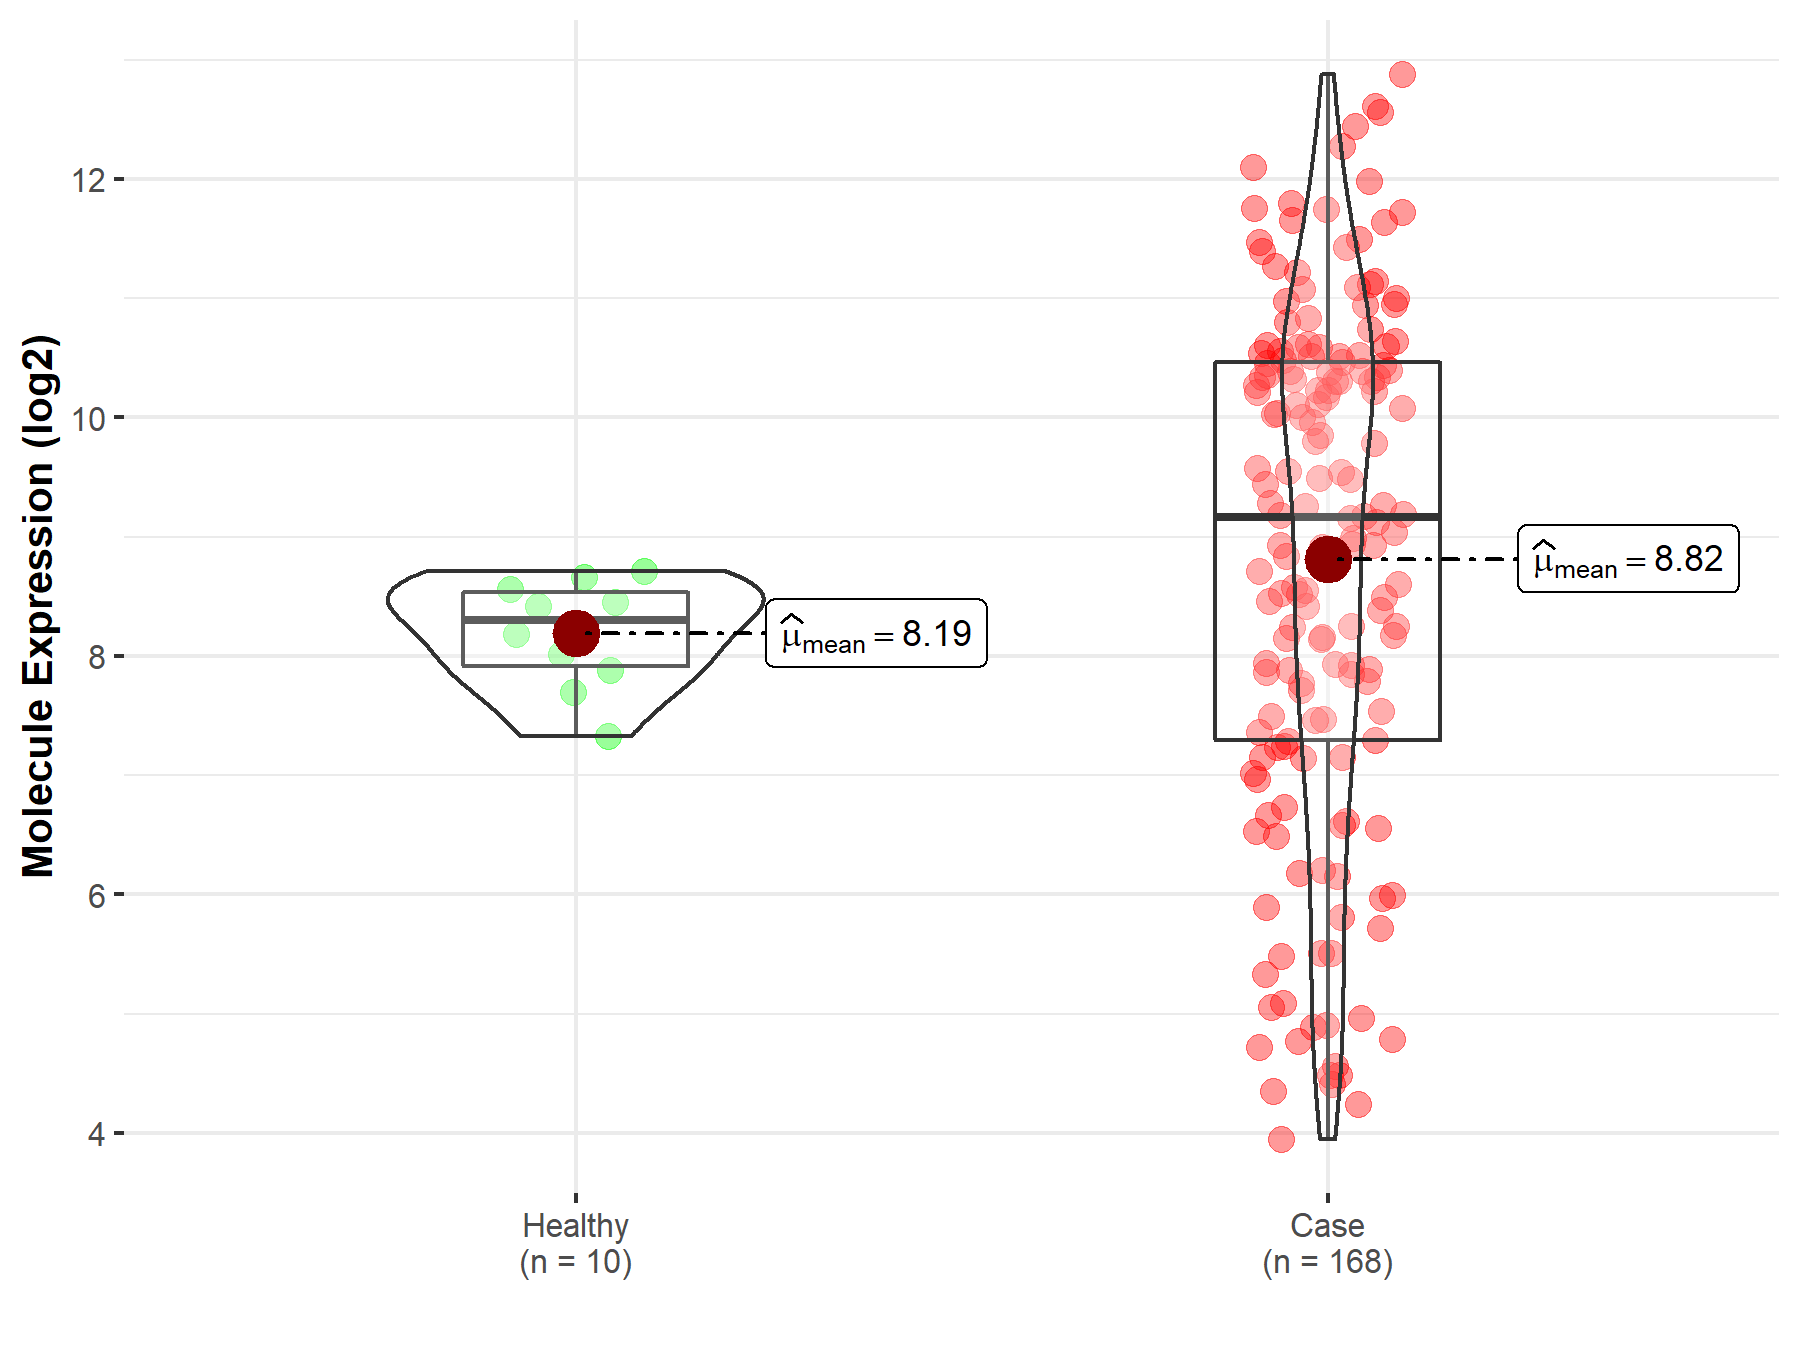
| Differential expression of molecule in resistant diseases | ||
| The Studied Tissue | Nervous tissue | |
| The Specified Disease | Brain cancer | |
| The Expression Level of Disease Section Compare with the Healthy Individual Tissue | p-value: 2.93E-32; Fold-change: 6.49E-01; Z-score: 6.53E-01 | |
|
Molecule expression in the diseased tissue of patients
Molecule expression in the normal tissue of healthy individuals
|
||
| Disease-specific Molecule Abundances |

|
Click to View the Clearer Original Diagram |
| The Studied Tissue | Brainstem tissue | |
| The Specified Disease | Glioma | |
| The Expression Level of Disease Section Compare with the Healthy Individual Tissue | p-value: 8.73E-01; Fold-change: 2.78E-02; Z-score: 2.75E-02 | |
|
Molecule expression in the diseased tissue of patients
Molecule expression in the normal tissue of healthy individuals
|
||
| Disease-specific Molecule Abundances |

|
Click to View the Clearer Original Diagram |
| The Studied Tissue | White matter | |
| The Specified Disease | Glioma | |
| The Expression Level of Disease Section Compare with the Healthy Individual Tissue | p-value: 8.77E-03; Fold-change: 4.83E-01; Z-score: 6.78E-01 | |
|
Molecule expression in the diseased tissue of patients
Molecule expression in the normal tissue of healthy individuals
|
||
| Disease-specific Molecule Abundances |

|
Click to View the Clearer Original Diagram |
| The Studied Tissue | Brainstem tissue | |
| The Specified Disease | Neuroectodermal tumor | |
| The Expression Level of Disease Section Compare with the Healthy Individual Tissue | p-value: 7.06E-03; Fold-change: 8.61E-01; Z-score: 1.89E+00 | |
|
Molecule expression in the diseased tissue of patients
Molecule expression in the normal tissue of healthy individuals
|
||
| Disease-specific Molecule Abundances |

|
Click to View the Clearer Original Diagram |
Tissue-specific Molecule Abundances in Healthy Individuals


|
||
References
If you find any error in data or bug in web service, please kindly report it to Dr. Sun and Dr. Yu.
