Molecule Information
General Information of the Molecule (ID: Mol00545)
| Name |
PI3-kinase regulatory subunit alpha (PIK3R1)
,Homo sapiens
|
||||
|---|---|---|---|---|---|
| Synonyms |
PI3-kinase regulatory subunit alpha; PI3K regulatory subunit alpha; PtdIns-3-kinase regulatory subunit alpha; Phosphatidylinositol 3-kinase 85 kDa regulatory subunit alpha; PI3-kinase subunit p85-alpha; PtdIns-3-kinase regulatory subunit p85-alpha; GRB1
Click to Show/Hide
|
||||
| Molecule Type |
Protein
|
||||
| Gene Name |
PIK3R1
|
||||
| Gene ID | |||||
| Location |
chr5:68215756-68301821[+]
|
||||
| Sequence |
MSAEGYQYRALYDYKKEREEDIDLHLGDILTVNKGSLVALGFSDGQEARPEEIGWLNGYN
ETTGERGDFPGTYVEYIGRKKISPPTPKPRPPRPLPVAPGSSKTEADVEQQALTLPDLAE QFAPPDIAPPLLIKLVEAIEKKGLECSTLYRTQSSSNLAELRQLLDCDTPSVDLEMIDVH VLADAFKRYLLDLPNPVIPAAVYSEMISLAPEVQSSEEYIQLLKKLIRSPSIPHQYWLTL QYLLKHFFKLSQTSSKNLLNARVLSEIFSPMLFRFSAASSDNTENLIKVIEILISTEWNE RQPAPALPPKPPKPTTVANNGMNNNMSLQDAEWYWGDISREEVNEKLRDTADGTFLVRDA STKMHGDYTLTLRKGGNNKLIKIFHRDGKYGFSDPLTFSSVVELINHYRNESLAQYNPKL DVKLLYPVSKYQQDQVVKEDNIEAVGKKLHEYNTQFQEKSREYDRLYEEYTRTSQEIQMK RTAIEAFNETIKIFEEQCQTQERYSKEYIEKFKREGNEKEIQRIMHNYDKLKSRISEIID SRRRLEEDLKKQAAEYREIDKRMNSIKPDLIQLRKTRDQYLMWLTQKGVRQKKLNEWLGN ENTEDQYSLVEDDEDLPHHDEKTWNVGSSNRNKAENLLRGKRDGTFLVRESSKQGCYACS VVVDGEVKHCVINKTATGYGFAEPYNLYSSLKELVLHYQHTSLVQHNDSLNVTLAYPVYA QQRR Click to Show/Hide
|
||||
| 3D-structure |
|
||||
| Function |
Binds to activated (phosphorylated) protein-Tyr kinases, through its SH2 domain, and acts as an adapter, mediating the association of the p110 catalytic unit to the plasma membrane. Necessary for the insulin-stimulated increase in glucose uptake and glycogen synthesis in insulin-sensitive tissues. Plays an important role in signaling in response to FGFR1, FGFR2, FGFR3, FGFR4, KITLG/SCF, KIT, PDGFRA and PDGFRB. Likewise, plays a role in ITGB2 signaling. Modulates the cellular response to ER stress by promoting nuclear translocation of XBP1 isoform 2 in a ER stress- and/or insulin-dependent manner during metabolic overloading in the liver and hence plays a role in glucose tolerance improvement.
Click to Show/Hide
|
||||
| Uniprot ID | |||||
| Ensembl ID | |||||
| HGNC ID | |||||
| Click to Show/Hide the Complete Species Lineage | |||||
Type(s) of Resistant Mechanism of This Molecule
Drug Resistance Data Categorized by Drug
Approved Drug(s)
4 drug(s) in total
| Drug Sensitivity Data Categorized by Their Corresponding Mechanisms | ||||
|
|
||||
| Disease Class: Pancreatic cancer [ICD-11: 2C10.3] | [1] | |||
| Sensitive Disease | Pancreatic cancer [ICD-11: 2C10.3] | |||
| Sensitive Drug | Gemcitabine | |||
| Molecule Alteration | Expression | Up-regulation |
||
| Differential expression of the molecule in resistant disease | ||||
| Classification of Disease | Pancreatic cancer [ICD-11: 2C10] | |||
| The Specified Disease | Pancreatic cancer | |||
| The Studied Tissue | Pancreas | |||
| The Expression Level of Disease Section Compare with the Healthy Individual Tissue | p-value: 7.10E-06 Fold-change: 1.77E-01 Z-score: 4.72E+00 |
|||
| Experimental Note | Revealed Based on the Cell Line Data | |||
| Cell Pathway Regulation | PI3K/AKT signaling pathway | Inhibition | hsa04151 | |
| In Vitro Model | MIA PaCa-2 cells | Pancreas | Homo sapiens (Human) | CVCL_0428 |
| PANC-1 cells | Pancreas | Homo sapiens (Human) | CVCL_0480 | |
| Hs-578T cells | Breast | Homo sapiens (Human) | CVCL_0332 | |
| Experiment for Molecule Alteration |
Western blot analysis | |||
| Experiment for Drug Resistance |
MTT assay | |||
| Mechanism Description | Increased p85alpha expression in PDAC TCs results in decreased PI3k-AkT signaling and increased gemcitabine sensitivity. Expression of p85alpha inversely correlates with miR-21 levels in human PDAC. Overexpression of miR-21 results in decreased levels of p85alpha and increased PI3k-AkT activation. | |||
| Disease Class: Cholangiocarcinoma [ICD-11: 2C12.0] | [2] | |||
| Sensitive Disease | Cholangiocarcinoma [ICD-11: 2C12.0] | |||
| Sensitive Drug | Gemcitabine | |||
| Molecule Alteration | Expression | Down-regulation |
||
| Differential expression of the molecule in resistant disease | ||||
| Classification of Disease | Liver cancer [ICD-11: 2C12] | |||
| The Specified Disease | Liver cancer | |||
| The Studied Tissue | Liver tissue | |||
| The Expression Level of Disease Section Compare with the Healthy Individual Tissue | p-value: 1.13E-05 Fold-change: -7.38E-02 Z-score: -4.75E+00 |
|||
| Experimental Note | Revealed Based on the Cell Line Data | |||
| In Vitro Model | HuCCT1 cells | Bile duct | Homo sapiens (Human) | CVCL_0324 |
| HuH28 cells | Bile duct | Homo sapiens (Human) | CVCL_2955 | |
| Experiment for Molecule Alteration |
Western blot analysis | |||
| Experiment for Drug Resistance |
CCK8 assay | |||
| Mechanism Description | Two miR-29b target genes, PIk3R1 and MMP-2, that are, at least partly, responsible for the resistance of CCA Gem treatment. PIk3R1 encodes phosphoinositide 3-kinase (PI3k) regulatory subunit designated p85 alpha; p85 alpha is regarded as integrator of multiple signaling pathways that together promote cell proliferation, cell survival, and carcinogenesis. | |||
| Drug Resistance Data Categorized by Their Corresponding Mechanisms | ||||
|
|
||||
| Disease Class: Gastric cancer [ICD-11: 2B72.1] | [3] | |||
| Resistant Disease | Gastric cancer [ICD-11: 2B72.1] | |||
| Resistant Drug | Cisplatin | |||
| Molecule Alteration | Expression | Up-regulation |
||
| Experimental Note | Identified from the Human Clinical Data | |||
| Cell Pathway Regulation | PI3K/AKT signaling pathway | Activation | hsa04151 | |
| In Vitro Model | SGC7901 cells | Gastric | Homo sapiens (Human) | CVCL_0520 |
| BGC823 cells | Gastric | Homo sapiens (Human) | CVCL_3360 | |
| In Vivo Model | Nude mouse xenograft model | Mus musculus | ||
| Experiment for Molecule Alteration |
Western blot analysis; RT-qPCR | |||
| Experiment for Drug Resistance |
CCK8 assay | |||
| Mechanism Description | CircAkT3 regulates PIk3R1 expression, activates the PI3k/AkT signaling pathway and ultimately facilitates CDDP resistance by targeting miR-198 in vitro. | |||
| Disease Class: Ovarian cancer [ICD-11: 2C73.0] | [4] | |||
| Resistant Disease | Ovarian cancer [ICD-11: 2C73.0] | |||
| Resistant Drug | Cisplatin | |||
| Molecule Alteration | Expression | Up-regulation |
||
| Experimental Note | Revealed Based on the Cell Line Data | |||
| Cell Pathway Regulation | PI3K/AKT signaling pathway | Activation | hsa04151 | |
| In Vitro Model | SkOV3 cells | Ovary | Homo sapiens (Human) | CVCL_0532 |
| Experiment for Molecule Alteration |
Western blot analysis; Luciferase reporter assay | |||
| Experiment for Drug Resistance |
CCK8 assay | |||
| Mechanism Description | miR503 might be a sensitizer to cisplatin treatment in ovarian cancer by targeting PI3k p85 and participating in the regulation of the PI3k/Akt signaling pathway. The role of miR503 in regulating cisplatin sensitivity in ovarian cancer cells is correlated with the activation of PI3k/Akt signaling. | |||
| Drug Sensitivity Data Categorized by Their Corresponding Mechanisms | ||||
|
|
||||
| Disease Class: Diffuse large B-cell lymphoma [ICD-11: 2A81.0] | [5] | |||
| Sensitive Disease | Diffuse large B-cell lymphoma [ICD-11: 2A81.0] | |||
| Sensitive Drug | Doxorubicin | |||
| Molecule Alteration | Expression | Down-regulation |
||
| Experimental Note | Identified from the Human Clinical Data | |||
| Cell Pathway Regulation | MAPK/BCR/PI signaling pathway | Regulation | N.A. | |
| In Vitro Model | SUDHL-4 cells | Peritoneal effusion | Homo sapiens (Human) | CVCL_0539 |
| Experiment for Molecule Alteration |
qRT-PCR | |||
| Experiment for Drug Resistance |
CellTiter-Blue Cell Viability assay | |||
| Mechanism Description | miR370-3p, miR381-3p, and miR409-3p miRNAs appear to be the most potent regulators of the MAPk, BCR, and PI signaling system. Overexpression of miR370-3p, miR381-3p, and miR409-3p increases sensitivity to rituximab and doxorubicin. | |||
| Drug Sensitivity Data Categorized by Their Corresponding Mechanisms | ||||
|
|
||||
| Disease Class: Diffuse large B-cell lymphoma [ICD-11: 2A81.0] | [5] | |||
| Sensitive Disease | Diffuse large B-cell lymphoma [ICD-11: 2A81.0] | |||
| Sensitive Drug | Rituximab | |||
| Molecule Alteration | Expression | Down-regulation |
||
| Experimental Note | Identified from the Human Clinical Data | |||
| Cell Pathway Regulation | MAPK/BCR/PI signaling pathway | Regulation | N.A. | |
| In Vitro Model | SUDHL-4 cells | Peritoneal effusion | Homo sapiens (Human) | CVCL_0539 |
| Experiment for Molecule Alteration |
qRT-PCR | |||
| Experiment for Drug Resistance |
CellTiter-Blue Cell Viability assay | |||
| Mechanism Description | miR370-3p, miR381-3p, and miR409-3p miRNAs appear to be the most potent regulators of the MAPk, BCR, and PI signaling system. Overexpression of miR370-3p, miR381-3p, and miR409-3p increases sensitivity to rituximab and doxorubicin. | |||
Investigative Drug(s)
1 drug(s) in total
| Drug Sensitivity Data Categorized by Their Corresponding Mechanisms | ||||
|
|
||||
| Disease Class: Colorectal cancer [ICD-11: 2B91.1] | [6] | |||
| Sensitive Disease | Colorectal cancer [ICD-11: 2B91.1] | |||
| Sensitive Drug | Ginsenoside Rg3 | |||
| Molecule Alteration | Phosphorylation | Down-regulation |
||
| Experimental Note | Revealed Based on the Cell Line Data | |||
| Cell Pathway Regulation | Cell apoptosis | Activation | hsa04210 | |
| Cell invasion | Inhibition | hsa05200 | ||
| Cell viability | Inhibition | hsa05200 | ||
| PI3K/AKT signaling pathway | Inhibition | hsa04151 | ||
| In Vitro Model | CaCo2 cells | Colon | Homo sapiens (Human) | CVCL_0025 |
| Experiment for Molecule Alteration |
Western blot analysis | |||
| Experiment for Drug Resistance |
CCK8 assay; Flow cytometry assay; Transwell assay | |||
| Mechanism Description | Ginsenoside Rg3 inhibits cell growth, migration and invasion in Caco-2 cells by downregulation of LncRNA CCAT1. | |||
Disease- and Tissue-specific Abundances of This Molecule
ICD Disease Classification 02

| Differential expression of molecule in resistant diseases | ||
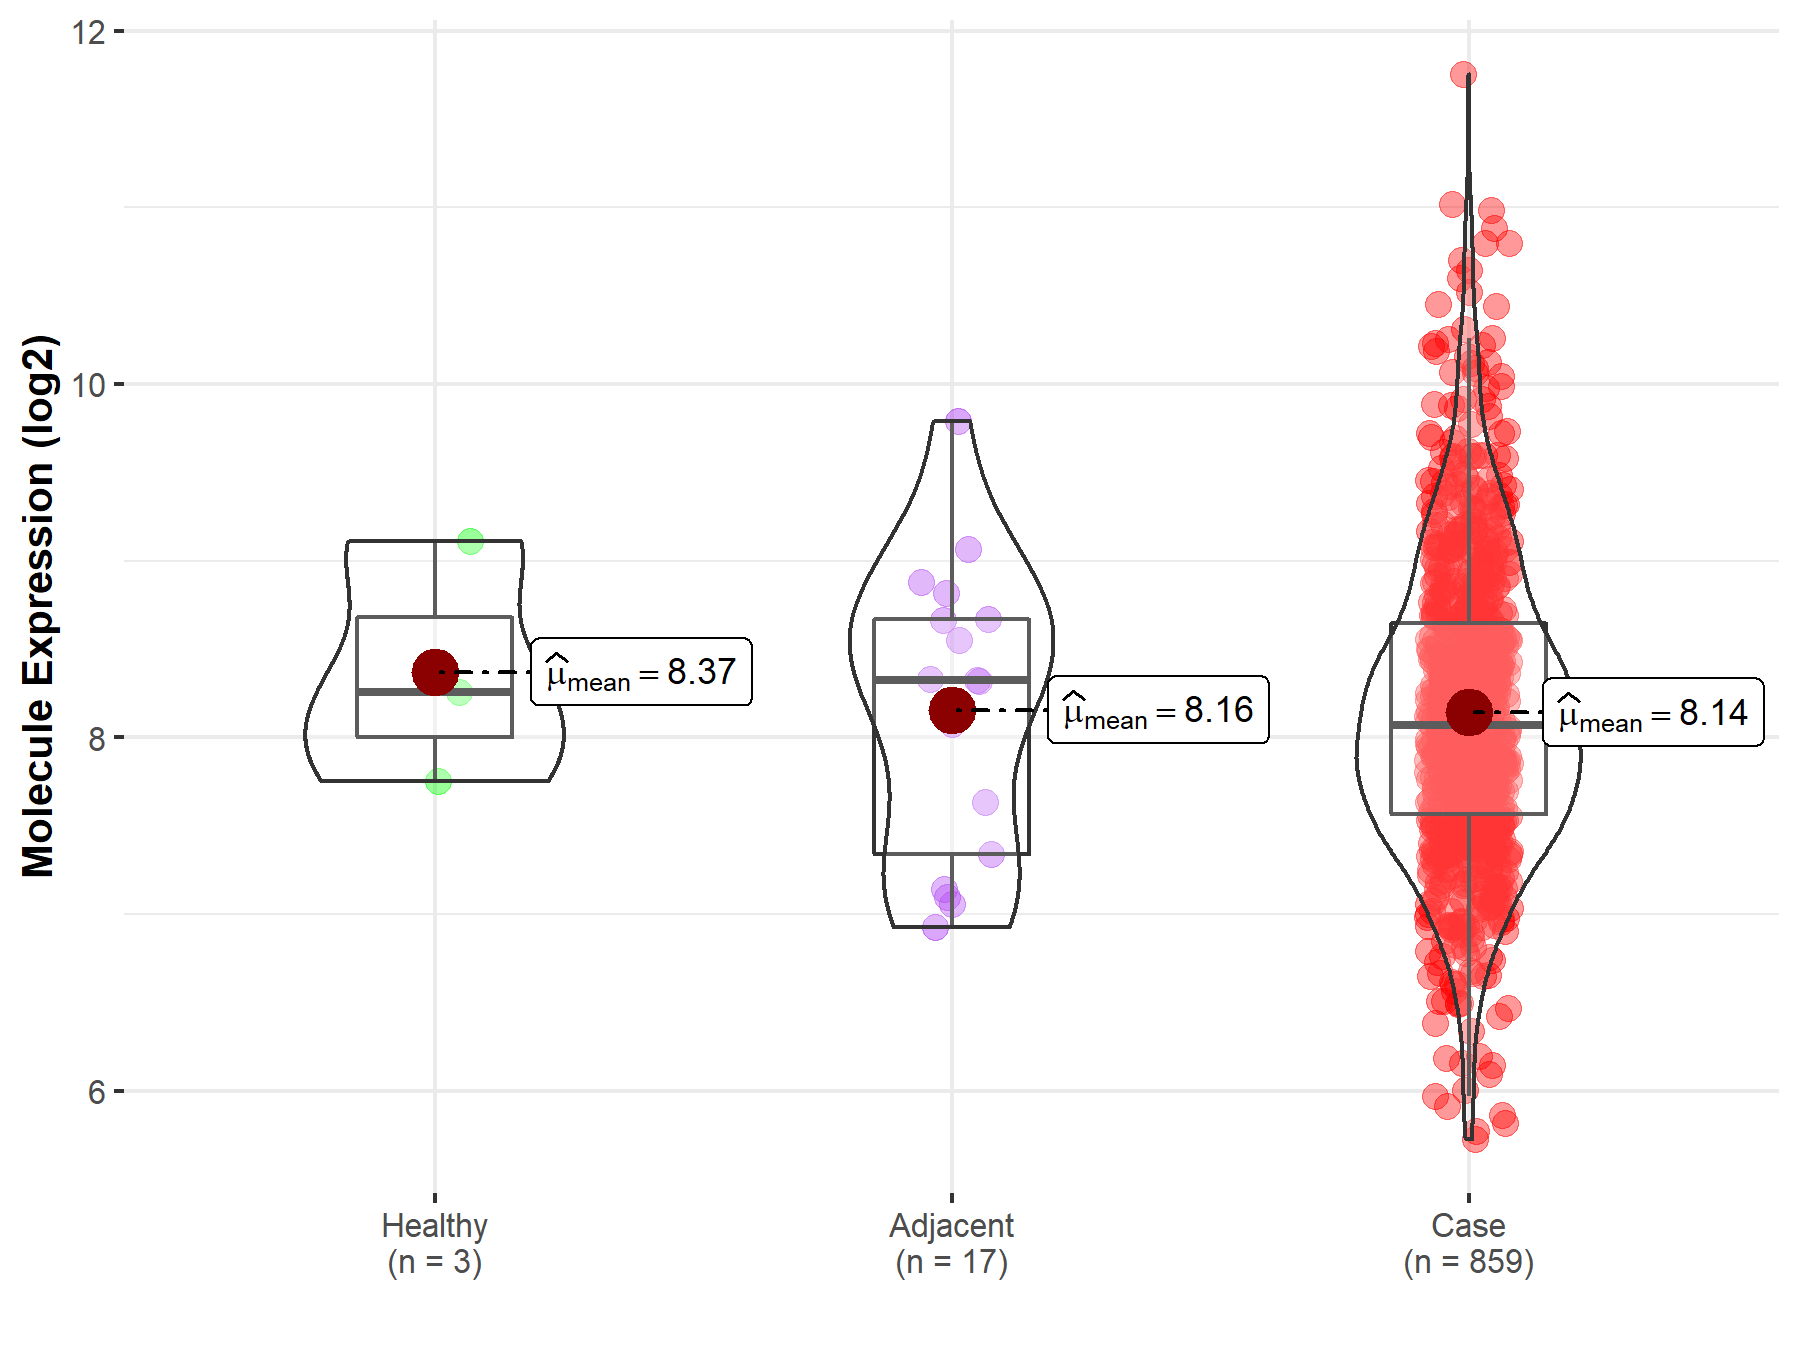
| The Studied Tissue | Gastric tissue | |
| The Specified Disease | Gastric cancer | |
| The Expression Level of Disease Section Compare with the Healthy Individual Tissue | p-value: 6.24E-01; Fold-change: -1.82E-01; Z-score: -2.66E-01 | |
| The Expression Level of Disease Section Compare with the Adjacent Tissue | p-value: 9.47E-01; Fold-change: -2.50E-01; Z-score: -3.00E-01 | |
|
Molecule expression in the normal tissue adjacent to the diseased tissue of patients
Molecule expression in the diseased tissue of patients
Molecule expression in the normal tissue of healthy individuals
|
||
| Disease-specific Molecule Abundances |
|
Click to View the Clearer Original Diagram |
| Differential expression of molecule in resistant diseases | ||
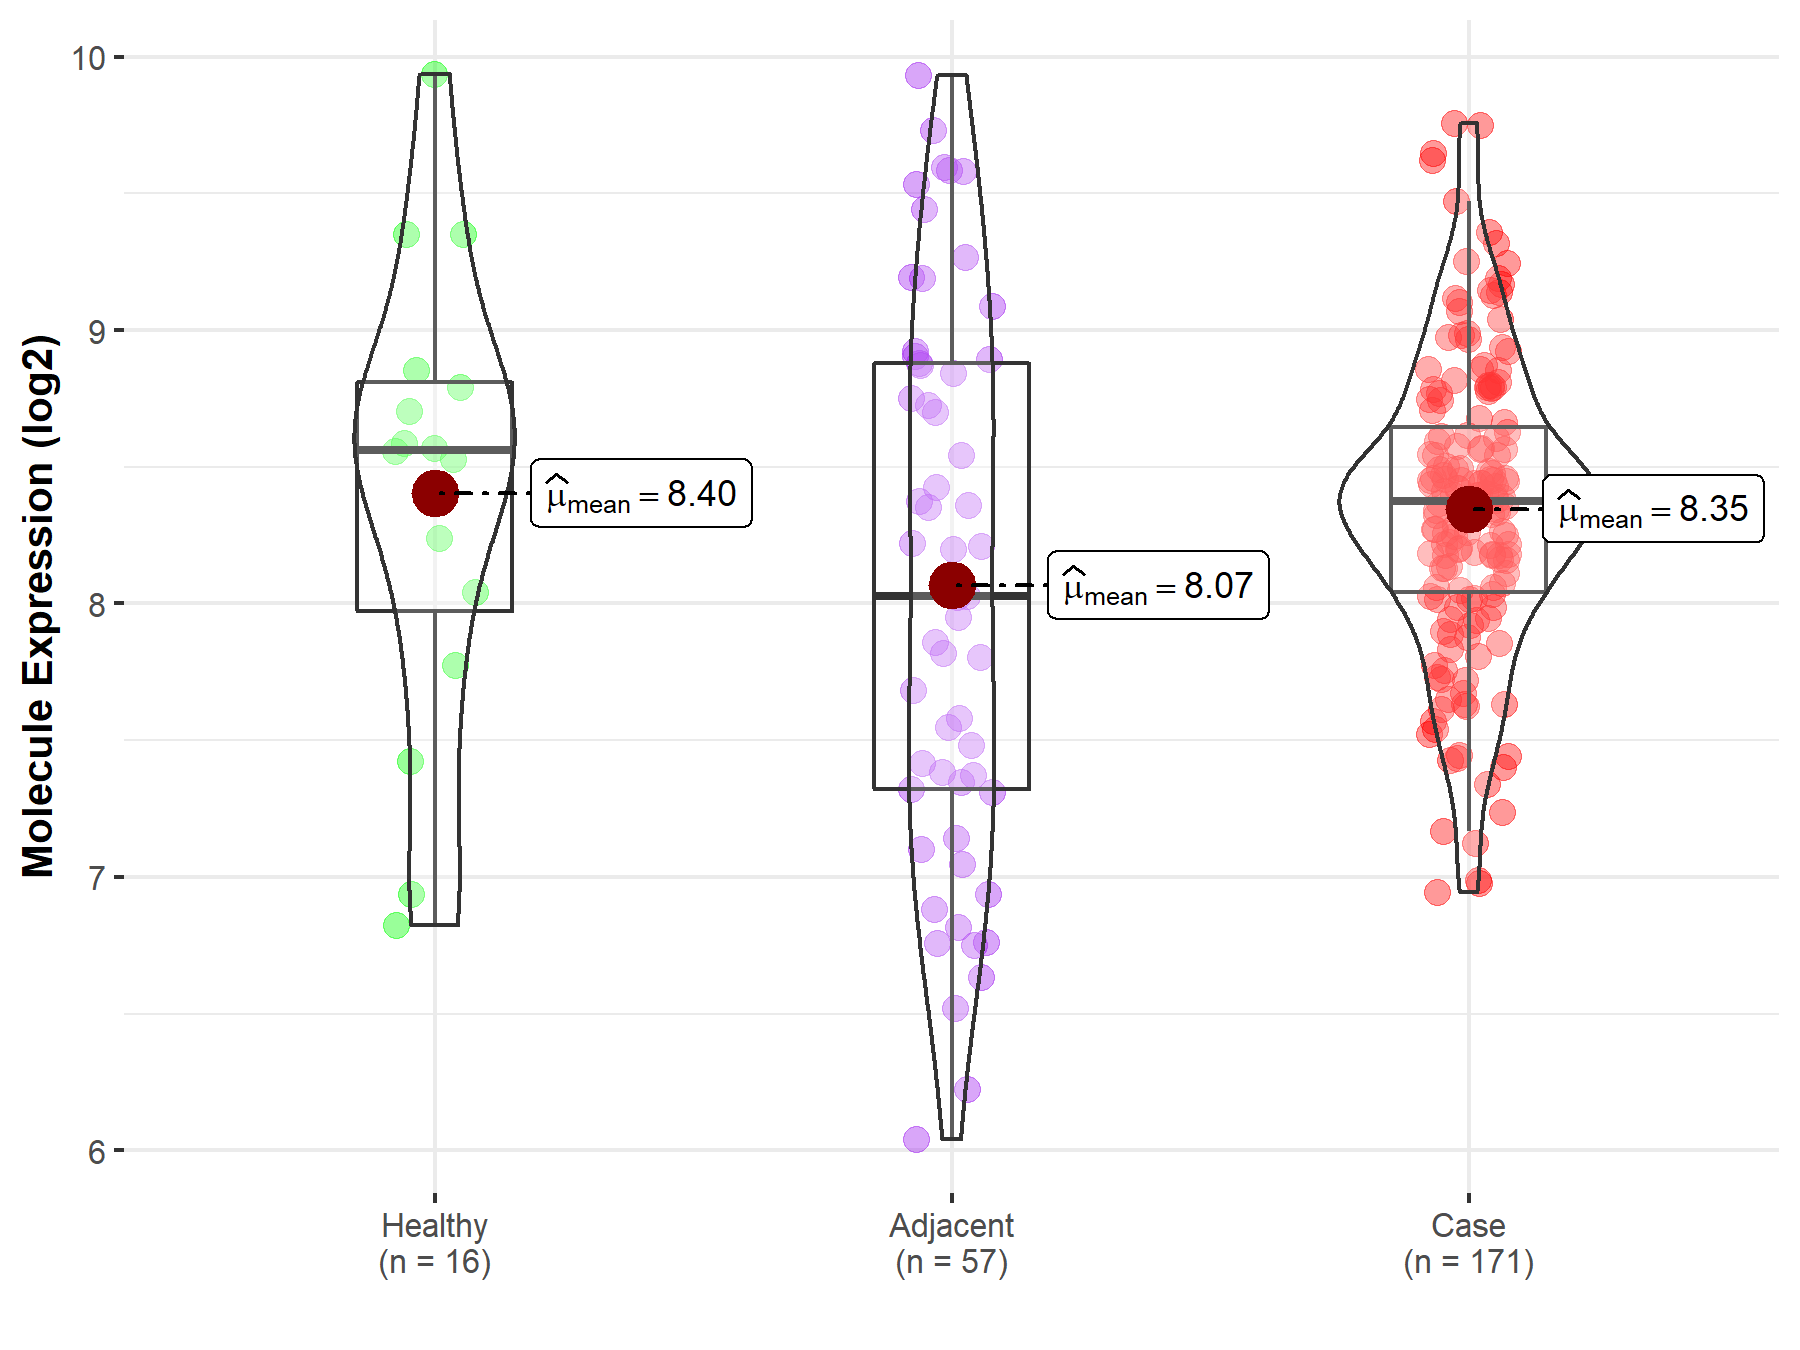
| The Studied Tissue | Pancreas | |
| The Specified Disease | Pancreatic cancer | |
| The Expression Level of Disease Section Compare with the Healthy Individual Tissue | p-value: 7.95E-01; Fold-change: -1.88E-01; Z-score: -2.21E-01 | |
| The Expression Level of Disease Section Compare with the Adjacent Tissue | p-value: 4.95E-02; Fold-change: 3.45E-01; Z-score: 3.44E-01 | |
|
Molecule expression in the normal tissue adjacent to the diseased tissue of patients
Molecule expression in the diseased tissue of patients
Molecule expression in the normal tissue of healthy individuals
|
||
| Disease-specific Molecule Abundances |
|
Click to View the Clearer Original Diagram |
| Differential expression of molecule in resistant diseases | ||
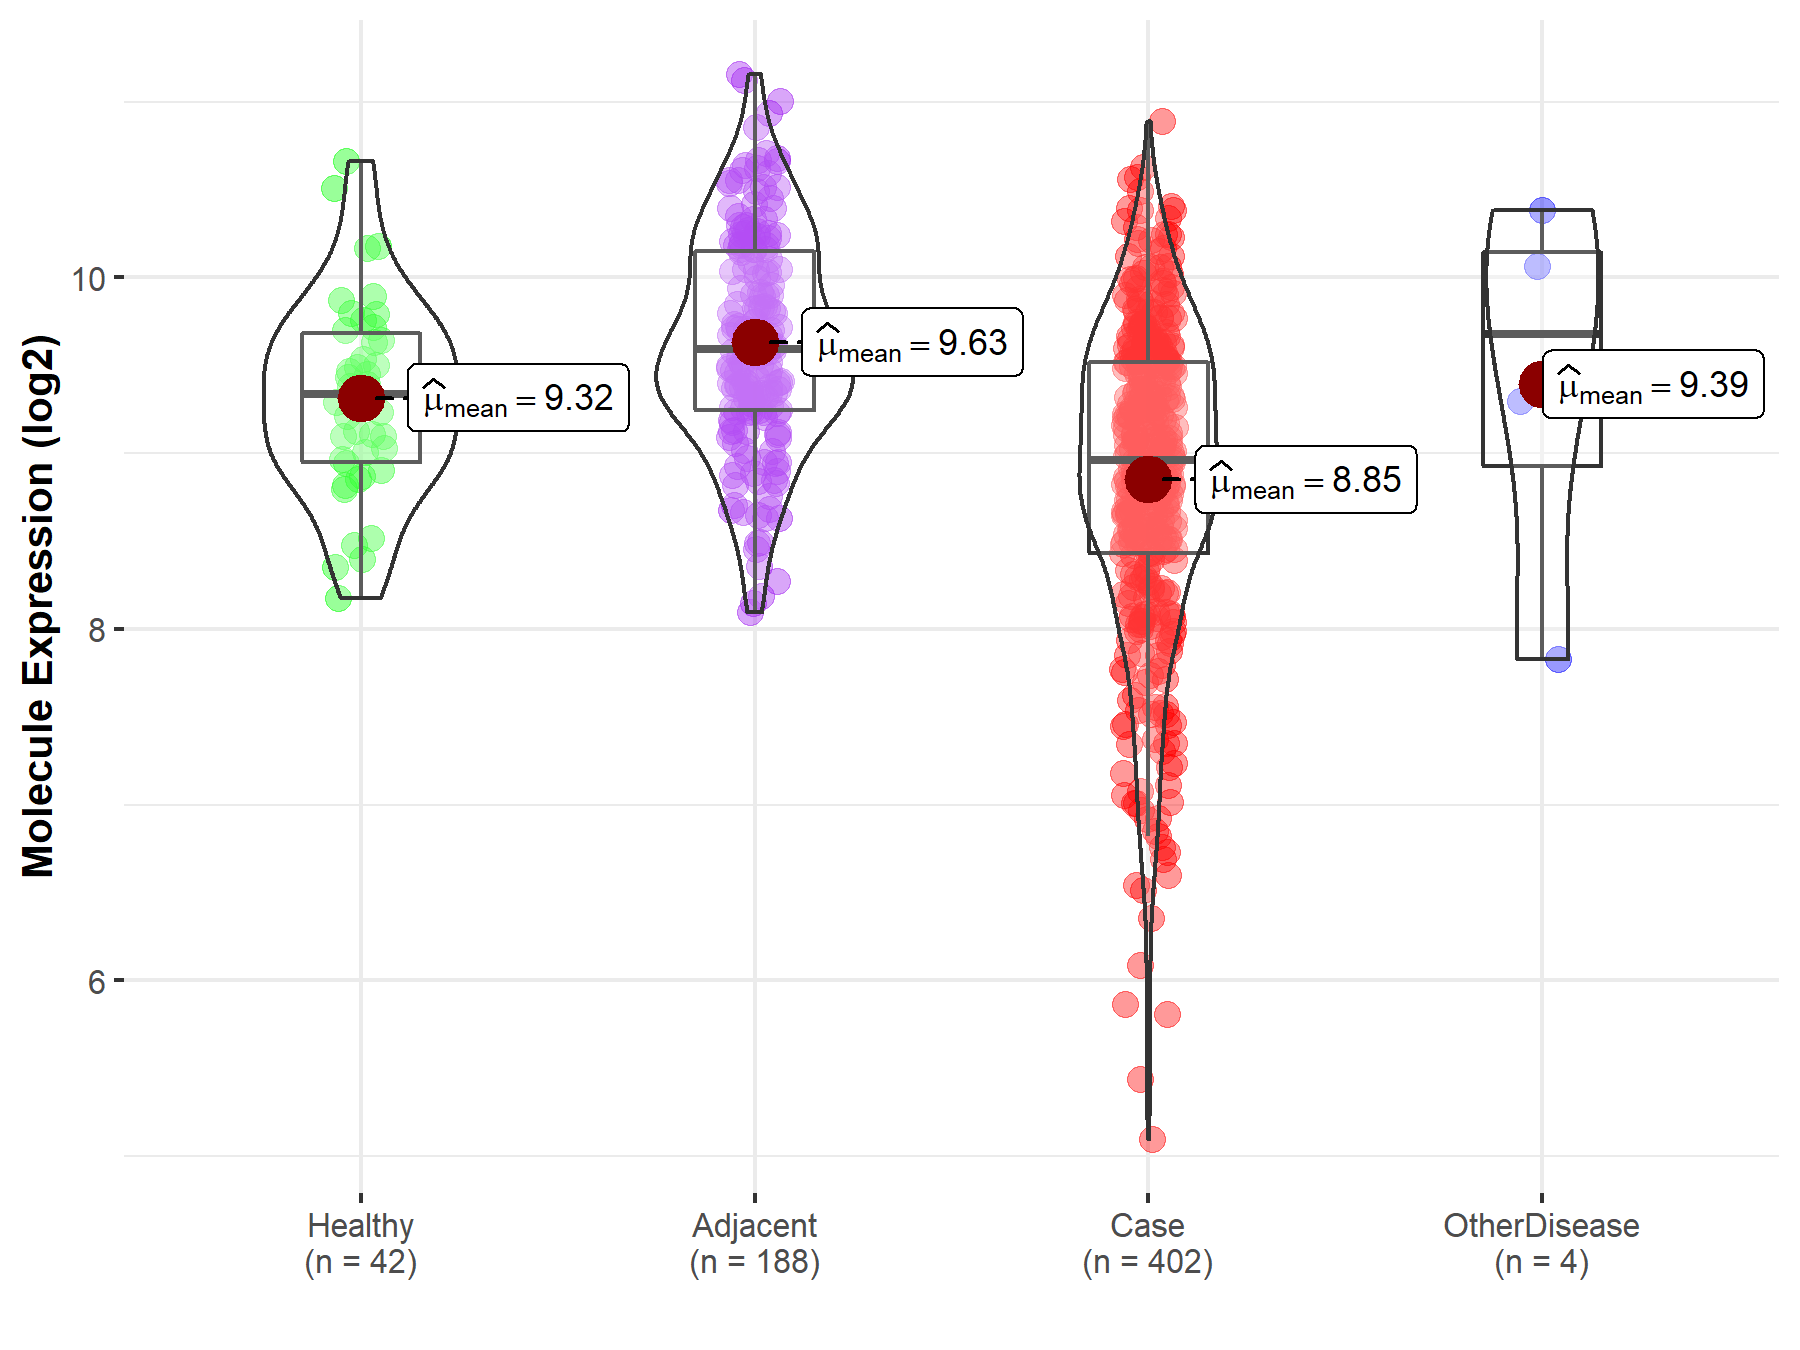
| The Studied Tissue | Liver | |
| The Specified Disease | Liver cancer | |
| The Expression Level of Disease Section Compare with the Healthy Individual Tissue | p-value: 1.13E-05; Fold-change: -3.79E-01; Z-score: -6.76E-01 | |
| The Expression Level of Disease Section Compare with the Adjacent Tissue | p-value: 6.02E-30; Fold-change: -6.32E-01; Z-score: -1.02E+00 | |
| The Expression Level of Disease Section Compare with the Other Disease Section | p-value: 4.12E-01; Fold-change: -7.21E-01; Z-score: -6.32E-01 | |
|
Molecule expression in the normal tissue adjacent to the diseased tissue of patients
Molecule expression in the diseased tissue of patients
Molecule expression in the normal tissue of healthy individuals
Molecule expression in tissue other than the diseased tissue of patients
|
||
| Disease-specific Molecule Abundances |
|
Click to View the Clearer Original Diagram |
| Differential expression of molecule in resistant diseases | ||
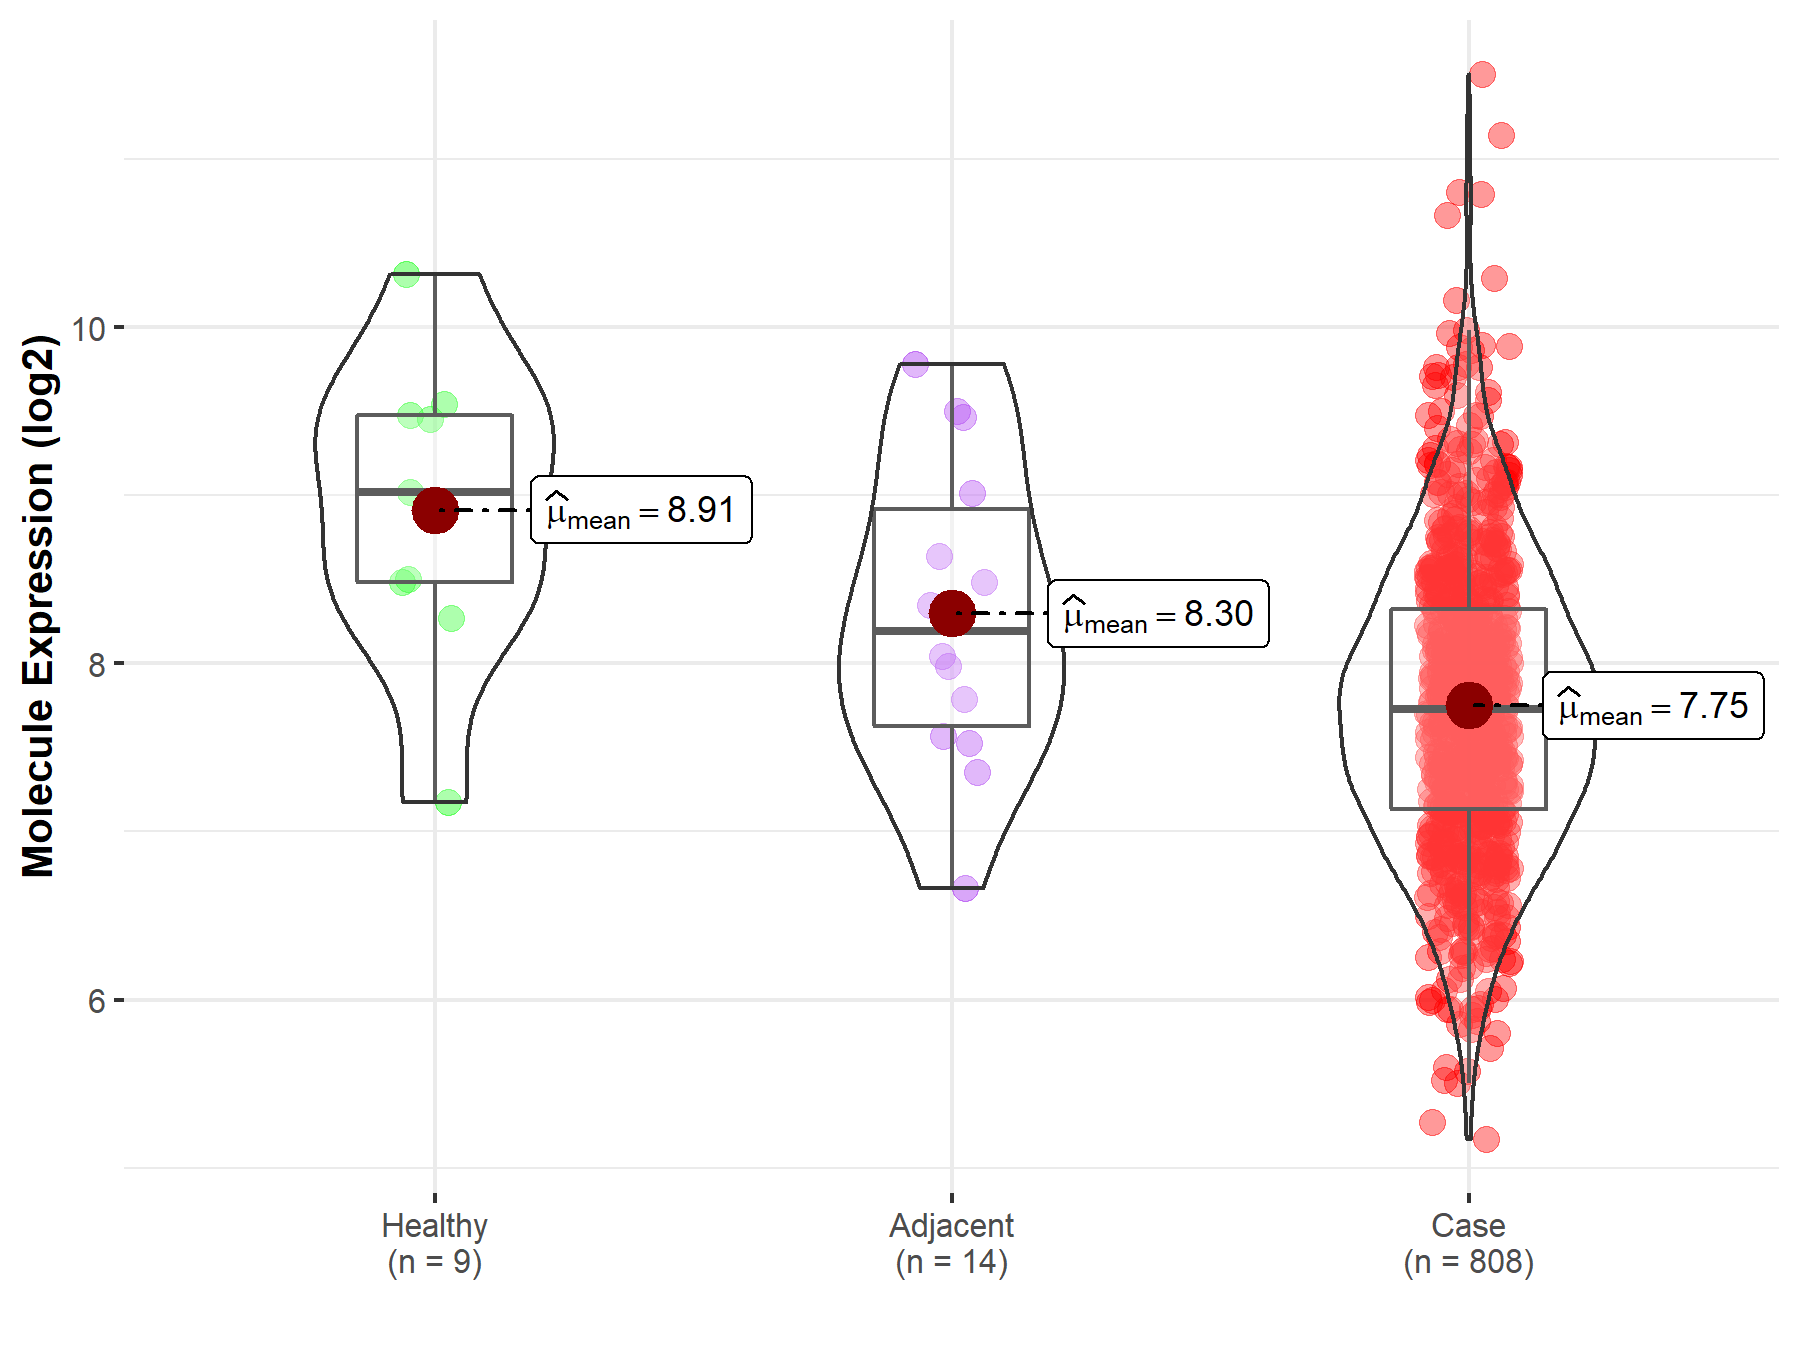
| The Studied Tissue | Ovary | |
| The Specified Disease | Ovarian cancer | |
| The Expression Level of Disease Section Compare with the Healthy Individual Tissue | p-value: 5.20E-03; Fold-change: -1.29E+00; Z-score: -1.40E+00 | |
| The Expression Level of Disease Section Compare with the Adjacent Tissue | p-value: 4.34E-02; Fold-change: -4.66E-01; Z-score: -5.11E-01 | |
|
Molecule expression in the normal tissue adjacent to the diseased tissue of patients
Molecule expression in the diseased tissue of patients
Molecule expression in the normal tissue of healthy individuals
|
||
| Disease-specific Molecule Abundances |
|
Click to View the Clearer Original Diagram |
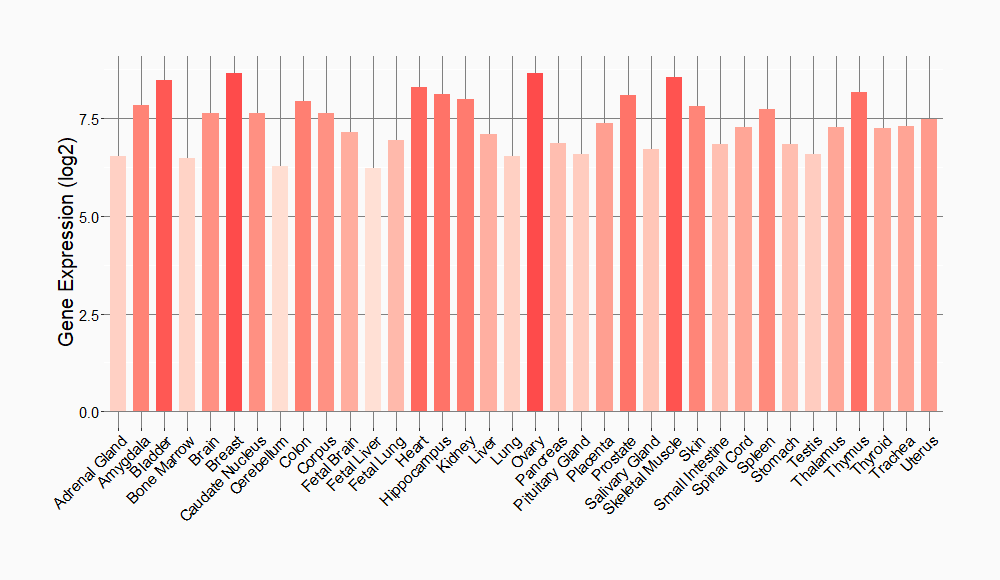
Tissue-specific Molecule Abundances in Healthy Individuals

|
||
References
If you find any error in data or bug in web service, please kindly report it to Dr. Sun and Dr. Yu.
