Molecule Information
General Information of the Molecule (ID: Mol00522)
| Name |
Unconventional myosin-X (MYO10)
,Homo sapiens
|
||||
|---|---|---|---|---|---|
| Synonyms |
Unconventional myosin-10; KIAA0799
Click to Show/Hide
|
||||
| Molecule Type |
Protein
|
||||
| Gene Name |
MYO10
|
||||
| Gene ID | |||||
| Location |
chr5:16661907-16936288[-]
|
||||
| Sequence |
MDNFFTEGTRVWLRENGQHFPSTVNSCAEGIVVFRTDYGQVFTYKQSTITHQKVTAMHPT
NEEGVDDMASLTELHGGSIMYNLFQRYKRNQIYTYIGSILASVNPYQPIAGLYEPATMEQ YSRRHLGELPPHIFAIANECYRCLWKRHDNQCILISGESGAGKTESTKLILKFLSVISQQ SLELSLKEKTSCVERAILESSPIMEAFGNAKTVYNNNSSRFGKFVQLNICQKGNIQGGRI VDYLLEKNRVVRQNPGERNYHIFYALLAGLEHEEREEFYLSTPENYHYLNQSGCVEDKTI SDQESFREVITAMDVMQFSKEEVREVSRLLAGILHLGNIEFITAGGAQVSFKTALGRSAE LLGLDPTQLTDALTQRSMFLRGEEILTPLNVQQAVDSRDSLAMALYACCFEWVIKKINSR IKGNEDFKSIGILDIFGFENFEVNHFEQFNINYANEKLQEYFNKHIFSLEQLEYSREGLV WEDIDWIDNGECLDLIEKKLGLLALINEESHFPQATDSTLLEKLHSQHANNHFYVKPRVA VNNFGVKHYAGEVQYDVRGILEKNRDTFRDDLLNLLRESRFDFIYDLFEHVSSRNNQDTL KCGSKHRRPTVSSQFKDSLHSLMATLSSSNPFFVRCIKPNMQKMPDQFDQAVVLNQLRYS GMLETVRIRKAGYAVRRPFQDFYKRYKVLMRNLALPEDVRGKCTSLLQLYDASNSEWQLG KTKVFLRESLEQKLEKRREEEVSHAAMVIRAHVLGFLARKQYRKVLYCVVIIQKNYRAFL LRRRFLHLKKAAIVFQKQLRGQIARRVYRQLLAEKREQEEKKKQEEEEKKKREEEERERE RERREAELRAQQEEETRKQQELEALQKSQKEAELTRELEKQKENKQVEEILRLEKEIEDL QRMKEQQELSLTEASLQKLQERRDQELRRLEEEACRAAQEFLESLNFDEIDECVRNIERS LSVGSEFSSELAESACEEKPNFNFSQPYPEEEVDEGFEADDDAFKDSPNPSEHGHSDQRT SGIRTSDDSSEEDPYMNDTVVPTSPSADSTVLLAPSVQDSGSLHNSSSGESTYCMPQNAG DLPSPDGDYDYDQDDYEDGAITSGSSVTFSNSYGSQWSPDYRCSVGTYNSSGAYRFSSEG AQSSFEDSEEDFDSRFDTDDELSYRRDSVYSCVTLPYFHSFLYMKGGLMNSWKRRWCVLK DETFLWFRSKQEALKQGWLHKKGGGSSTLSRRNWKKRWFVLRQSKLMYFENDSEEKLKGT VEVRTAKEIIDNTTKENGIDIIMADRTFHLIAESPEDASQWFSVLSQVHASTDQEIQEMH DEQANPQNAVGTLDVGLIDSVCASDSPDRPNSFVIITANRVLHCNADTPEEMHHWITLLQ RSKGDTRVEGQEFIVRGWLHKEVKNSPKMSSLKLKKRWFVLTHNSLDYYKSSEKNALKLG TLVLNSLCSVVPPDEKIFKETGYWNVTVYGRKHCYRLYTKLLNEATRWSSAIQNVTDTKA PIDTPTQQLIQDIKENCLNSDVVEQIYKRNPILRYTHHPLHSPLLPLPYGDINLNLLKDK GYTTLQDEAIKIFNSLQQLESMSDPIPIIQGILQTGHDLRPLRDELYCQLIKQTNKVPHP GSVGNLYSWQILTCLSCTFLPSRGILKYLKFHLKRIREQFPGSEMEKYALFTYESLKKTK CREFVPSRDEIEALIHRQEMTSTVYCHGGGSCKITINSHTTAGEVVEKLIRGLAMEDSRN MFALFEYNGHVDKAIESRTVVADVLAKFEKLAATSEVGDLPWKFYFKLYCFLDTDNVPKD SVEFAFMFEQAHEAVIHGHHPAPEENLQVLAALRLQYLQGDYTLHAAIPPLEEVYSLQRL KARISQSTKTFTPCERLEKRRTSFLEGTLRRSFRTGSVVRQKVEEEQMLDMWIKEEVSSA RASIIDKWRKFQGMNQEQAMAKYMALIKEWPGYGSTLFDVECKEGGFPQELWLGVSADAV SVYKRGEGRPLEVFQYEHILSFGAPLANTYKIVVDERELLFETSEVVDVAKLMKAYISMI VKKRYSTTRSASSQGSSR Click to Show/Hide
|
||||
| 3D-structure |
|
||||
| Function |
Myosins are actin-based motor molecules with ATPase activity. Unconventional myosins serve in intracellular movements. MYO10 binds to actin filaments and actin bundles and functions as a plus end-directed motor. Moves with higher velocity and takes larger steps on actin bundles than on single actin filaments. The tail domain binds to membranous compartments containing phosphatidylinositol 3,4,5-trisphosphate or integrins, and mediates cargo transport along actin filaments. Regulates cell shape, cell spreading and cell adhesion. Stimulates the formation and elongation of filopodia. In hippocampal neurons it induces the formation of dendritic filopodia by trafficking the actin-remodeling protein VASP to the tips of filopodia, where it promotes actin elongation. Plays a role in formation of the podosome belt in osteoclasts.
Click to Show/Hide
|
||||
| Uniprot ID | |||||
| Ensembl ID | |||||
| HGNC ID | |||||
| Click to Show/Hide the Complete Species Lineage | |||||
Type(s) of Resistant Mechanism of This Molecule
Drug Resistance Data Categorized by Drug
Approved Drug(s)
1 drug(s) in total
| Drug Sensitivity Data Categorized by Their Corresponding Mechanisms | ||||
|
|
||||
| Disease Class: Neuroblastoma [ICD-11: 2A00.11] | [1] | |||
| Sensitive Disease | Neuroblastoma [ICD-11: 2A00.11] | |||
| Sensitive Drug | Cyclophosphamide | |||
| Molecule Alteration | Expression | Down-regulation |
||
| Differential expression of the molecule in resistant disease | ||||
| Classification of Disease | Brain cancer [ICD-11: 2A00] | |||
| The Specified Disease | Glioma | |||
| The Studied Tissue | Brainstem tissue | |||
| The Expression Level of Disease Section Compare with the Healthy Individual Tissue | p-value: 4.95E-01 Fold-change: -1.90E-01 Z-score: -1.00E+00 |
|||
| Experimental Note | Revealed Based on the Cell Line Data | |||
| Cell Pathway Regulation | Cell colony | Inhibition | hsa05200 | |
| Cell proliferation | Inhibition | hsa05200 | ||
| In Vitro Model | IMR-32 cells | Abdomen | Homo sapiens (Human) | CVCL_0346 |
| BE-M17 cells | Adrenal | Homo sapiens (Human) | N.A. | |
| Kelly cells | Adrenal | Homo sapiens (Human) | CVCL_2092 | |
| NB-1643 cells | Adrenal | Homo sapiens (Human) | CVCL_5627 | |
| NB1 cells | Adrenal | Homo sapiens (Human) | CVCL_1440 | |
| NBSD cells | Adrenal | Homo sapiens (Human) | CVCL_LF68 | |
| Neuro-2a cells | Adrenal | Homo sapiens (Human) | CVCL_0470 | |
| Sk-N-AS cells | Adrenal | Homo sapiens (Human) | CVCL_1700 | |
| Sk-N-SH cells | Adrenal | Homo sapiens (Human) | CVCL_0531 | |
| Sk-SY-5Y cells | Adrenal | Homo sapiens (Human) | N.A. | |
| In Vivo Model | Nude mouse xenograft model | Mus musculus | ||
| Experiment for Molecule Alteration |
Western blot analysis; RIP assay; Luciferase reporter assay | |||
| Experiment for Drug Resistance |
MTS assay | |||
| Mechanism Description | miR-129 suppressed cell growth and potentiated chemosensitivity by inhibiting MYO10. | |||
Disease- and Tissue-specific Abundances of This Molecule
ICD Disease Classification 02

| Differential expression of molecule in resistant diseases | ||
| The Studied Tissue | Nervous tissue | |
| The Specified Disease | Brain cancer | |
| The Expression Level of Disease Section Compare with the Healthy Individual Tissue | p-value: 3.36E-79; Fold-change: 5.18E-01; Z-score: 1.27E+00 | |
|
Molecule expression in the diseased tissue of patients
Molecule expression in the normal tissue of healthy individuals
|
||
| Disease-specific Molecule Abundances |

|
Click to View the Clearer Original Diagram |
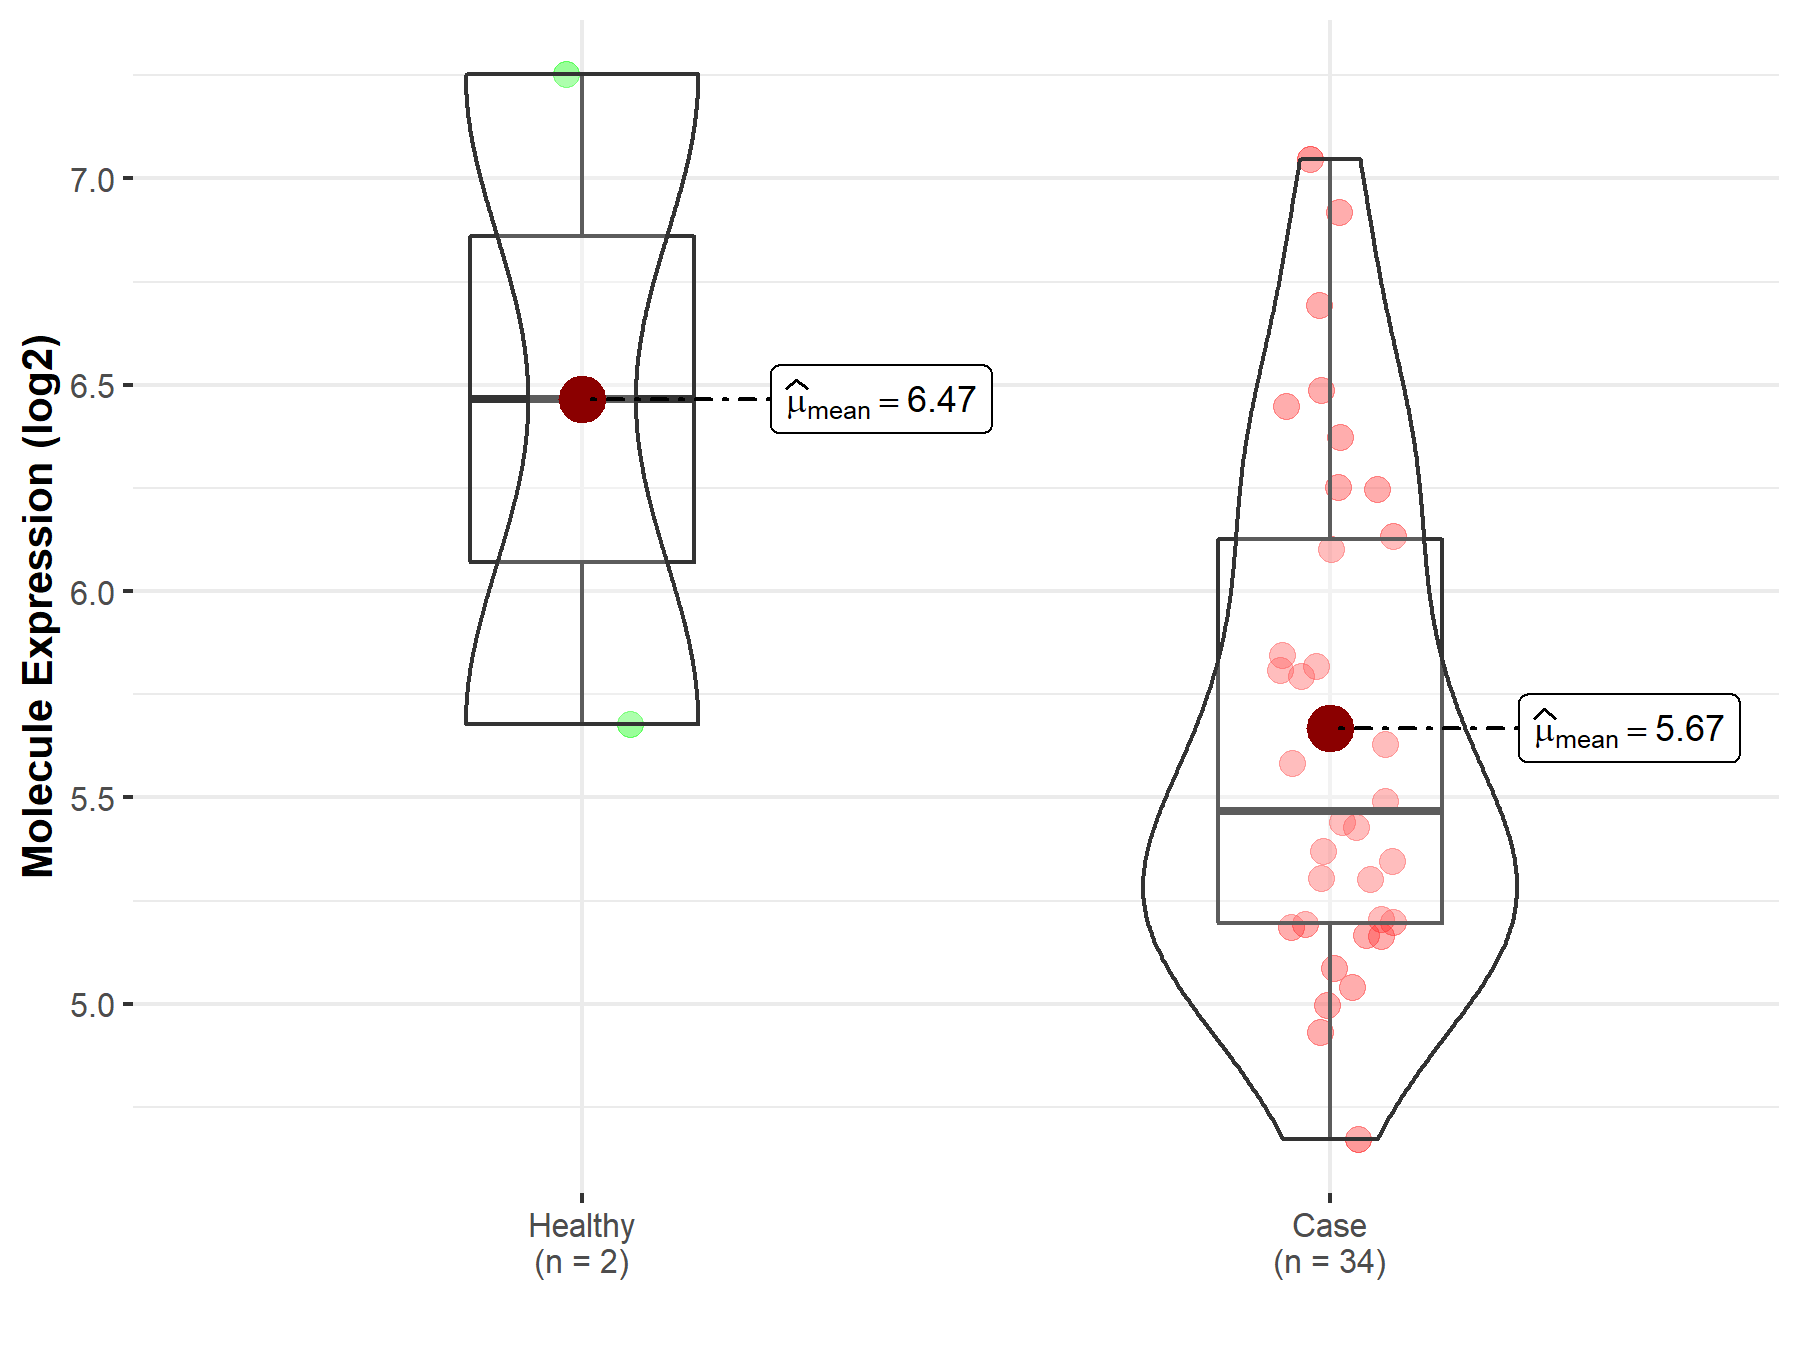
| The Studied Tissue | Brainstem tissue | |
| The Specified Disease | Glioma | |
| The Expression Level of Disease Section Compare with the Healthy Individual Tissue | p-value: 4.95E-01; Fold-change: -9.99E-01; Z-score: -8.96E-01 | |
|
Molecule expression in the diseased tissue of patients
Molecule expression in the normal tissue of healthy individuals
|
||
| Disease-specific Molecule Abundances |

|
Click to View the Clearer Original Diagram |
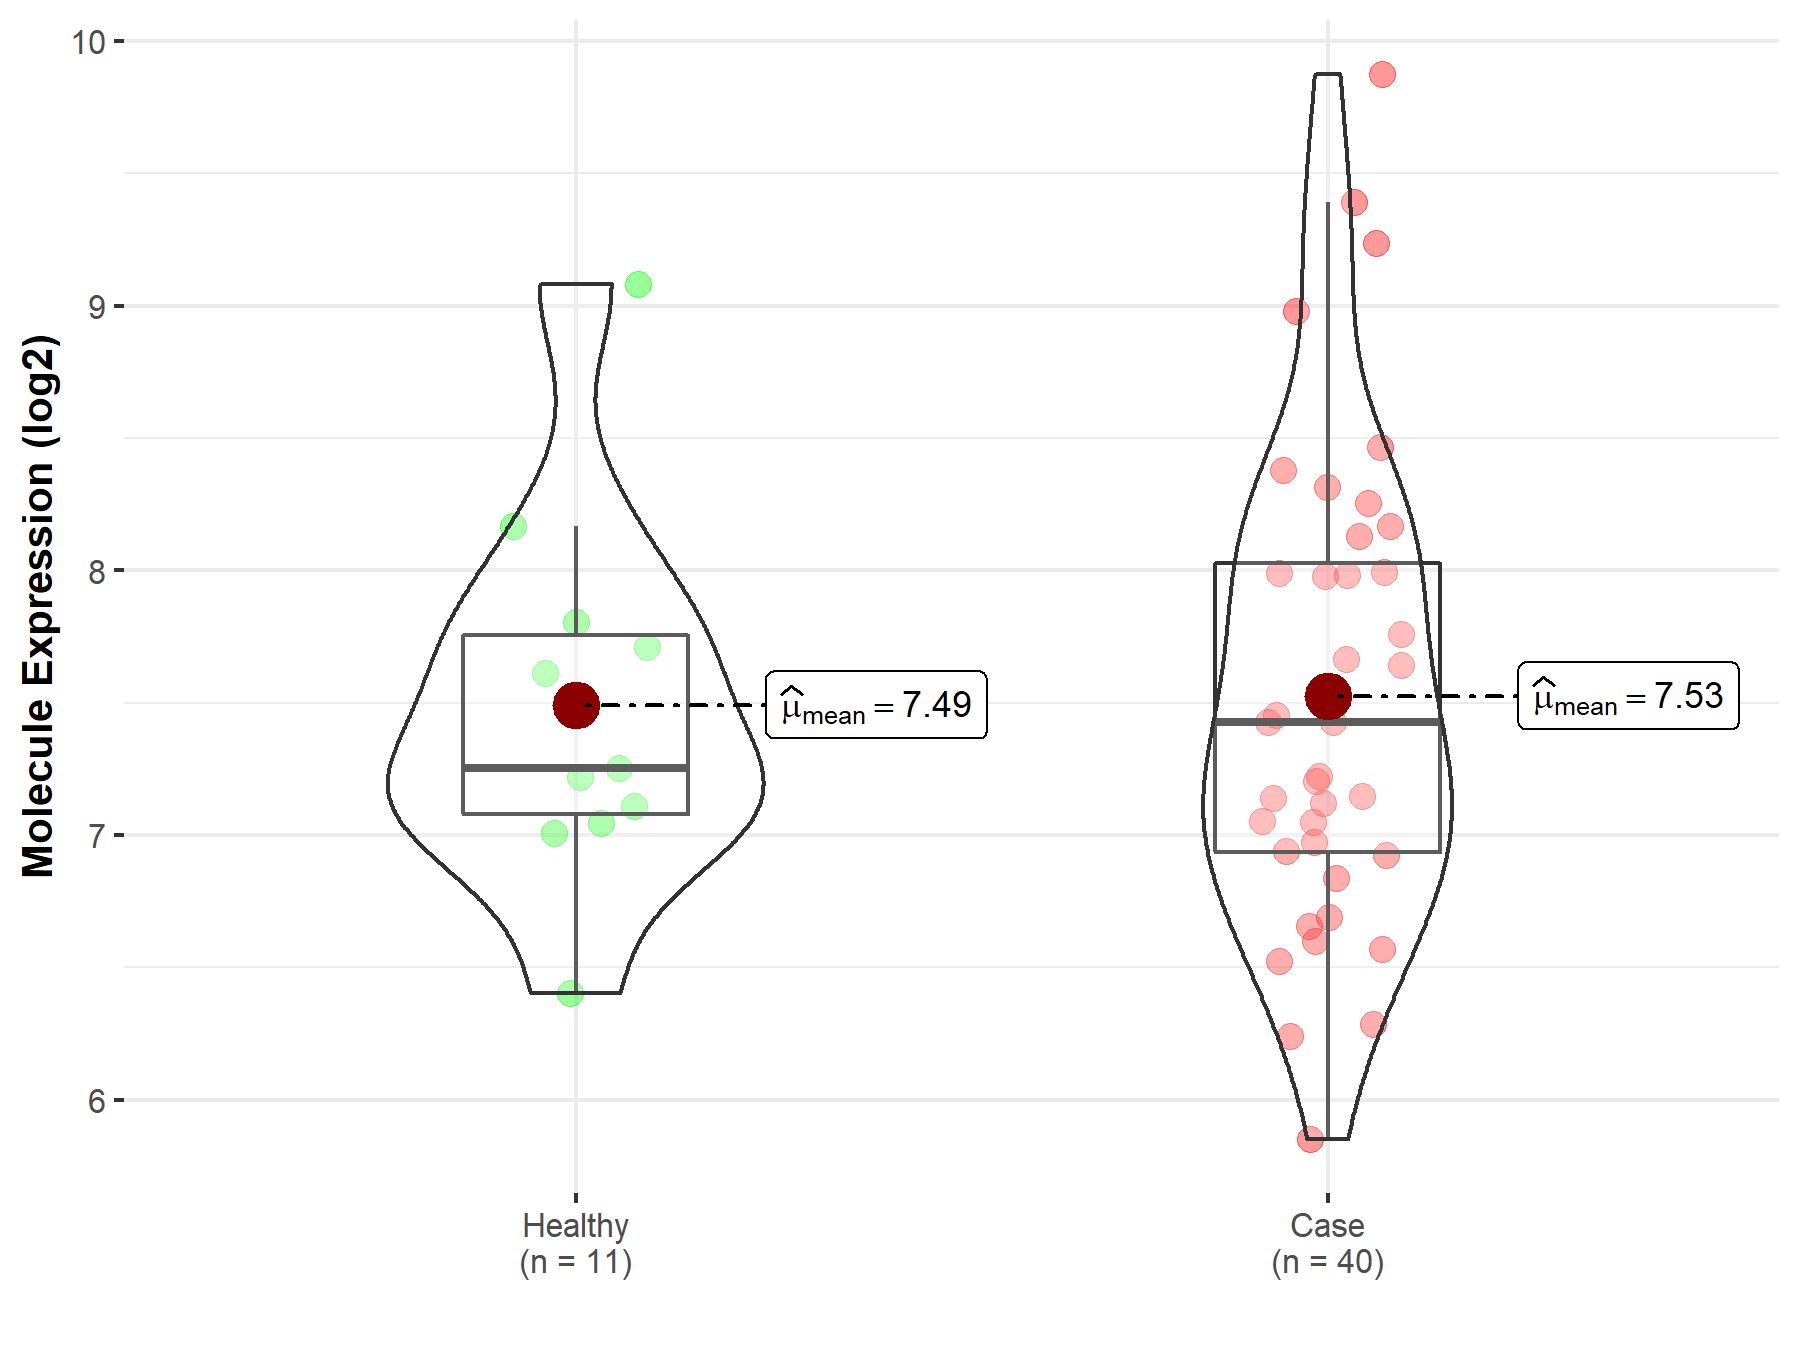
| The Studied Tissue | White matter | |
| The Specified Disease | Glioma | |
| The Expression Level of Disease Section Compare with the Healthy Individual Tissue | p-value: 8.94E-01; Fold-change: 1.75E-01; Z-score: 2.46E-01 | |
|
Molecule expression in the diseased tissue of patients
Molecule expression in the normal tissue of healthy individuals
|
||
| Disease-specific Molecule Abundances |

|
Click to View the Clearer Original Diagram |
| The Studied Tissue | Brainstem tissue | |
| The Specified Disease | Neuroectodermal tumor | |
| The Expression Level of Disease Section Compare with the Healthy Individual Tissue | p-value: 2.06E-06; Fold-change: 1.06E+00; Z-score: 3.02E+00 | |
|
Molecule expression in the diseased tissue of patients
Molecule expression in the normal tissue of healthy individuals
|
||
| Disease-specific Molecule Abundances |

|
Click to View the Clearer Original Diagram |
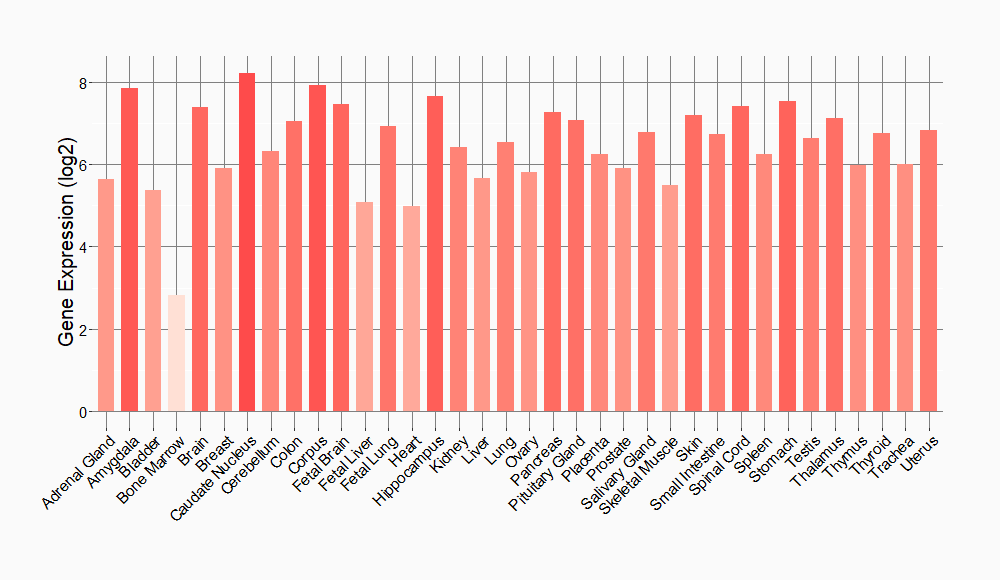
Tissue-specific Molecule Abundances in Healthy Individuals


|
||
References
If you find any error in data or bug in web service, please kindly report it to Dr. Sun and Dr. Yu.
