Molecule Information
General Information of the Molecule (ID: Mol00469)
| Name |
Solute carrier family 7 member 5 (SLC7A5)
,Homo sapiens
|
||||
|---|---|---|---|---|---|
| Synonyms |
4F2 light chain; 4F2 LC; 4F2LC; CD98 light chain; Integral membrane protein E16; E16; L-type amino acid transporter 1; hLAT1; Solute carrier family 7 member 5; y+ system cationic amino acid transporter; CD98LC; LAT1; MPE16
Click to Show/Hide
|
||||
| Molecule Type |
Protein
|
||||
| Gene Name |
SLC7A5
|
||||
| Gene ID | |||||
| Location |
chr16:87830023-87869507[-]
|
||||
| Sequence |
MAGAGPKRRALAAPAAEEKEEAREKMLAAKSADGSAPAGEGEGVTLQRNITLLNGVAIIV
GTIIGSGIFVTPTGVLKEAGSPGLALVVWAACGVFSIVGALCYAELGTTISKSGGDYAYM LEVYGSLPAFLKLWIELLIIRPSSQYIVALVFATYLLKPLFPTCPVPEEAAKLVACLCVL LLTAVNCYSVKAATRVQDAFAAAKLLALALIILLGFVQIGKGDVSNLDPNFSFEGTKLDV GNIVLALYSGLFAYGGWNYLNFVTEEMINPYRNLPLAIIISLPIVTLVYVLTNLAYFTTL STEQMLSSEAVAVDFGNYHLGVMSWIIPVFVGLSCFGSVNGSLFTSSRLFFVGSREGHLP SILSMIHPQLLTPVPSLVFTCVMTLLYAFSKDIFSVINFFSFFNWLCVALAIIGMIWLRH RKPELERPIKVNLALPVFFILACLFLIAVSFWKTPVECGIGFTIILSGLPVYFFGVWWKN KPKWLLQGIFSTTVLCQKLMQVVPQET Click to Show/Hide
|
||||
| 3D-structure |
|
||||
| Function |
The heterodimer with SLC3A2 functions as sodium-independent, high-affinity transporter that mediates uptake of large neutral amino acids such as phenylalanine, tyrosine, L-DOPA, leucine, histidine, methionine and tryptophan. Functions as an amino acid exchanger. May play a role in the transport of L-DOPA across the blood-brain barrier. May act as the major transporter of tyrosine in fibroblasts (Probable). May mediate blood-to-retina L-leucine transport across the inner blood-retinal barrier. Can mediate the transport of thyroid hormones triiodothyronine (T3) and thyroxine (T4) across the cell membrane. When associated with LAPTM4B, the heterodimer formed by SLC3A2 and SLC7A5 is recruited to lysosomes to promote leucine uptake into these organelles, and thereby mediates mTORC1 activation. Involved in the uptake of toxic methylmercury (MeHg) when administered as the L-cysteine or D,L-homocysteine complexes. Involved in the cellular activity of small molecular weight nitrosothiols, via the stereoselective transport of L-nitrosocysteine (L-CNSO) across the membrane.
Click to Show/Hide
|
||||
| Uniprot ID | |||||
| Ensembl ID | |||||
| HGNC ID | |||||
| Click to Show/Hide the Complete Species Lineage | |||||
Type(s) of Resistant Mechanism of This Molecule
Drug Resistance Data Categorized by Drug
Approved Drug(s)
1 drug(s) in total
| Drug Resistance Data Categorized by Their Corresponding Mechanisms | ||||
|
|
||||
| Disease Class: Colon cancer [ICD-11: 2B90.1] | [1] | |||
| Resistant Disease | Colon cancer [ICD-11: 2B90.1] | |||
| Resistant Drug | Oxaliplatin | |||
| Molecule Alteration | Expression | Down-regulation |
||
| Experimental Note | Identified from the Human Clinical Data | |||
| Cell Pathway Regulation | Cell apoptosis | Activation | hsa04210 | |
| Cell invasion | Inhibition | hsa05200 | ||
| Cell migration | Inhibition | hsa04670 | ||
| Cell proliferation | Inhibition | hsa05200 | ||
| In Vitro Model | SW480 cells | Colon | Homo sapiens (Human) | CVCL_0546 |
| 293T cells | Breast | Homo sapiens (Human) | CVCL_0063 | |
| Experiment for Molecule Alteration |
Western blot analysis | |||
| Experiment for Drug Resistance |
MTT assay | |||
| Mechanism Description | Over-expression of miR-126 in colon cancer cell was able to inhibit cell proliferation, promote cell apoptosis and reduce the invasive ability. miR-126 significantly enhanced the sensitivity of the colon cancer cell to chemotherapeutic drug. It has been shown that IRS1, SLC75A and TOM1 were the potential target genes of miR-126 in colon cancer. | |||
Disease- and Tissue-specific Abundances of This Molecule
ICD Disease Classification 02

| Differential expression of molecule in resistant diseases | ||
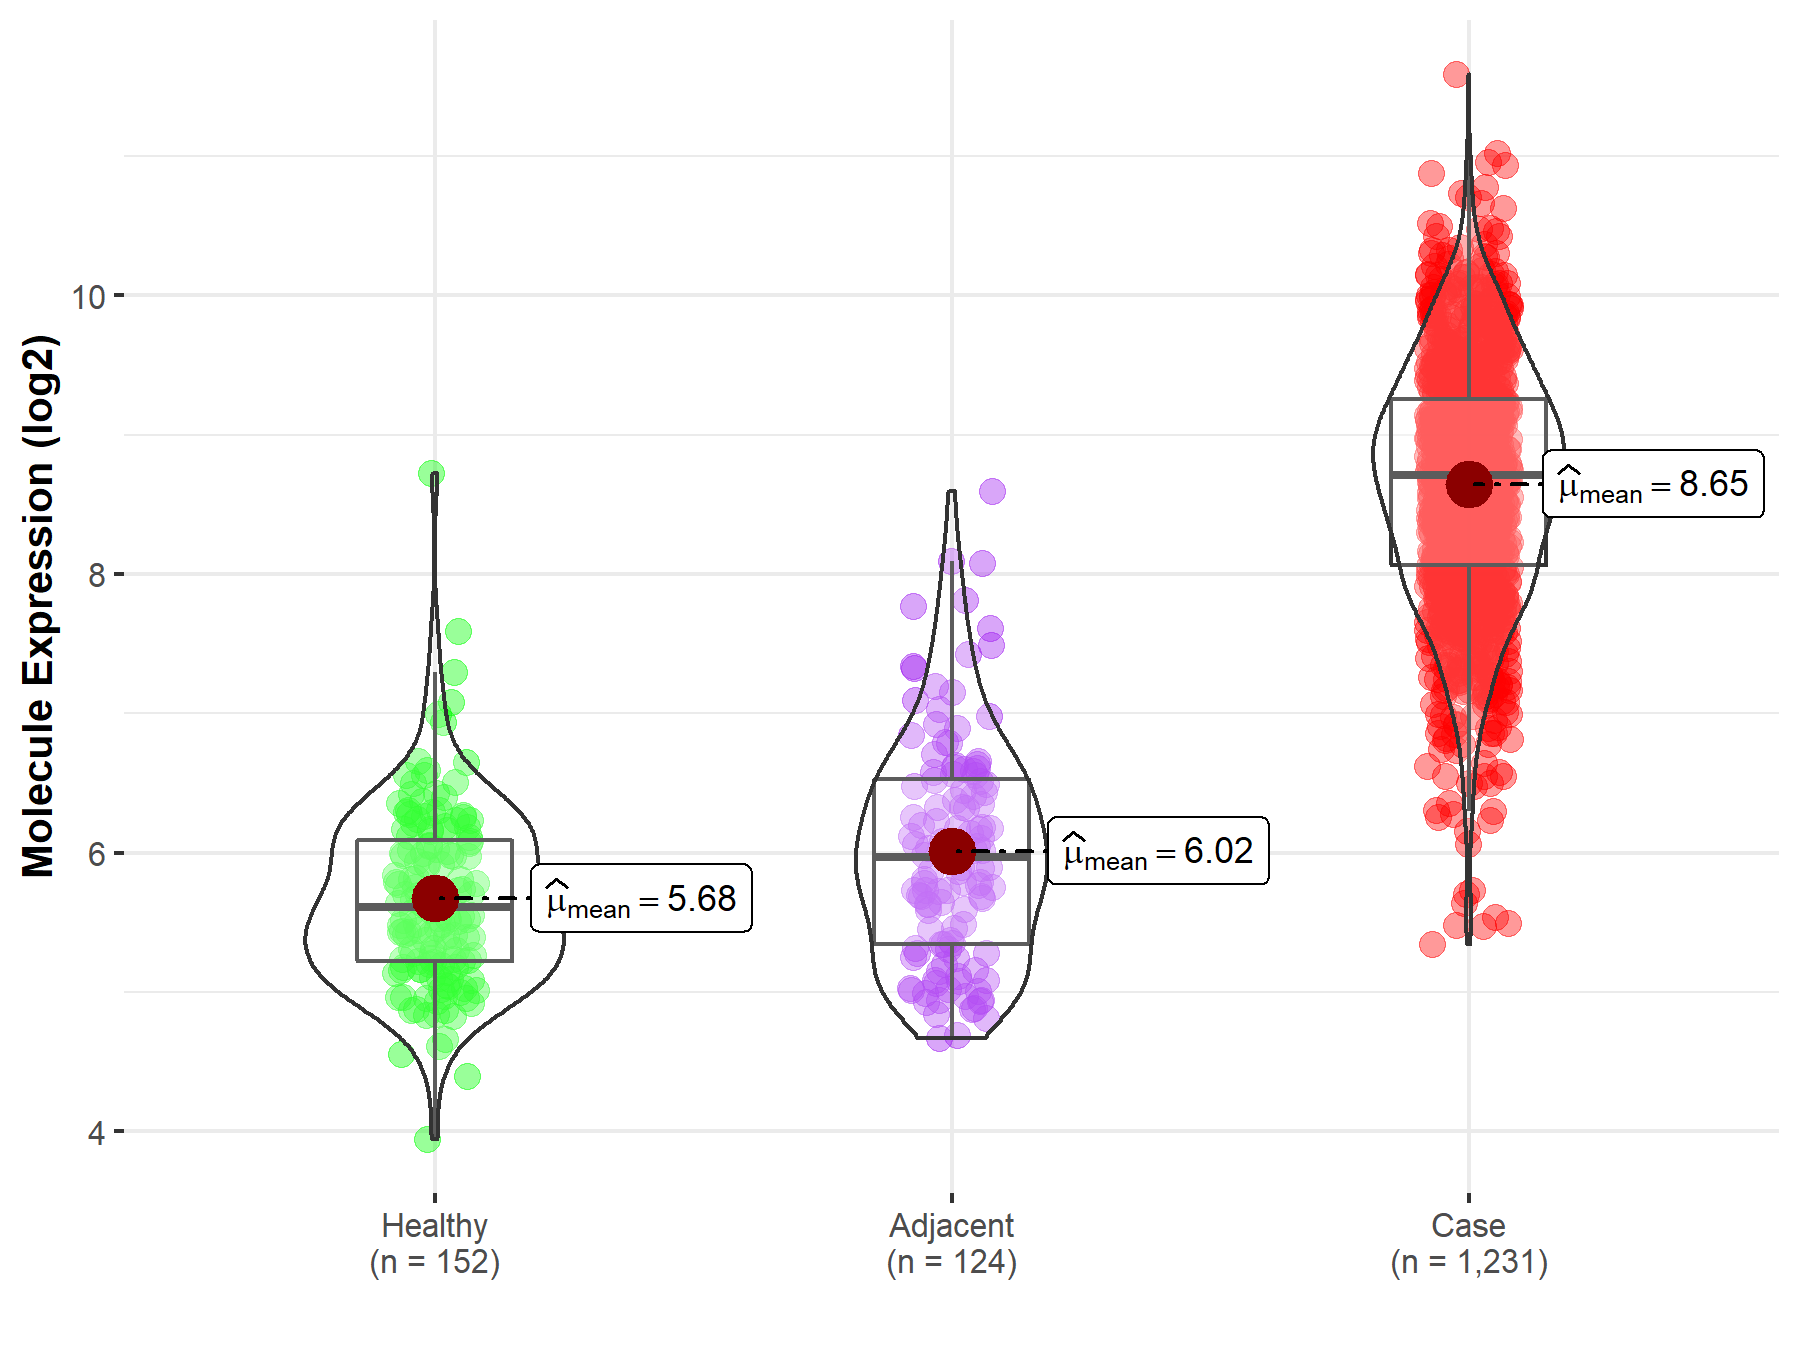
| The Studied Tissue | Colon | |
| The Specified Disease | Colon cancer | |
| The Expression Level of Disease Section Compare with the Healthy Individual Tissue | p-value: 2.89E-127; Fold-change: 3.10E+00; Z-score: 4.82E+00 | |
| The Expression Level of Disease Section Compare with the Adjacent Tissue | p-value: 1.28E-73; Fold-change: 2.75E+00; Z-score: 3.38E+00 | |
|
Molecule expression in the normal tissue adjacent to the diseased tissue of patients
Molecule expression in the diseased tissue of patients
Molecule expression in the normal tissue of healthy individuals
|
||
| Disease-specific Molecule Abundances |

|
Click to View the Clearer Original Diagram |
Tissue-specific Molecule Abundances in Healthy Individuals


|
||
References
If you find any error in data or bug in web service, please kindly report it to Dr. Sun and Dr. Yu.
