Molecule Information
General Information of the Molecule (ID: Mol00453)
| Name |
NF-kappa-B inhibitor-interacting Ras-like protein 2 (NKIRAS2)
,Homo sapiens
|
||||
|---|---|---|---|---|---|
| Synonyms |
I-kappa-B-interacting Ras-like protein 2; Kappa B-Ras protein 2; KappaB-Ras2; KBRAS2
Click to Show/Hide
|
||||
| Molecule Type |
Protein
|
||||
| Gene Name |
NKIRAS2
|
||||
| Gene ID | |||||
| Location |
chr17:42011382-42025644[+]
|
||||
| Sequence |
MGKSCKVVVCGQASVGKTSILEQLLYGNHVVGSEMIETQEDIYVGSIETDRGVREQVRFY
DTRGLRDGAELPRHCFSCTDGYVLVYSTDSRESFQRVELLKKEIDKSKDKKEVTIVVLGN KCDLQEQRRVDPDVAQHWAKSEKVKLWEVSVADRRSLLEPFVYLASKMTQPQSKSAFPLS RKNKGSGSLDG Click to Show/Hide
|
||||
| Function |
Atypical Ras-like protein that acts as a potent regulator of NF-kappa-B activity by preventing the degradation of NF-kappa-B inhibitor beta (NFKBIB) by most signals, explaining why NFKBIB is more resistant to degradation. May act by blocking phosphorylation of NFKBIB and nuclear localization of p65/RELA NF-kappa-B subunit. It is unclear whether it acts as a GTPase. Both GTP- and GDP-bound forms block phosphorylation of NFKBIB (By similarity).
Click to Show/Hide
|
||||
| Uniprot ID | |||||
| Ensembl ID | |||||
| HGNC ID | |||||
| Click to Show/Hide the Complete Species Lineage | |||||
Type(s) of Resistant Mechanism of This Molecule
Drug Resistance Data Categorized by Drug
Approved Drug(s)
1 drug(s) in total
| Drug Sensitivity Data Categorized by Their Corresponding Mechanisms | ||||
|
|
||||
| Disease Class: Glioblastoma [ICD-11: 2A00.02] | [1] | |||
| Sensitive Disease | Glioblastoma [ICD-11: 2A00.02] | |||
| Sensitive Drug | Temozolomide | |||
| Molecule Alteration | Expression | Down-regulation |
||
| Experimental Note | Revealed Based on the Cell Line Data | |||
| Cell Pathway Regulation | Cell apoptosis | Activation | hsa04210 | |
| Cell proliferation | Inhibition | hsa05200 | ||
| NF-kappaB signaling pathway | Inhibition | hsa04064 | ||
| In Vitro Model | U251 cells | Brain | Homo sapiens (Human) | CVCL_0021 |
| LN-18 cells | Brain | Homo sapiens (Human) | CVCL_0392 | |
| T98G cells | Brain | Homo sapiens (Human) | CVCL_0556 | |
| U87-MG cells | Brain | Homo sapiens (Human) | CVCL_0022 | |
| HS683 cells | Brain | Homo sapiens (Human) | CVCL_0844 | |
| Experiment for Molecule Alteration |
Western blot analysis | |||
| Experiment for Drug Resistance |
Promega assay | |||
| Mechanism Description | A novel mechanism independent of TP53 and MGMT by which oncogenic miR-125b confers TMZ resistance by targeting TNFAIP3 and NkIRAS2. GBM cells overexpressing miR-125b showed increased NF-kB activity and upregulation of anti-apoptotic and cell cycle genes. This was significantly associated with resistance of GBM cells to TNFalpha- and TNF-related inducing ligand-induced apoptosis as well as resistance to TMZ. Conversely, overexpression of anti-miR-125b resulted in cell cycle arrest, increased apoptosis and increased sensitivity to TMZ, indicating that endogenous miR-125b is sufficient to control these processes. GBM cells overexpressing TNFAIP3 and NkIRAS2 were refractory to miR-125b-induced apoptosis resistance as well as TMZ resistance, indicating that both genes are relevant targets of miR-125b. | |||
Disease- and Tissue-specific Abundances of This Molecule
ICD Disease Classification 02

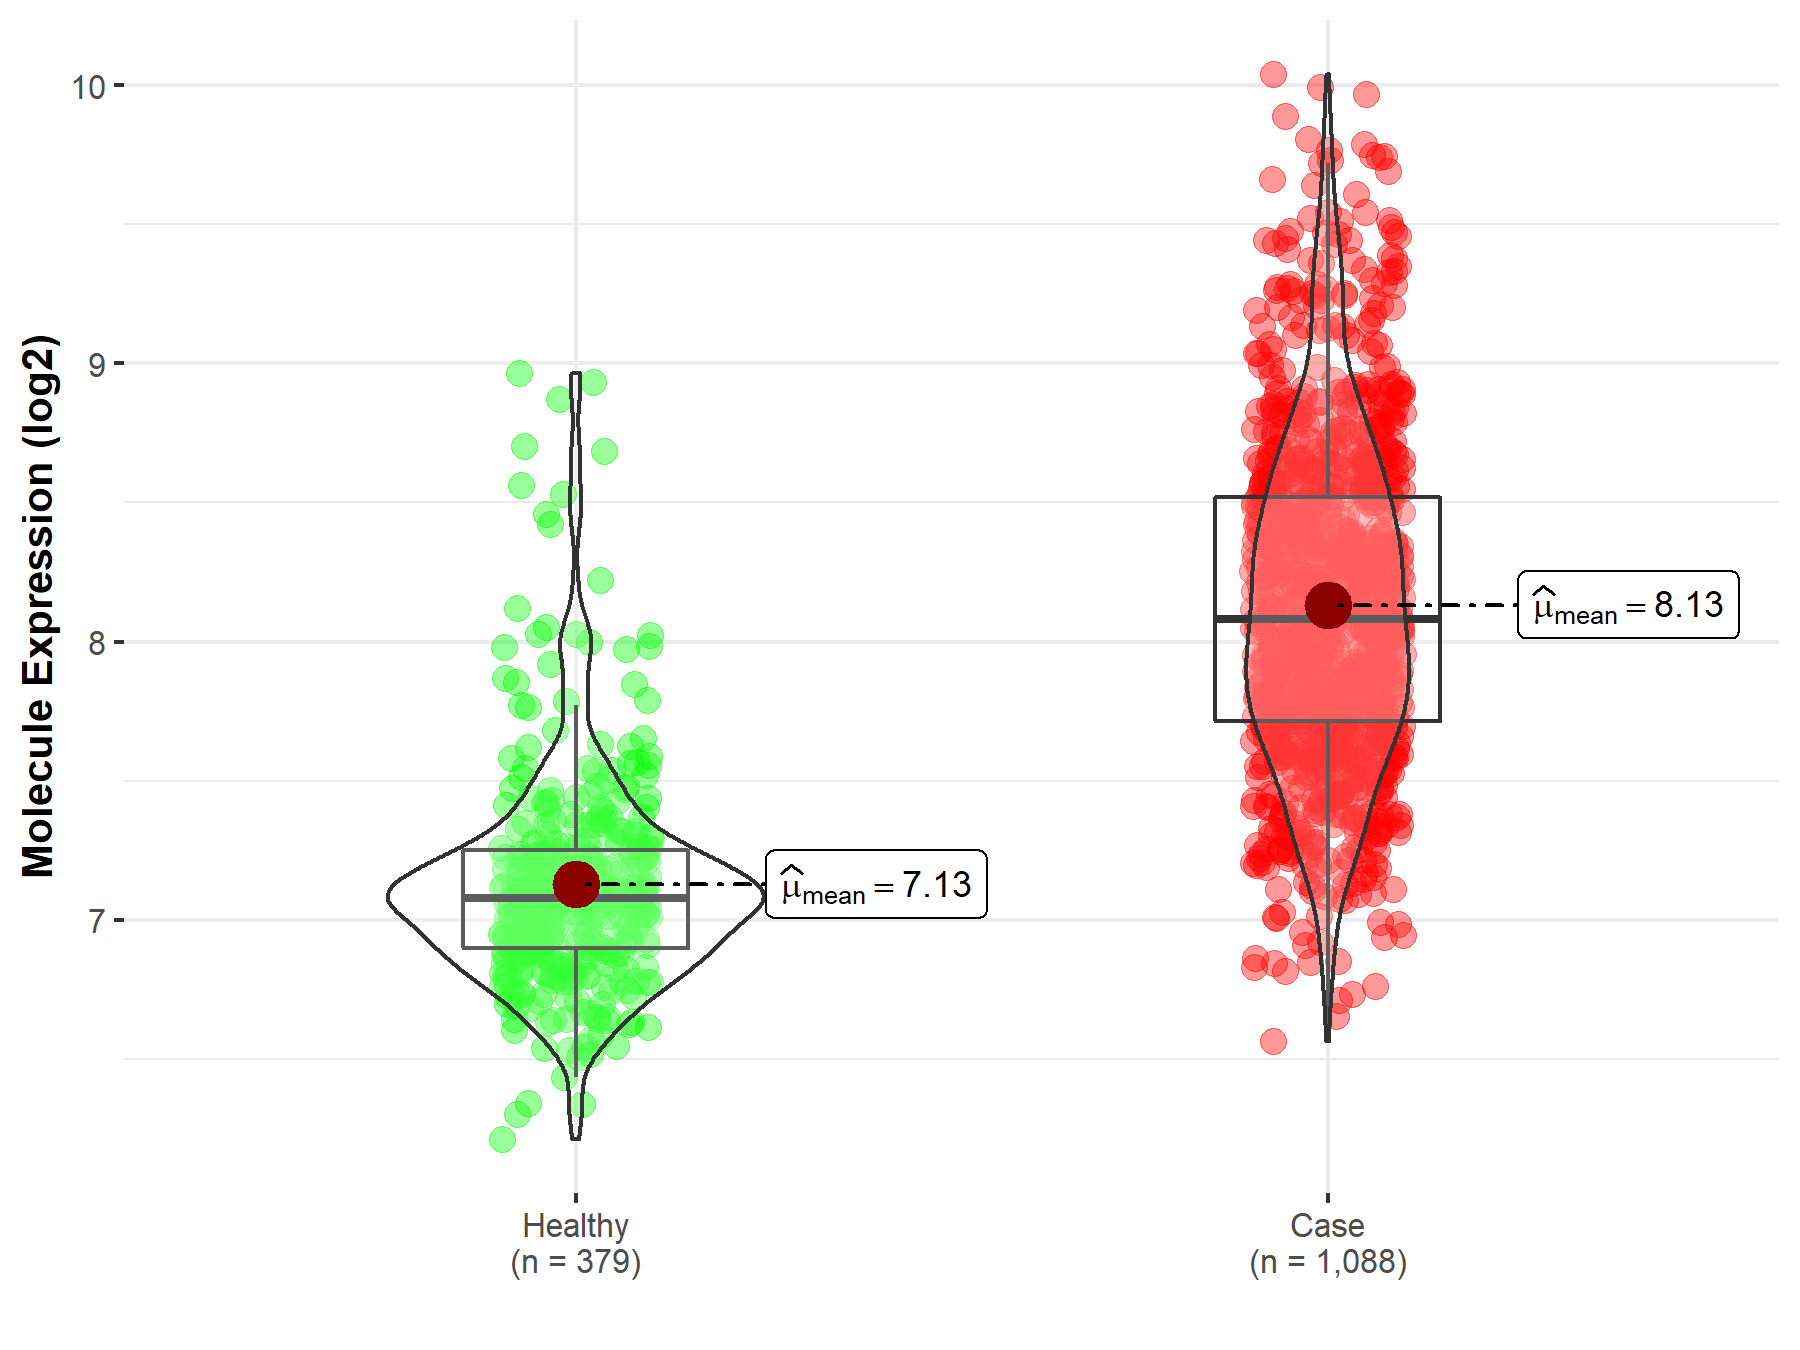
| Differential expression of molecule in resistant diseases | ||
| The Studied Tissue | Nervous tissue | |
| The Specified Disease | Brain cancer | |
| The Expression Level of Disease Section Compare with the Healthy Individual Tissue | p-value: 5.24E-188; Fold-change: 1.00E+00; Z-score: 2.53E+00 | |
|
Molecule expression in the diseased tissue of patients
Molecule expression in the normal tissue of healthy individuals
|
||
| Disease-specific Molecule Abundances |

|
Click to View the Clearer Original Diagram |
| The Studied Tissue | Brainstem tissue | |
| The Specified Disease | Glioma | |
| The Expression Level of Disease Section Compare with the Healthy Individual Tissue | p-value: 6.43E-01; Fold-change: 1.72E-01; Z-score: 4.31E-01 | |
|
Molecule expression in the diseased tissue of patients
Molecule expression in the normal tissue of healthy individuals
|
||
| Disease-specific Molecule Abundances |

|
Click to View the Clearer Original Diagram |
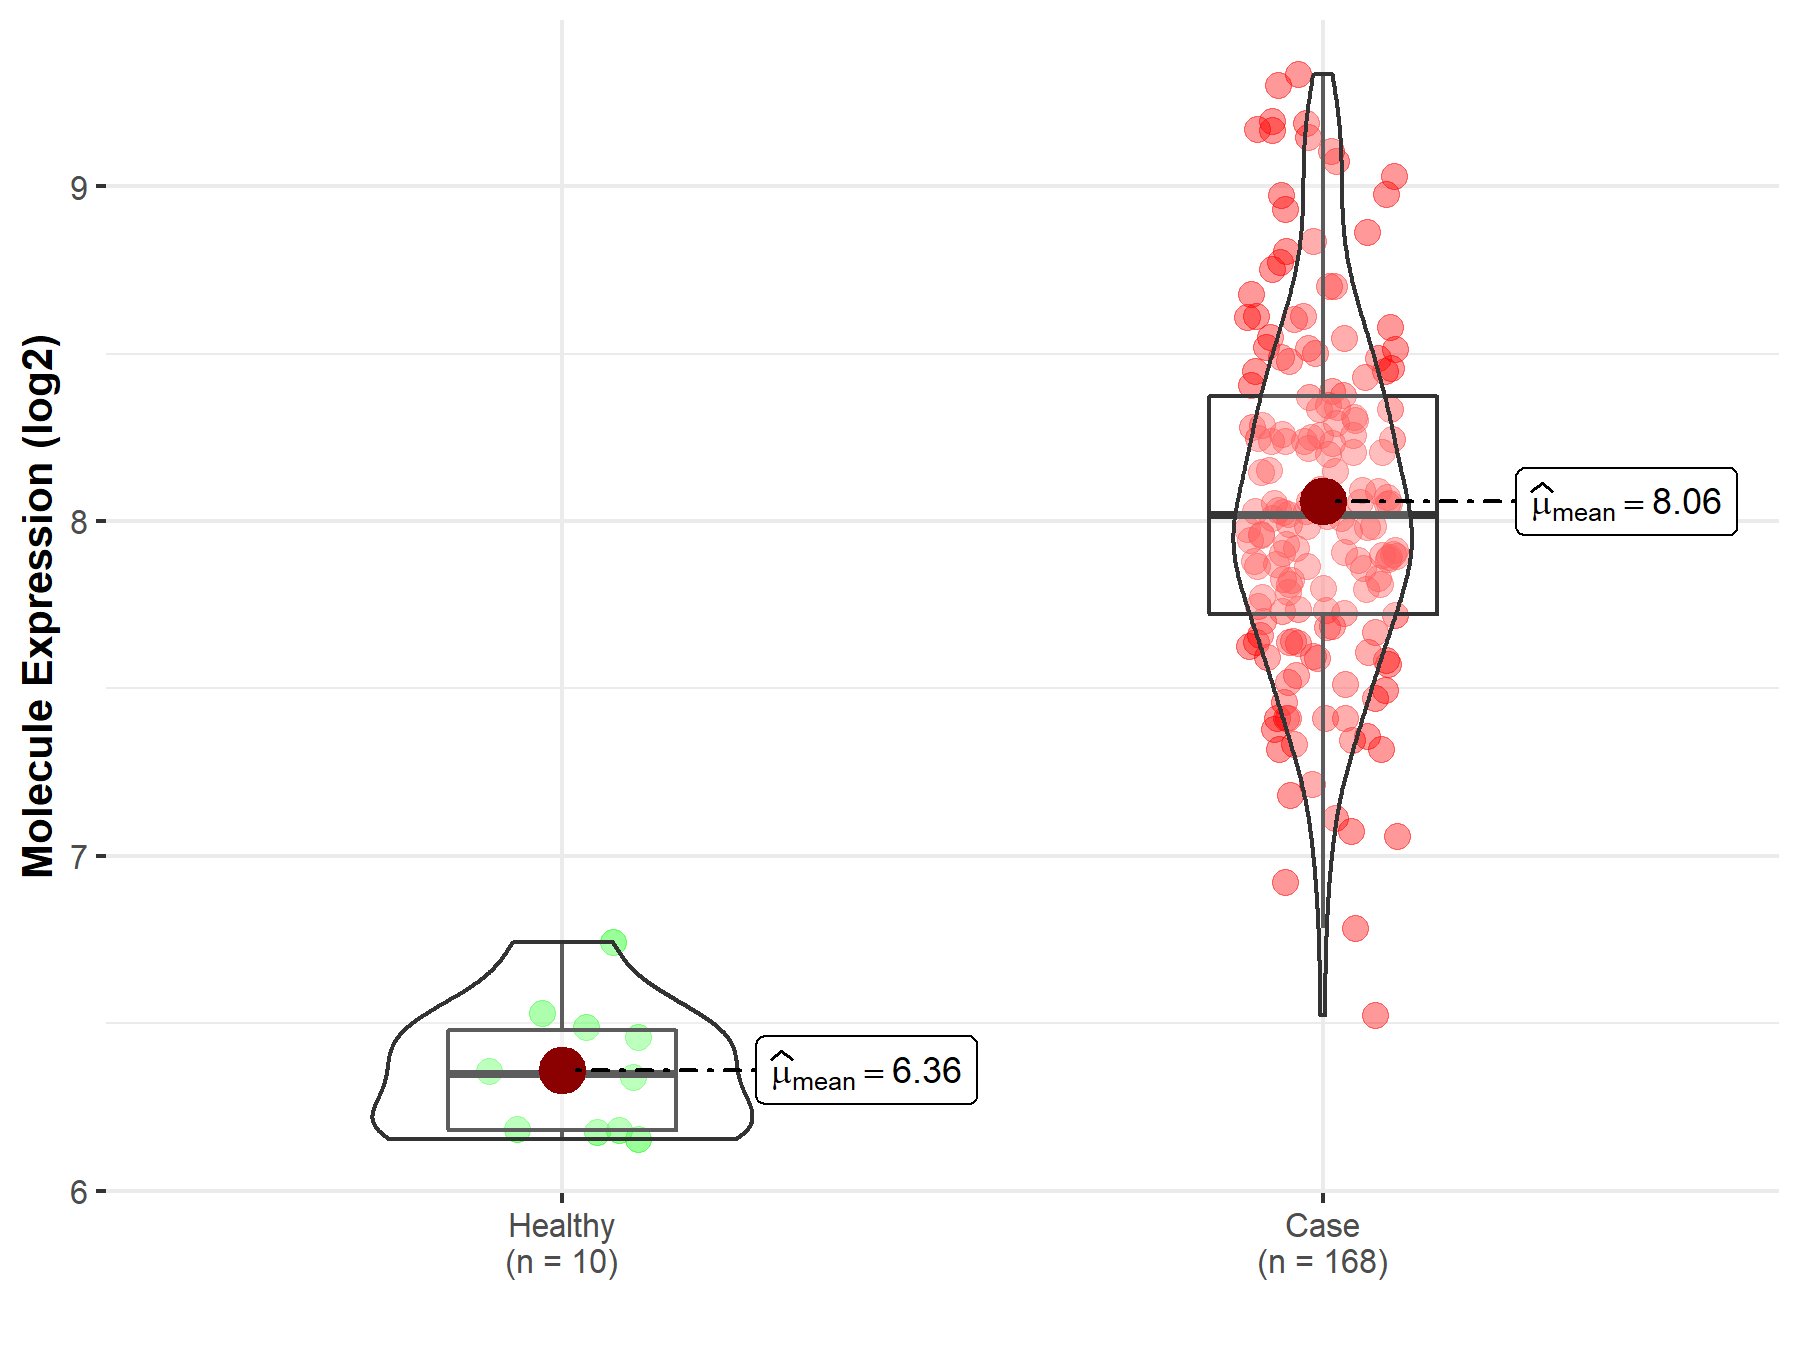
| The Studied Tissue | White matter | |
| The Specified Disease | Glioma | |
| The Expression Level of Disease Section Compare with the Healthy Individual Tissue | p-value: 5.98E-05; Fold-change: 1.20E+00; Z-score: 1.64E+00 | |
|
Molecule expression in the diseased tissue of patients
Molecule expression in the normal tissue of healthy individuals
|
||
| Disease-specific Molecule Abundances |

|
Click to View the Clearer Original Diagram |
| The Studied Tissue | Brainstem tissue | |
| The Specified Disease | Neuroectodermal tumor | |
| The Expression Level of Disease Section Compare with the Healthy Individual Tissue | p-value: 6.69E-15; Fold-change: 1.67E+00; Z-score: 8.56E+00 | |
|
Molecule expression in the diseased tissue of patients
Molecule expression in the normal tissue of healthy individuals
|
||
| Disease-specific Molecule Abundances |

|
Click to View the Clearer Original Diagram |
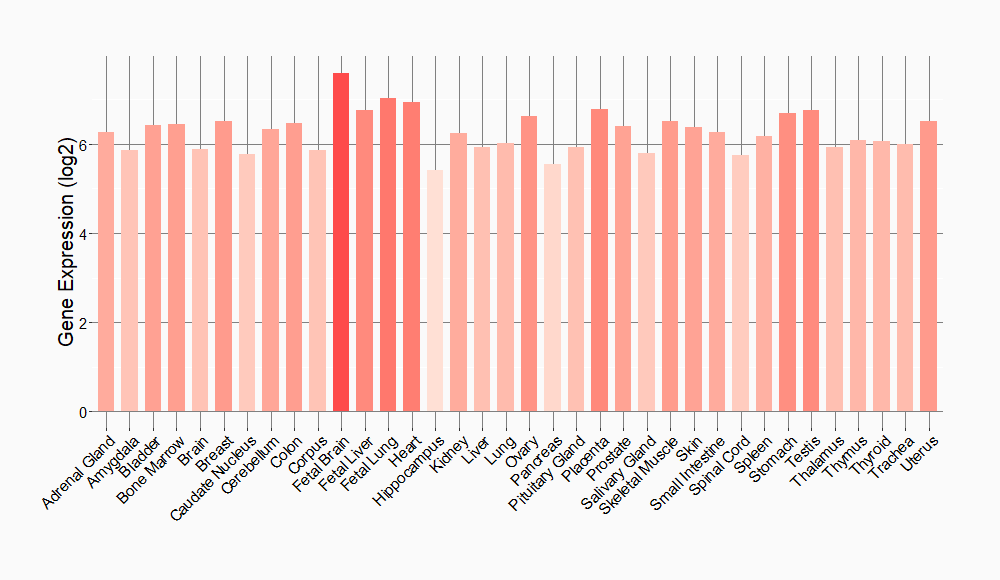
Tissue-specific Molecule Abundances in Healthy Individuals


|
||
References
If you find any error in data or bug in web service, please kindly report it to Dr. Sun and Dr. Yu.
