Molecule Information
General Information of the Molecule (ID: Mol00440)
| Name |
Growth protein 4 inhibitor (ING4)
,Homo sapiens
|
||||
|---|---|---|---|---|---|
| Synonyms |
p29ING4; My036
Click to Show/Hide
|
||||
| Molecule Type |
Protein
|
||||
| Gene Name |
ING4
|
||||
| Gene ID | |||||
| Location |
chr12:6650301-6663142[-]
|
||||
| Sequence |
MAAGMYLEHYLDSIENLPFELQRNFQLMRDLDQRTEDLKAEIDKLATEYMSSARSLSSEE
KLALLKQIQEAYGKCKEFGDDKVQLAMQTYEMVDKHIRRLDTDLARFEADLKEKQIESSD YDSSSSKGKKKGRTQKEKKAARARSKGKNSDEEAPKTAQKKLKLVRTSPEYGMPSVTFGS VHPSDVLDMPVDPNEPTYCLCHQVSYGEMIGCDNPDCSIEWFHFACVGLTTKPRGKWFCP RCSQERKKK Click to Show/Hide
|
||||
| 3D-structure |
|
||||
| Function |
Component of HBO1 complexes, which specifically mediate acetylation of histone H3 at 'Lys-14' (H3K14ac), and have reduced activity toward histone H4. Through chromatin acetylation it may function in DNA replication. May inhibit tumor progression by modulating the transcriptional output of signaling pathways which regulate cell proliferation. Can suppress brain tumor angiogenesis through transcriptional repression of RELA/NFKB3 target genes when complexed with RELA. May also specifically suppress loss of contact inhibition elicited by activated oncogenes such as MYC. Represses hypoxia inducible factor's (HIF) activity by interacting with HIF prolyl hydroxylase 2 (EGLN1). Can enhance apoptosis induced by serum starvation in mammary epithelial cell line HC11.
Click to Show/Hide
|
||||
| Uniprot ID | |||||
| Ensembl ID | |||||
| HGNC ID | |||||
| Click to Show/Hide the Complete Species Lineage | |||||
Type(s) of Resistant Mechanism of This Molecule
Drug Resistance Data Categorized by Drug
Approved Drug(s)
2 drug(s) in total
| Drug Sensitivity Data Categorized by Their Corresponding Mechanisms | ||||
|
|
||||
| Disease Class: Lung adenocarcinoma [ICD-11: 2C25.0] | [1] | |||
| Sensitive Disease | Lung adenocarcinoma [ICD-11: 2C25.0] | |||
| Sensitive Drug | Docetaxel | |||
| Molecule Alteration | Expression | Up-regulation |
||
| Differential expression of the molecule in resistant disease | ||||
| Classification of Disease | Lung cancer [ICD-11: 2C25] | |||
| The Specified Disease | Lung cancer | |||
| The Studied Tissue | Lung tissue | |||
| The Expression Level of Disease Section Compare with the Healthy Individual Tissue | p-value: 9.80E-01 Fold-change: 1.32E-04 Z-score: 2.45E-02 |
|||
| Experimental Note | Identified from the Human Clinical Data | |||
| Cell Pathway Regulation | Cell apoptosis | Activation | hsa04210 | |
| Cell cycle | Activation | hsa04110 | ||
| Cell proliferation | Inhibition | hsa05200 | ||
| In Vitro Model | SPC-A1 cells | Lung | Homo sapiens (Human) | CVCL_6955 |
| H1299 cells | Lung | Homo sapiens (Human) | CVCL_0060 | |
| In Vivo Model | BALB/c nude mouse xenograft model | Mus musculus | ||
| Experiment for Molecule Alteration |
Western blot analysis | |||
| Experiment for Drug Resistance |
MTT assay | |||
| Mechanism Description | miR-650 could contribute to docetaxel chemoresistance of LAD cells by post-transcriptionally downregulating ING4. | |||
| Drug Resistance Data Categorized by Their Corresponding Mechanisms | ||||
|
|
||||
| Disease Class: Glioblastoma [ICD-11: 2A00.02] | [2] | |||
| Resistant Disease | Glioblastoma [ICD-11: 2A00.02] | |||
| Resistant Drug | Temozolomide | |||
| Molecule Alteration | Expression | Down-regulation |
||
| Experimental Note | Revealed Based on the Cell Line Data | |||
| Cell Pathway Regulation | AKT/ERK signaling pathway | Activation | hsa04010 | |
| Cell invasion | Activation | hsa05200 | ||
| Cell proliferation | Activation | hsa05200 | ||
| In Vitro Model | U251 cells | Brain | Homo sapiens (Human) | CVCL_0021 |
| U87 cells | Brain | Homo sapiens (Human) | CVCL_0022 | |
| N3 GBM cells | Brain | Homo sapiens (Human) | N.A. | |
| Experiment for Molecule Alteration |
Western blot analysis | |||
| Experiment for Drug Resistance |
Cell-cycle assay | |||
| Mechanism Description | miR-423-5p contributes to a malignant phenotype and temozolomide chemoresistance in glioblastomas. | |||
Disease- and Tissue-specific Abundances of This Molecule
ICD Disease Classification 02

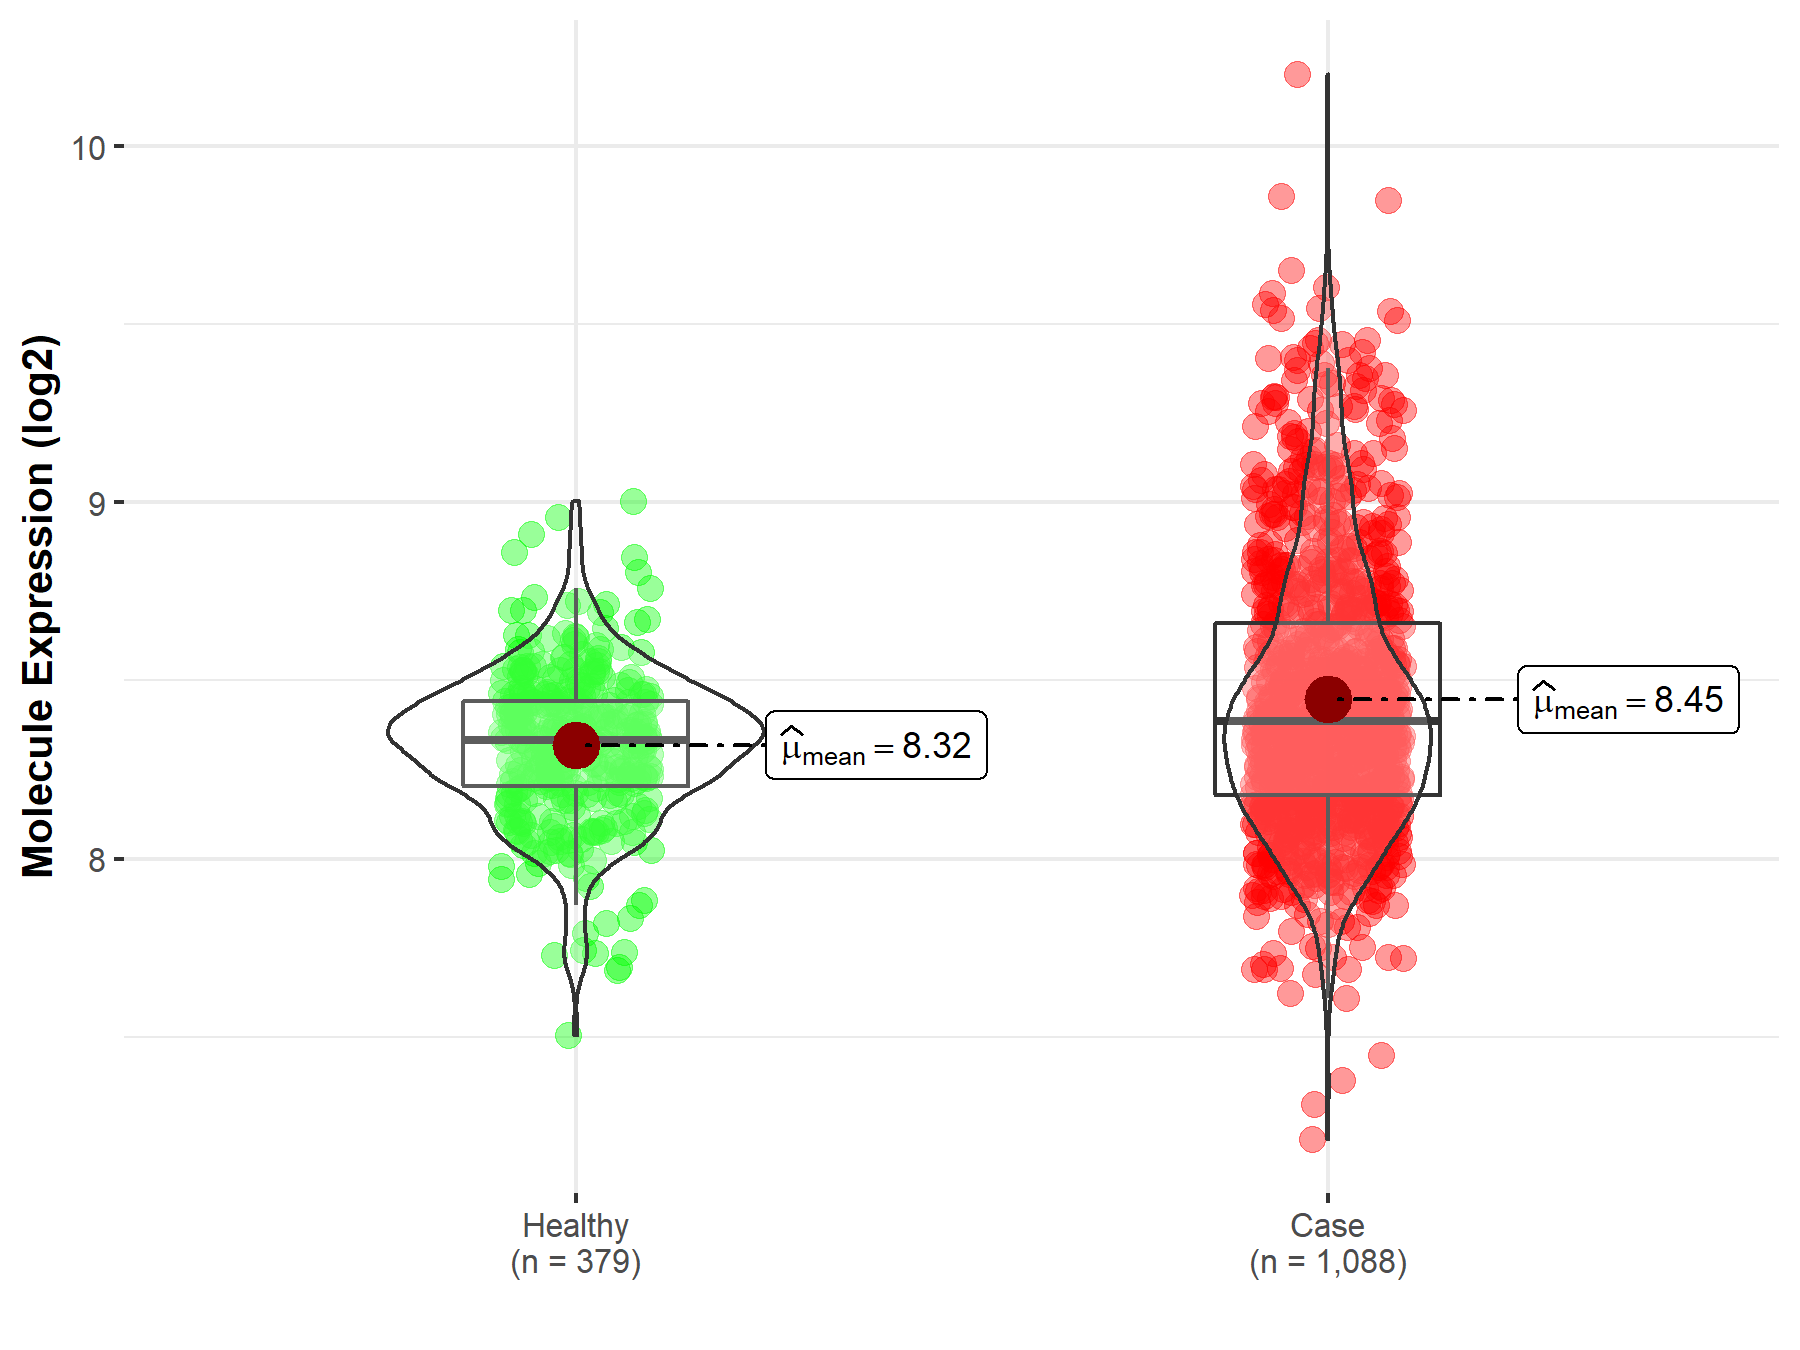
| Differential expression of molecule in resistant diseases | ||
| The Studied Tissue | Nervous tissue | |
| The Specified Disease | Brain cancer | |
| The Expression Level of Disease Section Compare with the Healthy Individual Tissue | p-value: 1.77E-15; Fold-change: 5.20E-02; Z-score: 2.50E-01 | |
|
Molecule expression in the diseased tissue of patients
Molecule expression in the normal tissue of healthy individuals
|
||
| Disease-specific Molecule Abundances |
|
Click to View the Clearer Original Diagram |
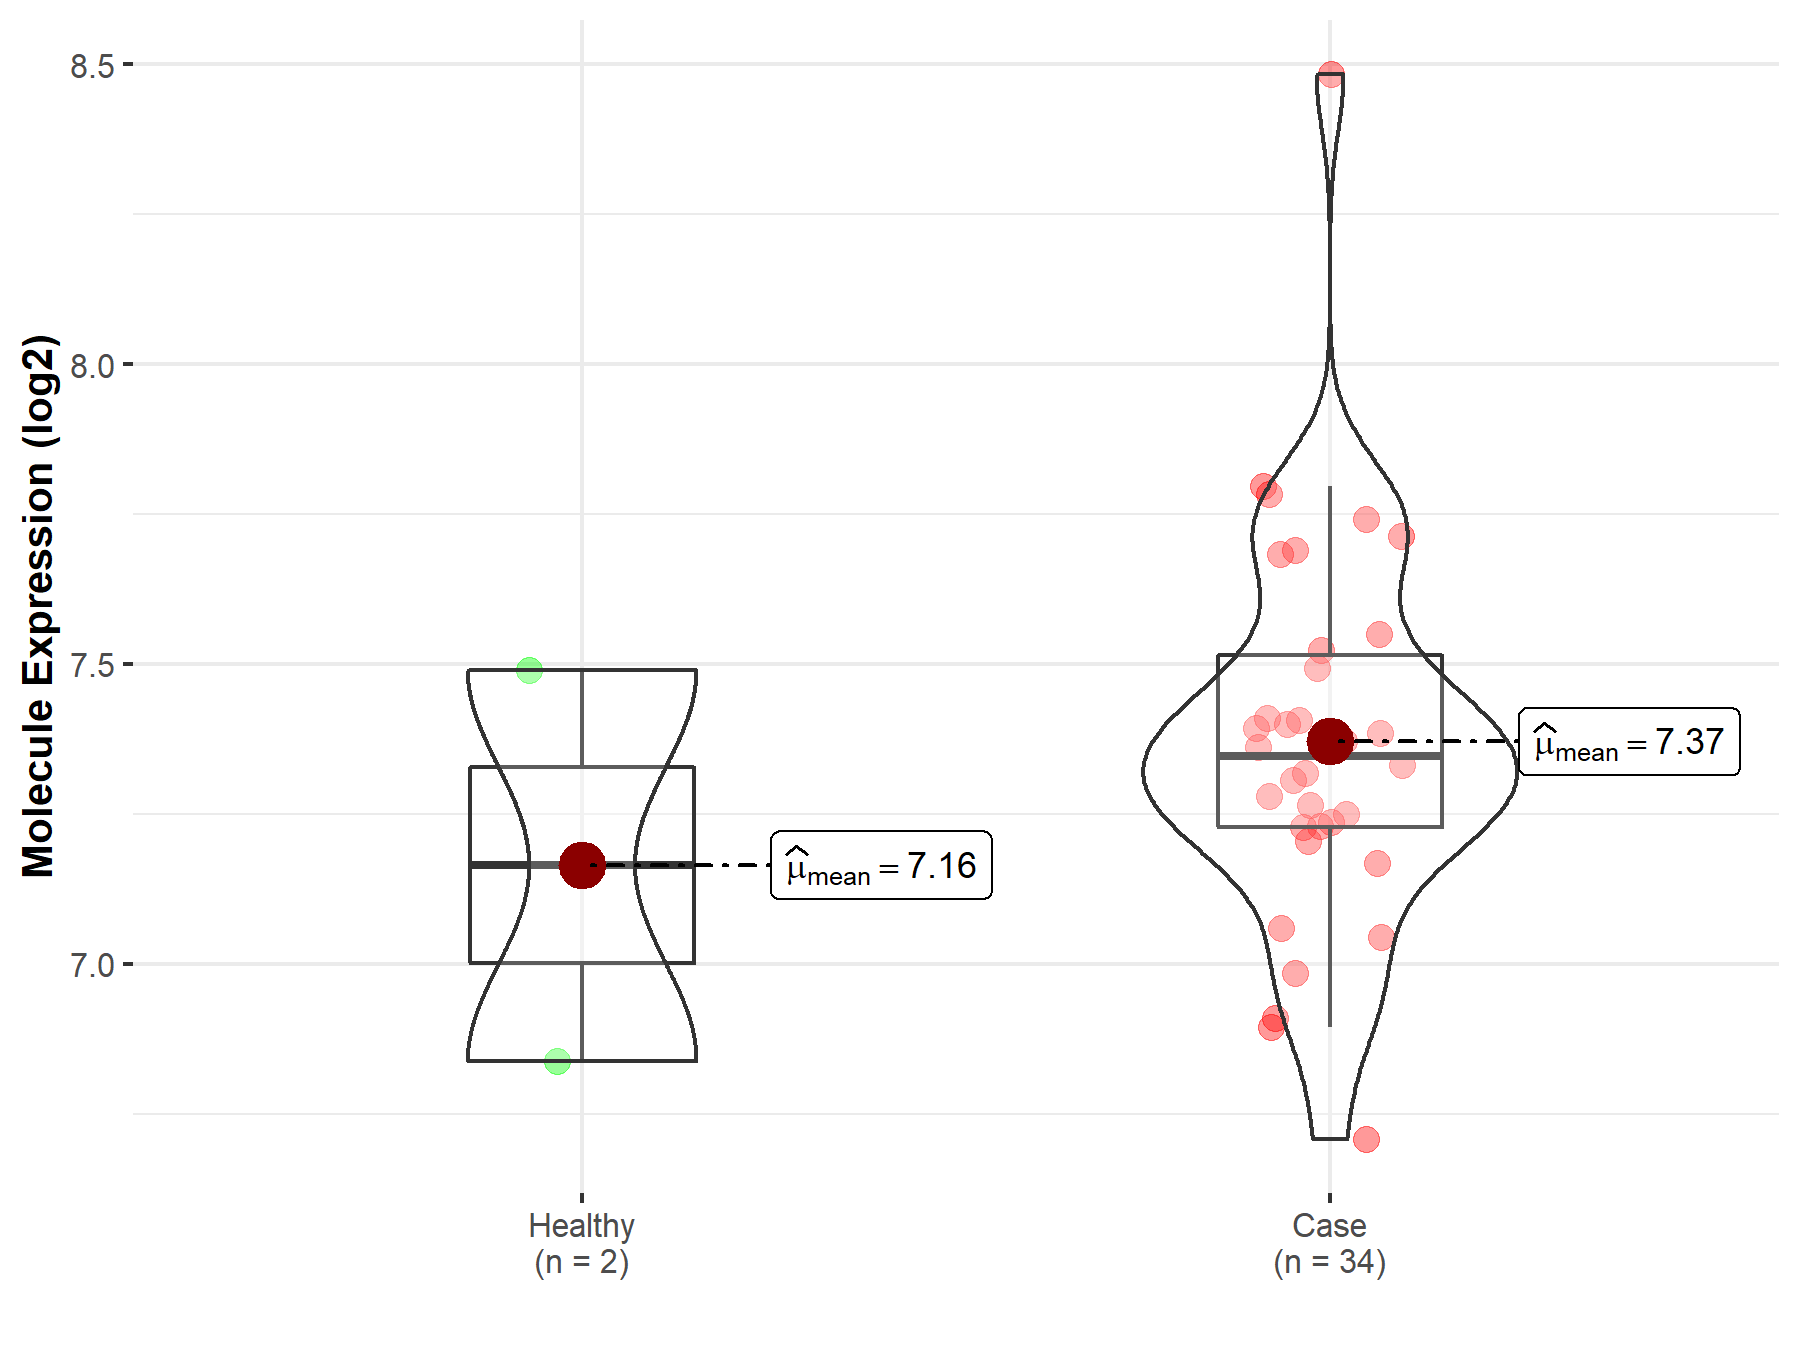
| The Studied Tissue | Brainstem tissue | |
| The Specified Disease | Glioma | |
| The Expression Level of Disease Section Compare with the Healthy Individual Tissue | p-value: 6.40E-01; Fold-change: 1.83E-01; Z-score: 3.96E-01 | |
|
Molecule expression in the diseased tissue of patients
Molecule expression in the normal tissue of healthy individuals
|
||
| Disease-specific Molecule Abundances |
|
Click to View the Clearer Original Diagram |
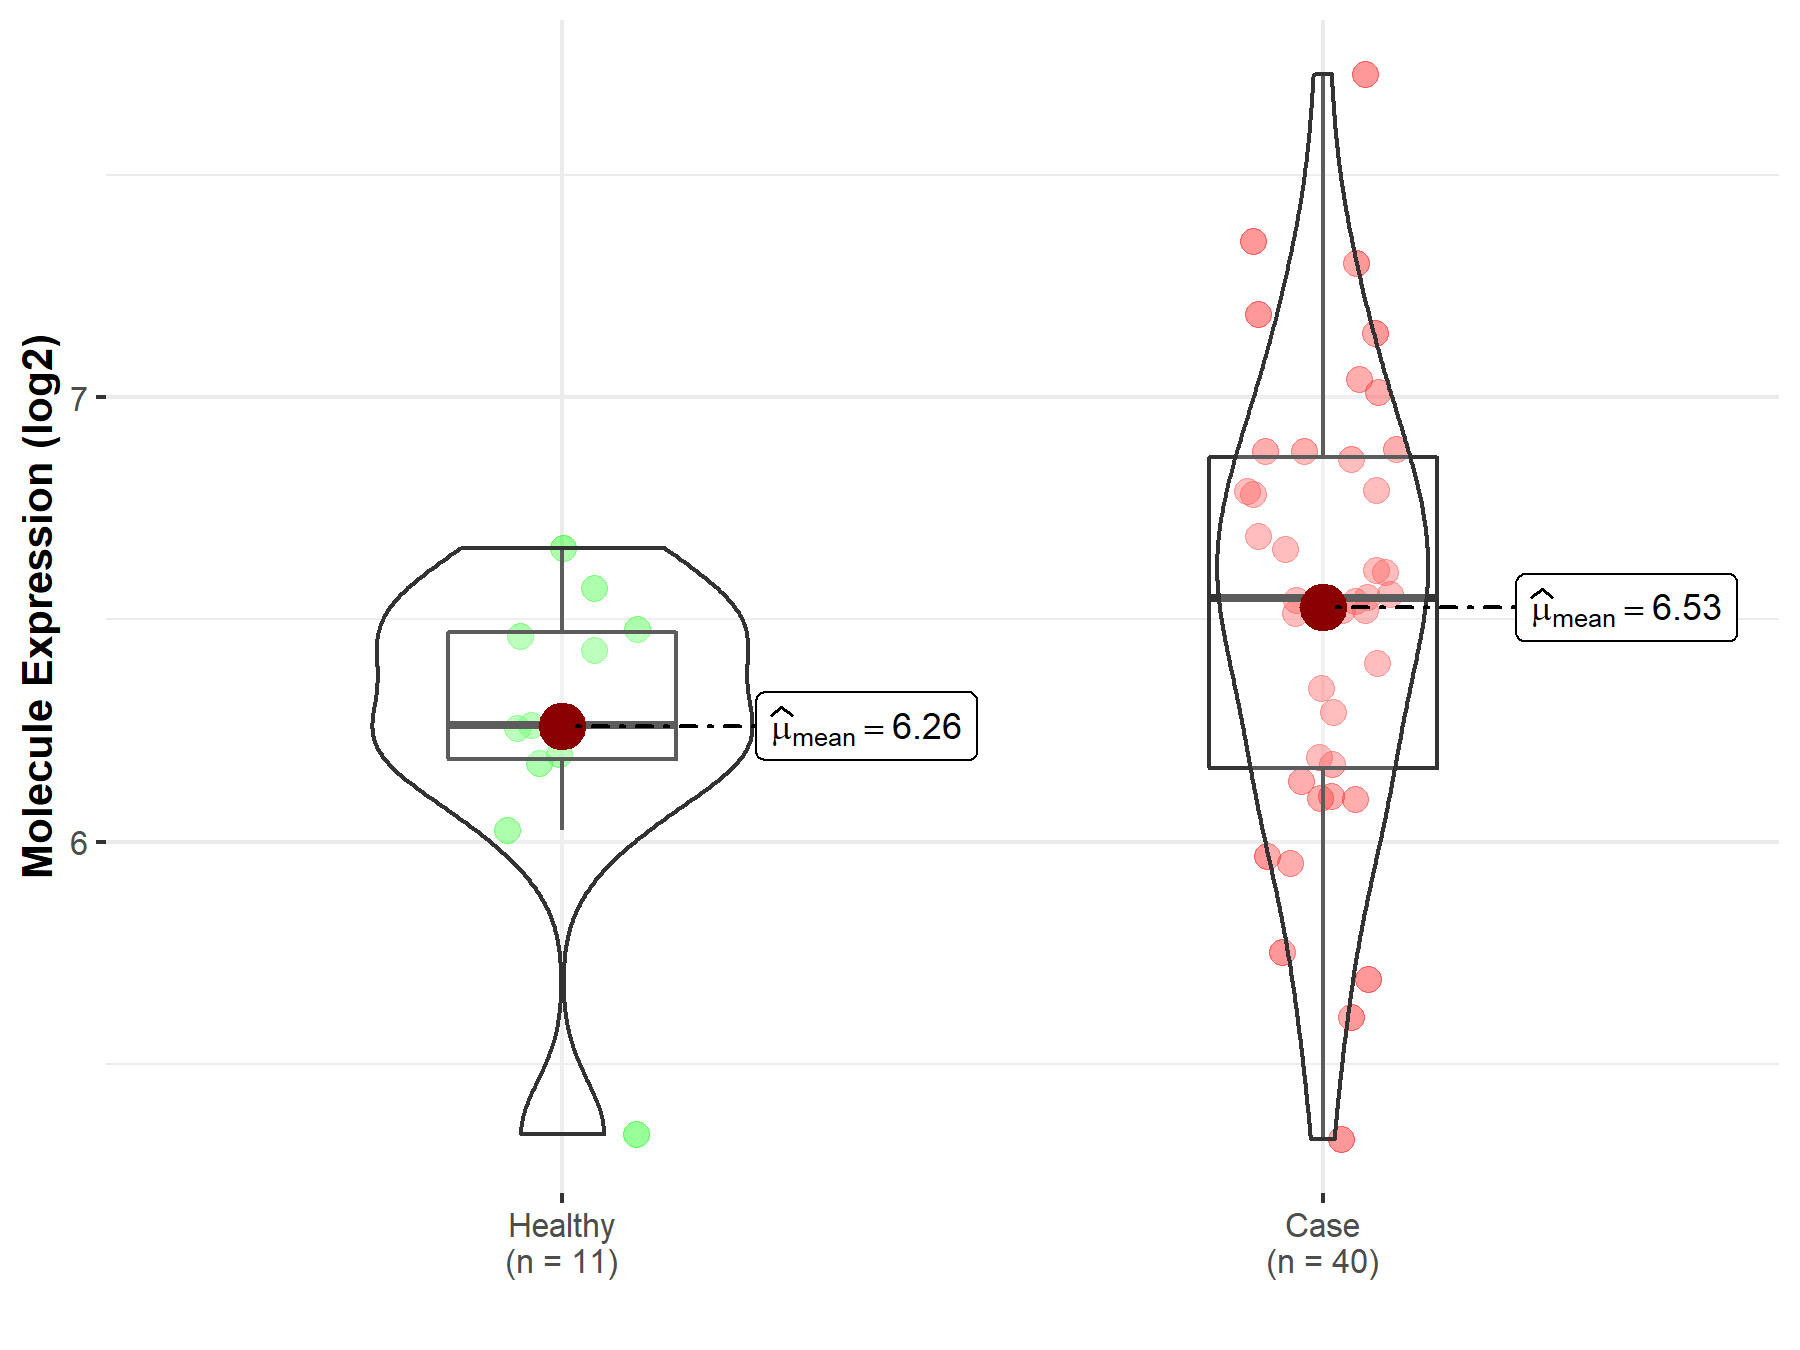
| The Studied Tissue | White matter | |
| The Specified Disease | Glioma | |
| The Expression Level of Disease Section Compare with the Healthy Individual Tissue | p-value: 6.02E-02; Fold-change: 2.84E-01; Z-score: 7.95E-01 | |
|
Molecule expression in the diseased tissue of patients
Molecule expression in the normal tissue of healthy individuals
|
||
| Disease-specific Molecule Abundances |
|
Click to View the Clearer Original Diagram |
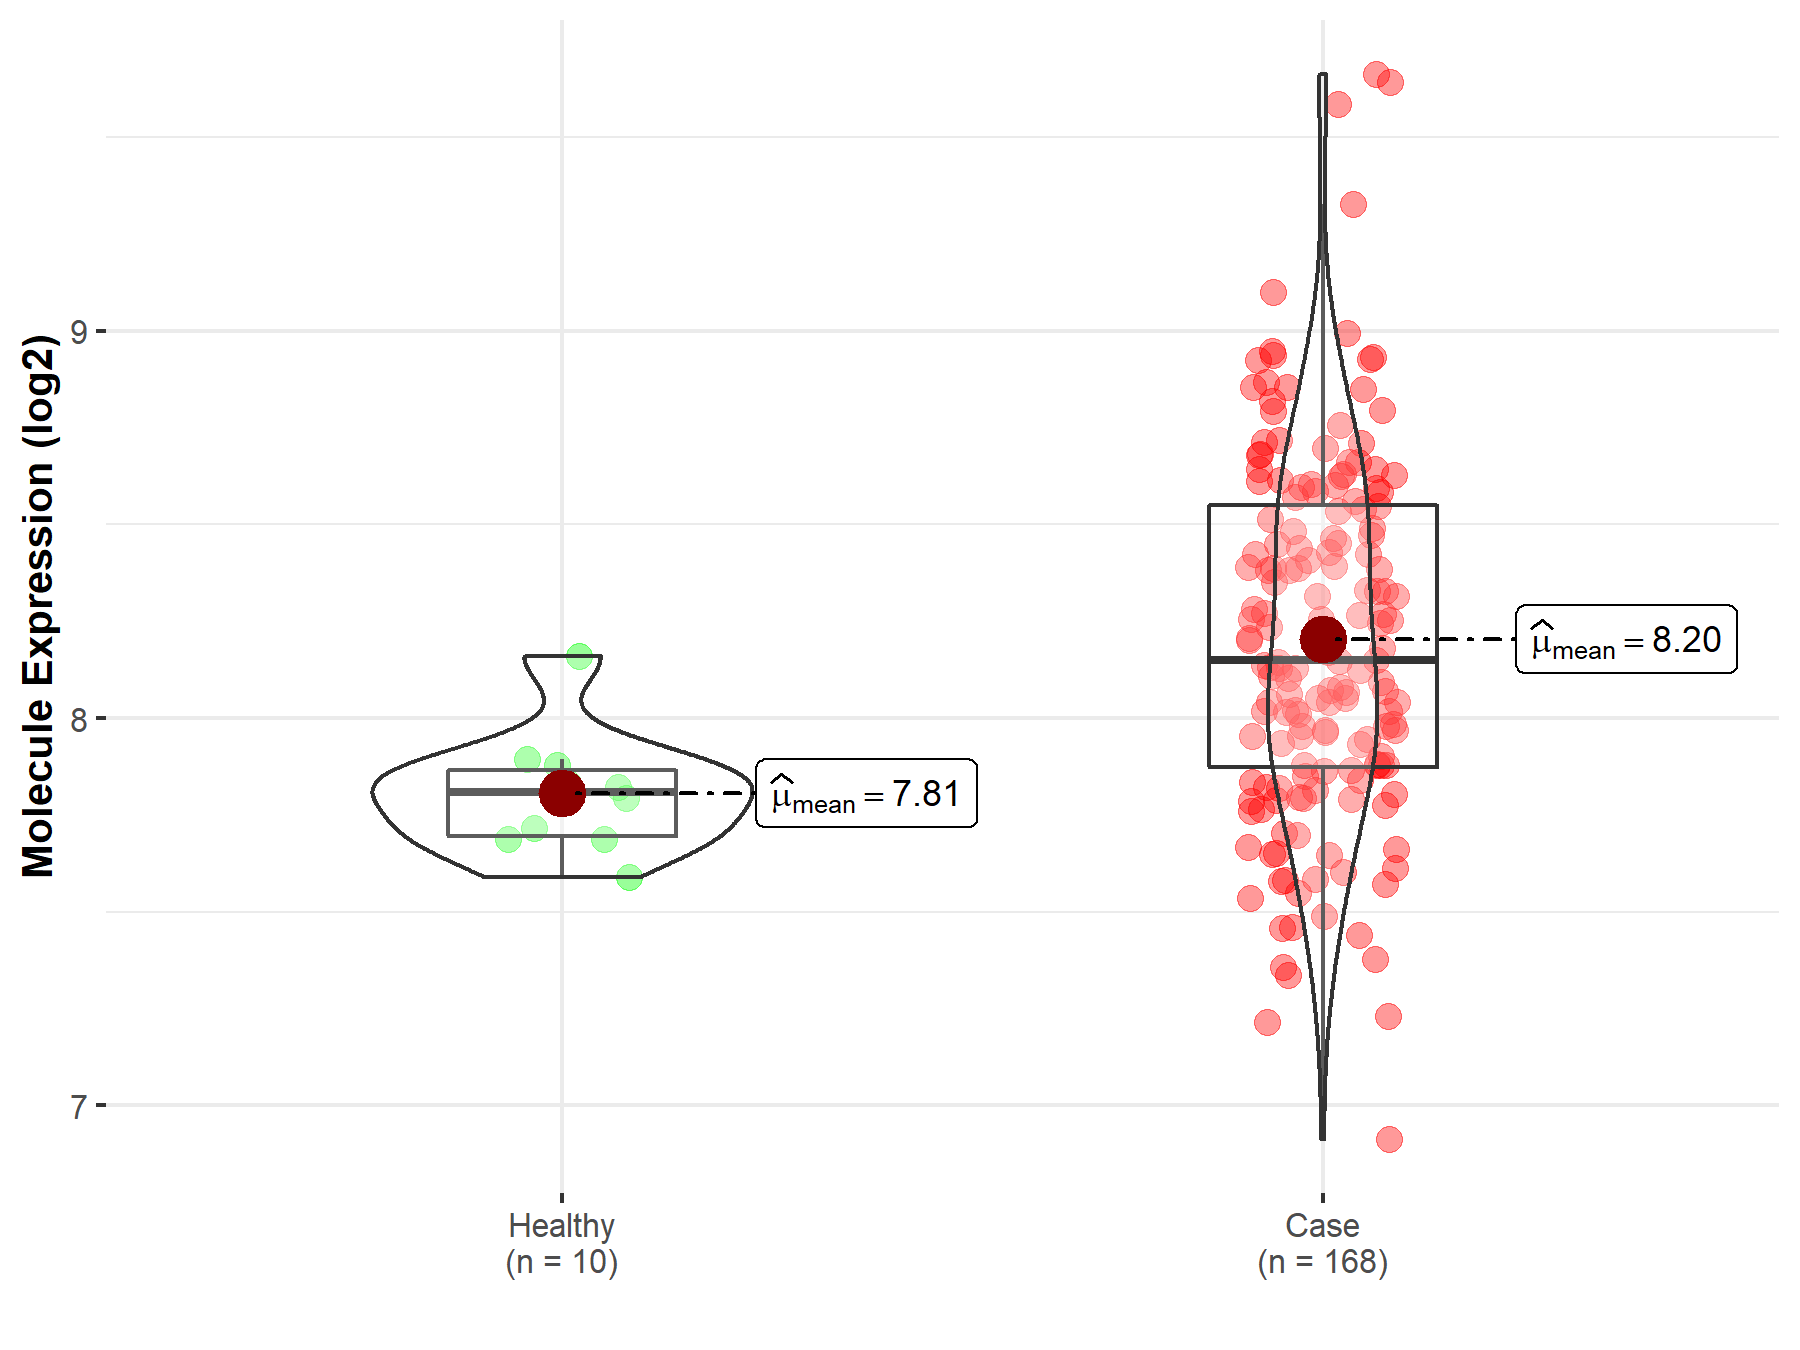
| The Studied Tissue | Brainstem tissue | |
| The Specified Disease | Neuroectodermal tumor | |
| The Expression Level of Disease Section Compare with the Healthy Individual Tissue | p-value: 2.17E-06; Fold-change: 3.42E-01; Z-score: 2.17E+00 | |
|
Molecule expression in the diseased tissue of patients
Molecule expression in the normal tissue of healthy individuals
|
||
| Disease-specific Molecule Abundances |
|
Click to View the Clearer Original Diagram |
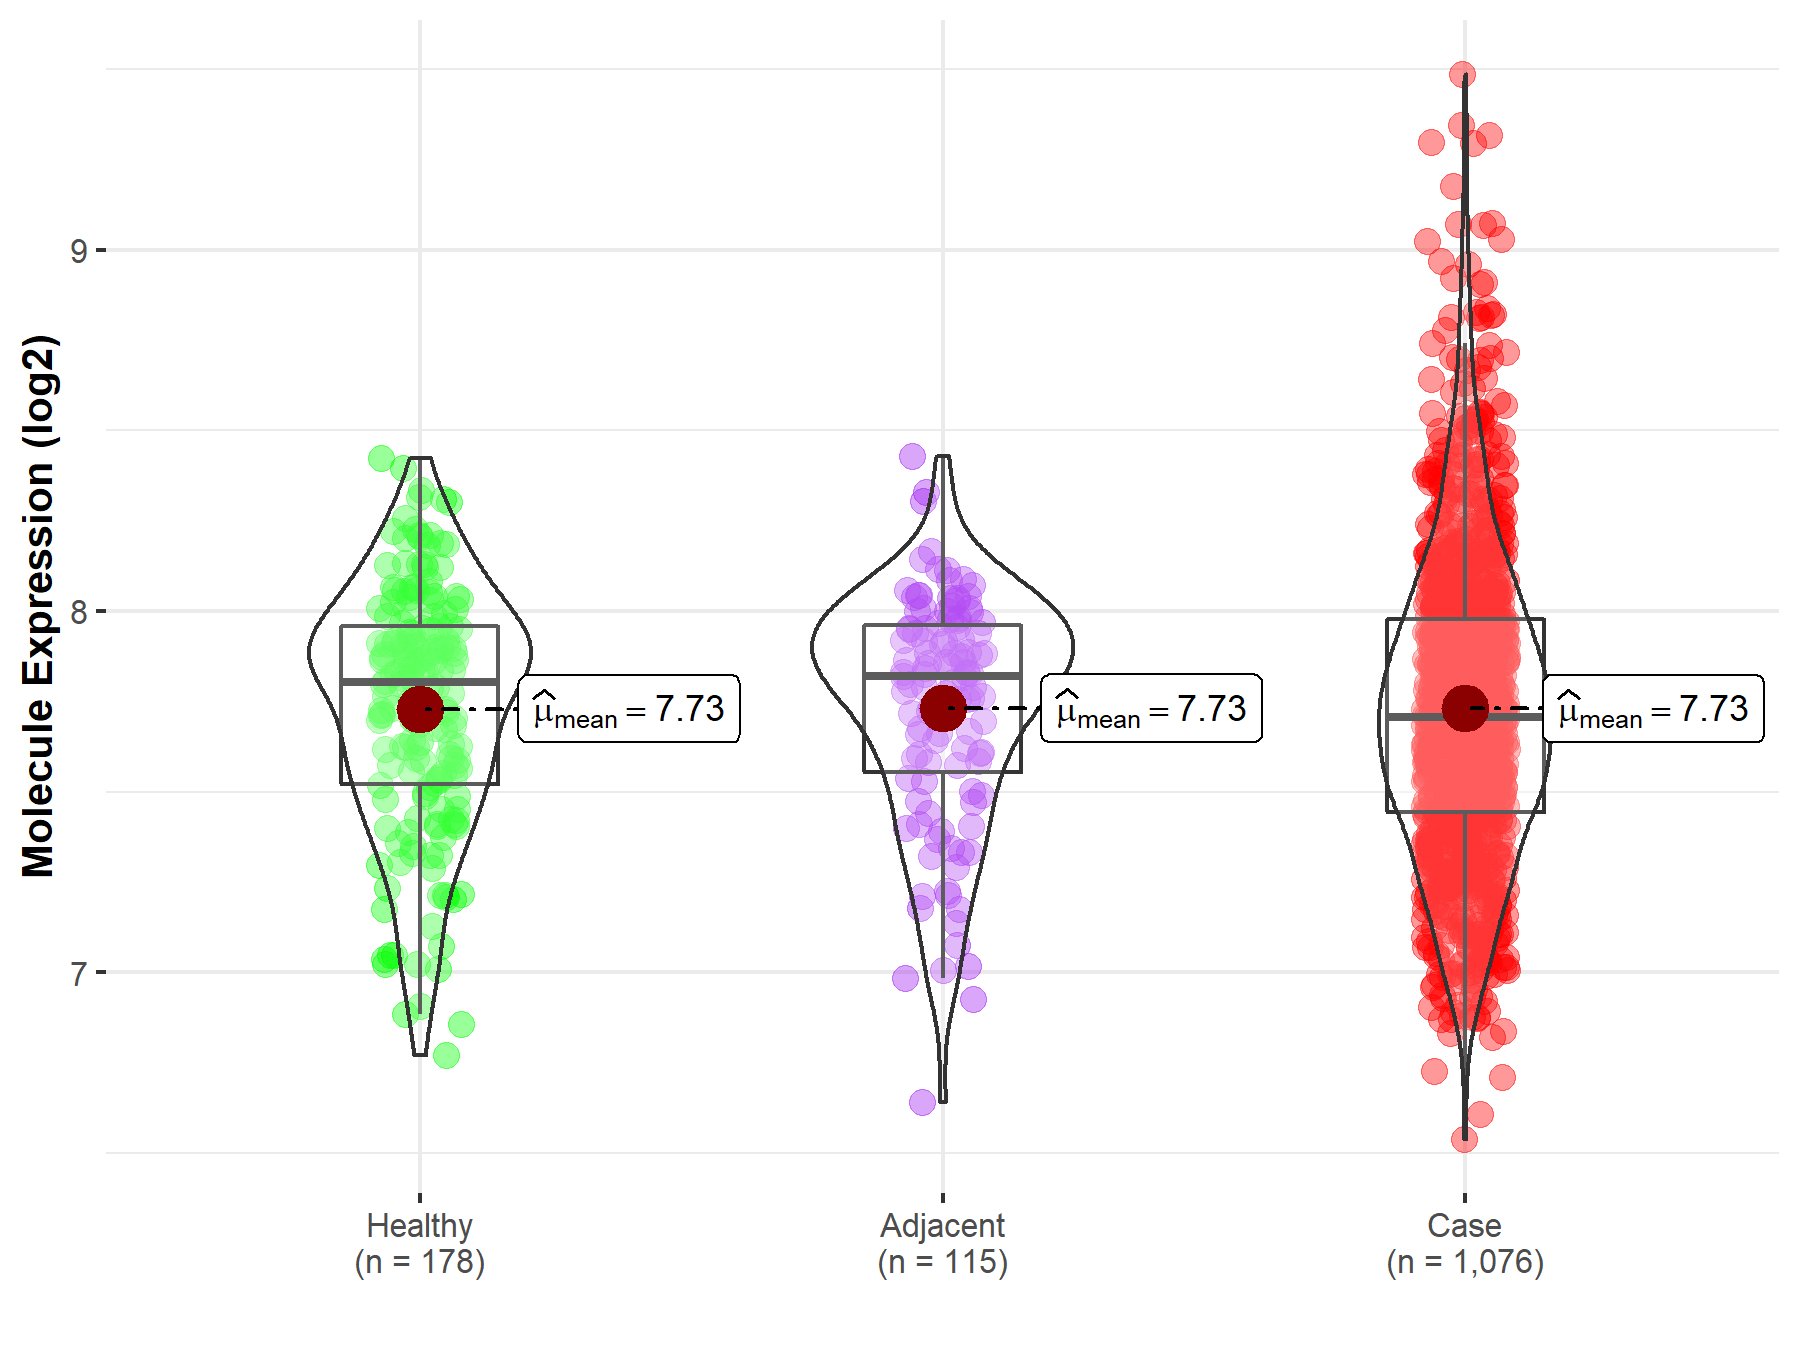
| Differential expression of molecule in resistant diseases | ||
| The Studied Tissue | Lung | |
| The Specified Disease | Lung cancer | |
| The Expression Level of Disease Section Compare with the Healthy Individual Tissue | p-value: 9.80E-01; Fold-change: -9.51E-02; Z-score: -2.78E-01 | |
| The Expression Level of Disease Section Compare with the Adjacent Tissue | p-value: 9.77E-01; Fold-change: -1.13E-01; Z-score: -3.47E-01 | |
|
Molecule expression in the normal tissue adjacent to the diseased tissue of patients
Molecule expression in the diseased tissue of patients
Molecule expression in the normal tissue of healthy individuals
|
||
| Disease-specific Molecule Abundances |
|
Click to View the Clearer Original Diagram |
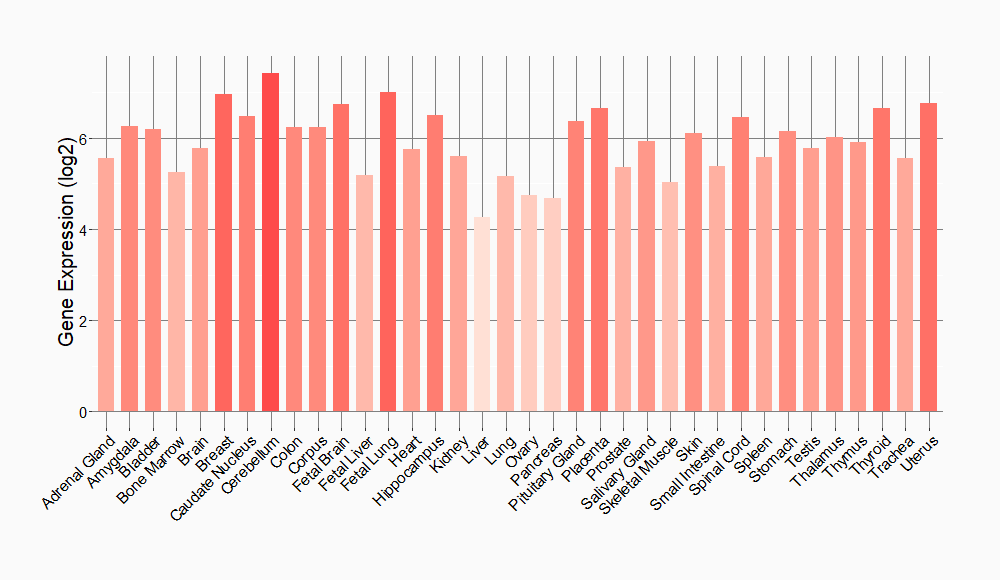
Tissue-specific Molecule Abundances in Healthy Individuals

|
||
References
If you find any error in data or bug in web service, please kindly report it to Dr. Sun and Dr. Yu.
