Molecule Information
General Information of the Molecule (ID: Mol00434)
| Name |
Interleukin-11 (IL11)
,Homo sapiens
|
||||
|---|---|---|---|---|---|
| Molecule Type |
Protein
|
||||
| Gene Name |
IL11
|
||||
| Gene ID | |||||
| Location |
chr19:55364382-55370463[-]
|
||||
| Sequence |
MNCVCRLVLVVLSLWPDTAVAPGPPPGPPRVSPDPRAELDSTVLLTRSLLADTRQLAAQL
RDKFPADGDHNLDSLPTLAMSAGALGALQLPGVLTRLRADLLSYLRHVQWLRRAGGSSLK TLEPELGTLQARLDRLLRRLQLLMSRLALPQPPPDPPAPPLAPPSSAWGGIRAAHAILGG LHLTLDWAVRGLLLLKTRL Click to Show/Hide
|
||||
| 3D-structure |
|
||||
| Function |
Cytokine that stimulates the proliferation of hematopoietic stem cells and megakaryocyte progenitor cells and induces megakaryocyte maturation resulting in increased platelet production. Also promotes the proliferation of hepatocytes in response to liver damage. Binding to its receptor formed by IL6ST and IL11RA activates a signaling cascade that promotes cell proliferation. Signaling leads to the activation of intracellular protein kinases and the phosphorylation of STAT3. The interaction with the membrane-bound IL11RA and IL6ST stimulates 'classic signaling', whereas the binding of IL11 and soluble IL11RA to IL6ST stimulates 'trans-signaling'.
Click to Show/Hide
|
||||
| Uniprot ID | |||||
| Ensembl ID | |||||
| HGNC ID | |||||
| Click to Show/Hide the Complete Species Lineage | |||||
Type(s) of Resistant Mechanism of This Molecule
Drug Resistance Data Categorized by Drug
Approved Drug(s)
2 drug(s) in total
| Drug Sensitivity Data Categorized by Their Corresponding Mechanisms | ||||
|
|
||||
| Disease Class: Breast cancer [ICD-11: 2C60.3] | [1] | |||
| Sensitive Disease | Breast cancer [ICD-11: 2C60.3] | |||
| Sensitive Drug | Doxorubicin | |||
| Molecule Alteration | Expression | Down-regulation |
||
| Differential expression of the molecule in resistant disease | ||||
| Classification of Disease | Breast cancer [ICD-11: 2C60] | |||
| The Specified Disease | Breast cancer | |||
| The Studied Tissue | Breast tissue | |||
| The Expression Level of Disease Section Compare with the Healthy Individual Tissue | p-value: 7.27E-01 Fold-change: -1.90E-03 Z-score: -3.50E-01 |
|||
| Experimental Note | Revealed Based on the Cell Line Data | |||
| Cell Pathway Regulation | Cell apoptosis | Activation | hsa04210 | |
| In Vitro Model | MCF-7 cells | Breast | Homo sapiens (Human) | CVCL_0031 |
| MDA-MB-231 cells | Breast | Homo sapiens (Human) | CVCL_0062 | |
| HEK293T cells | Kidney | Homo sapiens (Human) | CVCL_0063 | |
| G418 cells | Breast | Homo sapiens (Human) | N.A. | |
| In Vivo Model | NOD/SCID nude mouse xenograft model | Mus musculus | ||
| Experiment for Molecule Alteration |
Western blot analysis | |||
| Experiment for Drug Resistance |
Flow cytometry assay | |||
| Mechanism Description | miR-30c plays a pivotal role in Paclitaxel and Doxorubicin chemo-resistance by a direct targeting of TWF1, which encodes an actin-binding protein and promotes EMT. | |||
| Drug Sensitivity Data Categorized by Their Corresponding Mechanisms | ||||
|
|
||||
| Disease Class: Breast cancer [ICD-11: 2C60.3] | [1] | |||
| Sensitive Disease | Breast cancer [ICD-11: 2C60.3] | |||
| Sensitive Drug | Paclitaxel | |||
| Molecule Alteration | Expression | Down-regulation |
||
| Experimental Note | Revealed Based on the Cell Line Data | |||
| Cell Pathway Regulation | Cell apoptosis | Activation | hsa04210 | |
| In Vitro Model | MCF-7 cells | Breast | Homo sapiens (Human) | CVCL_0031 |
| MDA-MB-231 cells | Breast | Homo sapiens (Human) | CVCL_0062 | |
| HEK293T cells | Kidney | Homo sapiens (Human) | CVCL_0063 | |
| G418 cells | Breast | Homo sapiens (Human) | N.A. | |
| In Vivo Model | NOD/SCID nude mouse xenograft model | Mus musculus | ||
| Experiment for Molecule Alteration |
Western blot analysis | |||
| Experiment for Drug Resistance |
Flow cytometry assay | |||
| Mechanism Description | miR-30c plays a pivotal role in Paclitaxel and Doxorubicin chemo-resistance by a direct targeting of TWF1, which encodes an actin-binding protein and promotes EMT. | |||
Disease- and Tissue-specific Abundances of This Molecule
ICD Disease Classification 02

| Differential expression of molecule in resistant diseases | ||
| The Studied Tissue | Breast tissue | |
| The Specified Disease | Breast cancer | |
| The Expression Level of Disease Section Compare with the Healthy Individual Tissue | p-value: 7.27E-01; Fold-change: 3.12E-02; Z-score: 1.05E-01 | |
| The Expression Level of Disease Section Compare with the Adjacent Tissue | p-value: 2.09E-01; Fold-change: 1.42E-01; Z-score: 4.97E-01 | |
|
Molecule expression in the normal tissue adjacent to the diseased tissue of patients
Molecule expression in the diseased tissue of patients
Molecule expression in the normal tissue of healthy individuals
|
||
| Disease-specific Molecule Abundances |

|
Click to View the Clearer Original Diagram |
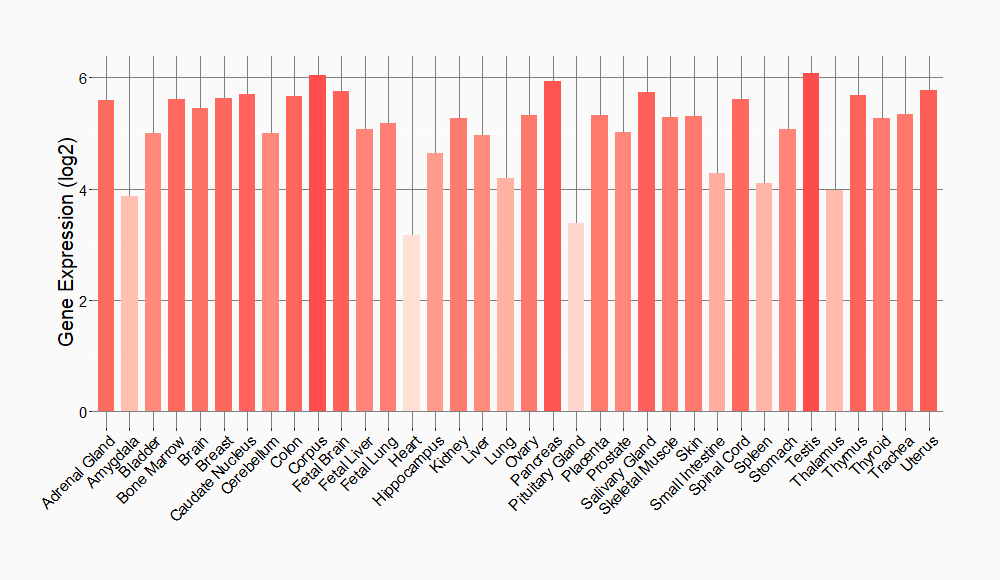
Tissue-specific Molecule Abundances in Healthy Individuals


|
||
References
If you find any error in data or bug in web service, please kindly report it to Dr. Sun and Dr. Yu.
