Molecule Information
General Information of the Molecule (ID: Mol00422)
| Name |
Hexokinase-2 (HK2)
,Homo sapiens
|
||||
|---|---|---|---|---|---|
| Synonyms |
Hexokinase type II; HK II; Hexokinase-B; Muscle form hexokinase
Click to Show/Hide
|
||||
| Molecule Type |
Protein
|
||||
| Gene Name |
HK2
|
||||
| Gene ID | |||||
| Location |
chr2:74834127-74893359[+]
|
||||
| Sequence |
MIASHLLAYFFTELNHDQVQKVDQYLYHMRLSDETLLEISKRFRKEMEKGLGATTHPTAA
VKMLPTFVRSTPDGTEHGEFLALDLGGTNFRVLWVKVTDNGLQKVEMENQIYAIPEDIMR GSGTQLFDHIAECLANFMDKLQIKDKKLPLGFTFSFPCHQTKLDESFLVSWTKGFKSSGV EGRDVVALIRKAIQRRGDFDIDIVAVVNDTVGTMMTCGYDDHNCEIGLIVGTGSNACYME EMRHIDMVEGDEGRMCINMEWGAFGDDGSLNDIRTEFDQEIDMGSLNPGKQLFEKMISGM YMGELVRLILVKMAKEELLFGGKLSPELLNTGRFETKDISDIEGEKDGIRKAREVLMRLG LDPTQEDCVATHRICQIVSTRSASLCAATLAAVLQRIKENKGEERLRSTIGVDGSVYKKH PHFAKRLHKTVRRLVPGCDVRFLRSEDGSGKGAAMVTAVAYRLADQHRARQKTLEHLQLS HDQLLEVKRRMKVEMERGLSKETHASAPVKMLPTYVCATPDGTEKGDFLALDLGGTNFRV LLVRVRNGKWGGVEMHNKIYAIPQEVMHGTGDELFDHIVQCIADFLEYMGMKGVSLPLGF TFSFPCQQNSLDESILLKWTKGFKASGCEGEDVVTLLKEAIHRREEFDLDVVAVVNDTVG TMMTCGFEDPHCEVGLIVGTGSNACYMEEMRNVELVEGEEGRMCVNMEWGAFGDNGCLDD FRTEFDVAVDELSLNPGKQRFEKMISGMYLGEIVRNILIDFTKRGLLFRGRISERLKTRG IFETKFLSQIESDCLALLQVRAILQHLGLESTCDDSIIVKEVCTVVARRAAQLCGAGMAA VVDRIRENRGLDALKVTVGVDGTLYKLHPHFAKVMHETVKDLAPKCDVSFLQSEDGSGKG AALITAVACRIREAGQR Click to Show/Hide
|
||||
| Function |
Catalyzes the phosphorylation of hexose, such as D-glucose and D-fructose, to hexose 6-phosphate (D-glucose 6-phosphate and D-fructose 6-phosphate, respectively). Mediates the initial step of glycolysis by catalyzing phosphorylation of D-glucose to D-glucose 6-phosphate. Plays a key role in maintaining the integrity of the outer mitochondrial membrane by preventing the release of apoptogenic molecules from the intermembrane space and subsequent apoptosis.
Click to Show/Hide
|
||||
| Uniprot ID | |||||
| Ensembl ID | |||||
| HGNC ID | |||||
| Click to Show/Hide the Complete Species Lineage | |||||
Type(s) of Resistant Mechanism of This Molecule
Drug Resistance Data Categorized by Drug
Approved Drug(s)
5 drug(s) in total
| Drug Resistance Data Categorized by Their Corresponding Mechanisms | ||||
|
|
||||
| Disease Class: Acute myeloid leukemia [ICD-11: 2A60.0] | [1] | |||
| Resistant Disease | Acute myeloid leukemia [ICD-11: 2A60.0] | |||
| Resistant Drug | Doxorubicin | |||
| Molecule Alteration | Expression | Up-regulation |
||
| Differential expression of the molecule in resistant disease | ||||
| Classification of Disease | Acute myeloid leukemia [ICD-11: 2A60] | |||
| The Specified Disease | Acute myelocytic leukemia | |||
| The Studied Tissue | Bone marrow | |||
| The Expression Level of Disease Section Compare with the Healthy Individual Tissue | p-value: 1.29E-13 Fold-change: 1.01E-01 Z-score: 7.67E+00 |
|||
| Experimental Note | Revealed Based on the Cell Line Data | |||
| Cell Pathway Regulation | Cell viability | Activation | hsa05200 | |
| miR125a/hexokinase 2 pathway | Regulation | N.A. | ||
| In Vitro Model | HL60 cells | Peripheral blood | Homo sapiens (Human) | CVCL_0002 |
| Experiment for Molecule Alteration |
Western blot analysis | |||
| Experiment for Drug Resistance |
MTT assay | |||
| Mechanism Description | Hk2, a target of miR-125a, was positively regulated by uca1 in HL60, and HL60/ADR cells,and UCA1 overexpression significantly attenuated miR-125-mediated inhibition on HIF-1alpha-dependent glycolysis in HL60 and HL60/ADR cells. | |||
| Drug Sensitivity Data Categorized by Their Corresponding Mechanisms | ||||
|
|
||||
| Disease Class: Acute myeloid leukemia [ICD-11: 2A60.0] | [1] | |||
| Sensitive Disease | Acute myeloid leukemia [ICD-11: 2A60.0] | |||
| Sensitive Drug | Doxorubicin | |||
| Molecule Alteration | Expression | Down-regulation |
||
| Experimental Note | Revealed Based on the Cell Line Data | |||
| Cell Pathway Regulation | Cell viability | Inhibition | hsa05200 | |
| miR125a/hexokinase 2 pathway | Regulation | N.A. | ||
| In Vitro Model | HL60 cells | Peripheral blood | Homo sapiens (Human) | CVCL_0002 |
| Experiment for Molecule Alteration |
Western blot analysis | |||
| Experiment for Drug Resistance |
MTT assay | |||
| Mechanism Description | Hk2, a target of miR-125a, was positively regulated by uca1 in HL60, and HL60/ADR cells,and UCA1 overexpression significantly attenuated miR-125-mediated inhibition on HIF-1alpha-dependent glycolysis in HL60 and HL60/ADR cells. | |||
| Drug Sensitivity Data Categorized by Their Corresponding Mechanisms | ||||
|
|
||||
| Disease Class: Liver cancer [ICD-11: 2C12.6] | [2] | |||
| Sensitive Disease | Liver cancer [ICD-11: 2C12.6] | |||
| Sensitive Drug | Methotrexate | |||
| Molecule Alteration | Expression | Down-regulation |
||
| Differential expression of the molecule in resistant disease | ||||
| Classification of Disease | Liver cancer [ICD-11: 2C12] | |||
| The Specified Disease | Liver cancer | |||
| The Studied Tissue | Liver tissue | |||
| The Expression Level of Disease Section Compare with the Healthy Individual Tissue | p-value: 4.45E-02 Fold-change: -2.85E-02 Z-score: -2.04E+00 |
|||
| Experimental Note | Revealed Based on the Cell Line Data | |||
| Cell Pathway Regulation | Cell proliferation | Inhibition | hsa05200 | |
| In Vitro Model | HepG2 cells | Liver | Homo sapiens (Human) | CVCL_0027 |
| Experiment for Molecule Alteration |
Western blot analysis | |||
| Experiment for Drug Resistance |
MTT assay | |||
| Mechanism Description | Curcumin mediated the amputation of chemoresistance by repressing the hyperglycolytic behavior of malignant cells via modulated expression of metabolic enzymes (HkII, PFk1, GAPDH, PkM2, LDH, SDH, IDH, and FASN), transporters (GLUT-1, MCT-1, and MCT-4), and their regulators. Along altered constitution of extracellular milieu, these molecular changes culminated into improved drug accumulation, chromatin condensation, and induction of cell death. | |||
| Drug Sensitivity Data Categorized by Their Corresponding Mechanisms | ||||
|
|
||||
| Disease Class: Hepatocellular carcinoma [ICD-11: 2C12.2] | [3] | |||
| Sensitive Disease | Hepatocellular carcinoma [ICD-11: 2C12.2] | |||
| Sensitive Drug | Fluorouracil | |||
| Molecule Alteration | Expression | Down-regulation |
||
| Experimental Note | Revealed Based on the Cell Line Data | |||
| Cell Pathway Regulation | Cell proliferation | Inhibition | hsa05200 | |
| In Vitro Model | HepG2 cells | Liver | Homo sapiens (Human) | CVCL_0027 |
| THLE-2 cells | Liver | Homo sapiens (Human) | CVCL_3803 | |
| THLE-3 cells | Liver | Homo sapiens (Human) | CVCL_3804 | |
| Experiment for Molecule Alteration |
Western blot analysis | |||
| Experiment for Drug Resistance |
MTT assay | |||
| Mechanism Description | Compared with 5-FU-sensitive cells, 5-FU-resistant cells exhibited reduced expression levels of miR-125b, and transfection of pre-miR-125b into liver cancer cells resulted in an increased sensitivity of 5-FU-resistant cells to 5-FU. Since drug resistance is a phenotype of malignant cancer cells, the finding that miR-125b expression levels are negatively correlated with 5-FU resistance in HCC cells is consistent with the reported functions of miR-125b. In addition, 5-FU-resistant cells exhibited higher glucose metabolic activity than 5-FU-sensitive cells, and miR-125 was identified to downregulate glucose metabolism by directly targeting Hk II. These results identified miR-125b as a tumor suppressor-like microRNA, which has great potential as a diagnostic and prognostic biomarker. | |||
| Drug Sensitivity Data Categorized by Their Corresponding Mechanisms | ||||
|
|
||||
| Disease Class: Chronic myeloid leukemia [ICD-11: 2A20.0] | [4] | |||
| Sensitive Disease | Chronic myeloid leukemia [ICD-11: 2A20.0] | |||
| Sensitive Drug | Imatinib | |||
| Molecule Alteration | Expression | Down-regulation |
||
| Experimental Note | Revealed Based on the Cell Line Data | |||
| Cell Pathway Regulation | Cell viability | Activation | hsa05200 | |
| In Vitro Model | HL60 cells | Peripheral blood | Homo sapiens (Human) | CVCL_0002 |
| K562 cells | Blood | Homo sapiens (Human) | CVCL_0004 | |
| Ku812 cells | Bone marrow | Homo sapiens (Human) | CVCL_0379 | |
| KCL-22 cells | Bone marrow | Homo sapiens (Human) | CVCL_2091 | |
| EM2 cells | Bone | Homo sapiens (Human) | CVCL_1196 | |
| EM3 cells | Bone | Homo sapiens (Human) | CVCL_2033 | |
| LAMA 84 cells | Bone | Homo sapiens (Human) | CVCL_0388 | |
| Experiment for Molecule Alteration |
Western blot analysis | |||
| Experiment for Drug Resistance |
MTT assay; BrdU assay; Caspase-3 assay | |||
| Mechanism Description | Overexpression of miR-202 sensitized imatinib resistant CML through the miR-202-mediated glycolysis inhibition by targetting Hk2. | |||
| Drug Resistance Data Categorized by Their Corresponding Mechanisms | ||||
|
|
||||
| Disease Class: Breast cancer [ICD-11: 2C60.3] | [5] | |||
| Resistant Disease | Breast cancer [ICD-11: 2C60.3] | |||
| Resistant Drug | Tamoxifen | |||
| Molecule Alteration | Expression | Up-regulation |
||
| Experimental Note | Revealed Based on the Cell Line Data | |||
| Mechanism Description | Hk2, PFkB3, ENO-1, and PkM-2 are the main enzymes of glycolysis and their expression is upregulated in TAMR cells. Hk2 is also involved in the activation of pro-survival autophagy. ENO-1 plays an important role by inhibiting apoptosis via downregulation of c-Myc. In mitochondria, PDk4 phosphorylation regulate Pyruvate dehydrogenase of PDC. NSD2 activates Hk-2, G6PD, and TIGAR expression and upregulates the PPP pathway. PPP produces NADH and Ribulose 5-Phosphate, a substrate for nucleotide biosynthesis. NADH reduces ROS and inhibits apoptosis. LDHA overexpression helps in aerobic glycolysis and indirectly promotes autophagy. To reduce the concentration of lactate in the cells, MCT expression is increased, which facilitates the efflux of lactate and cell survival. | |||
Disease- and Tissue-specific Abundances of This Molecule
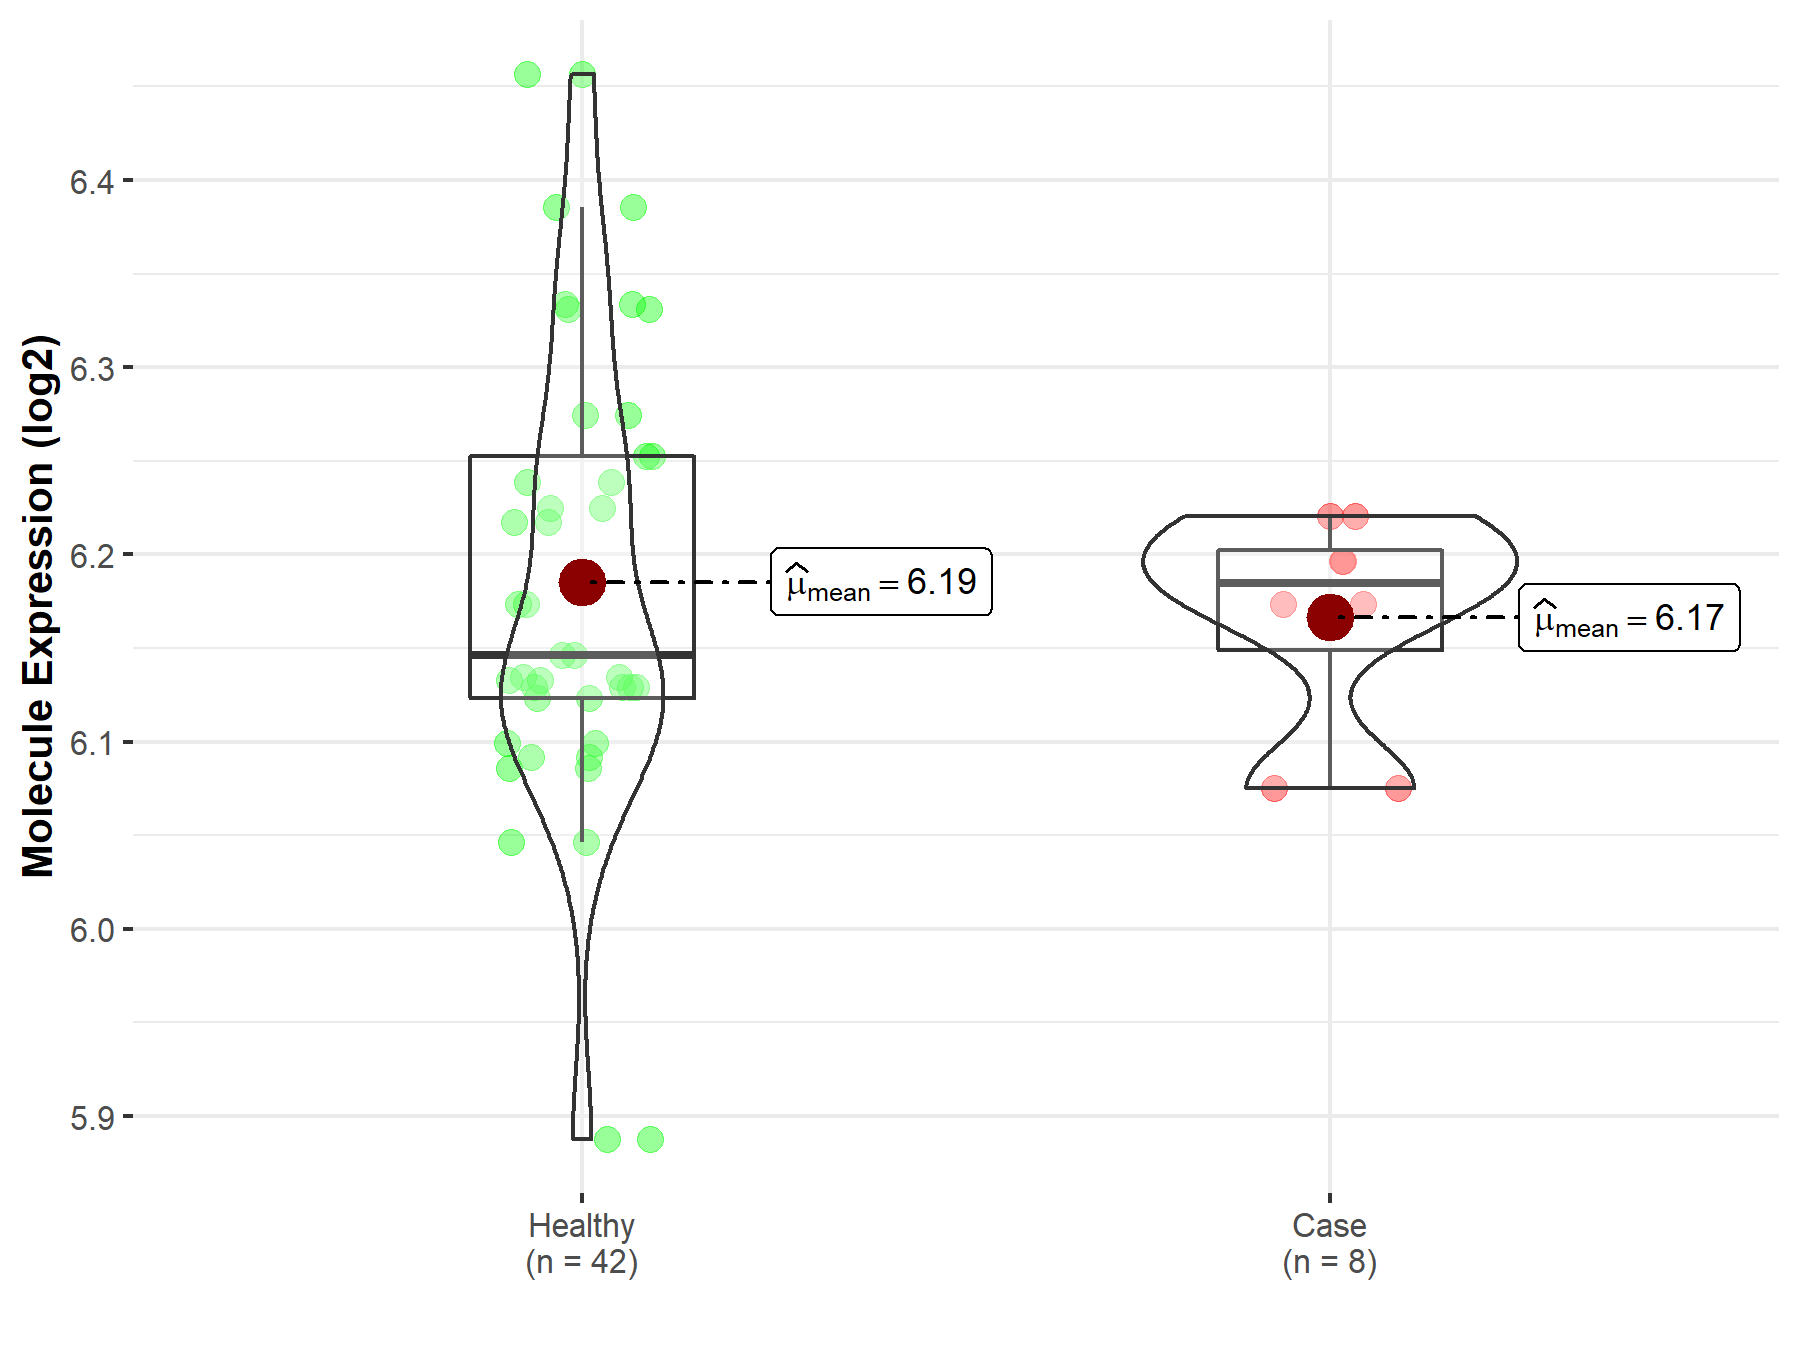
ICD Disease Classification 02

| Differential expression of molecule in resistant diseases | ||
| The Studied Tissue | Whole blood | |
| The Specified Disease | Myelofibrosis | |
| The Expression Level of Disease Section Compare with the Healthy Individual Tissue | p-value: 5.11E-01; Fold-change: 3.88E-02; Z-score: 3.08E-01 | |
|
Molecule expression in the diseased tissue of patients
Molecule expression in the normal tissue of healthy individuals
|
||
| Disease-specific Molecule Abundances |

|
Click to View the Clearer Original Diagram |
| The Studied Tissue | Whole blood | |
| The Specified Disease | Polycythemia vera | |
| The Expression Level of Disease Section Compare with the Healthy Individual Tissue | p-value: 1.68E-06; Fold-change: 1.40E-01; Z-score: 1.05E+00 | |
|
Molecule expression in the diseased tissue of patients
Molecule expression in the normal tissue of healthy individuals
|
||
| Disease-specific Molecule Abundances |

|
Click to View the Clearer Original Diagram |
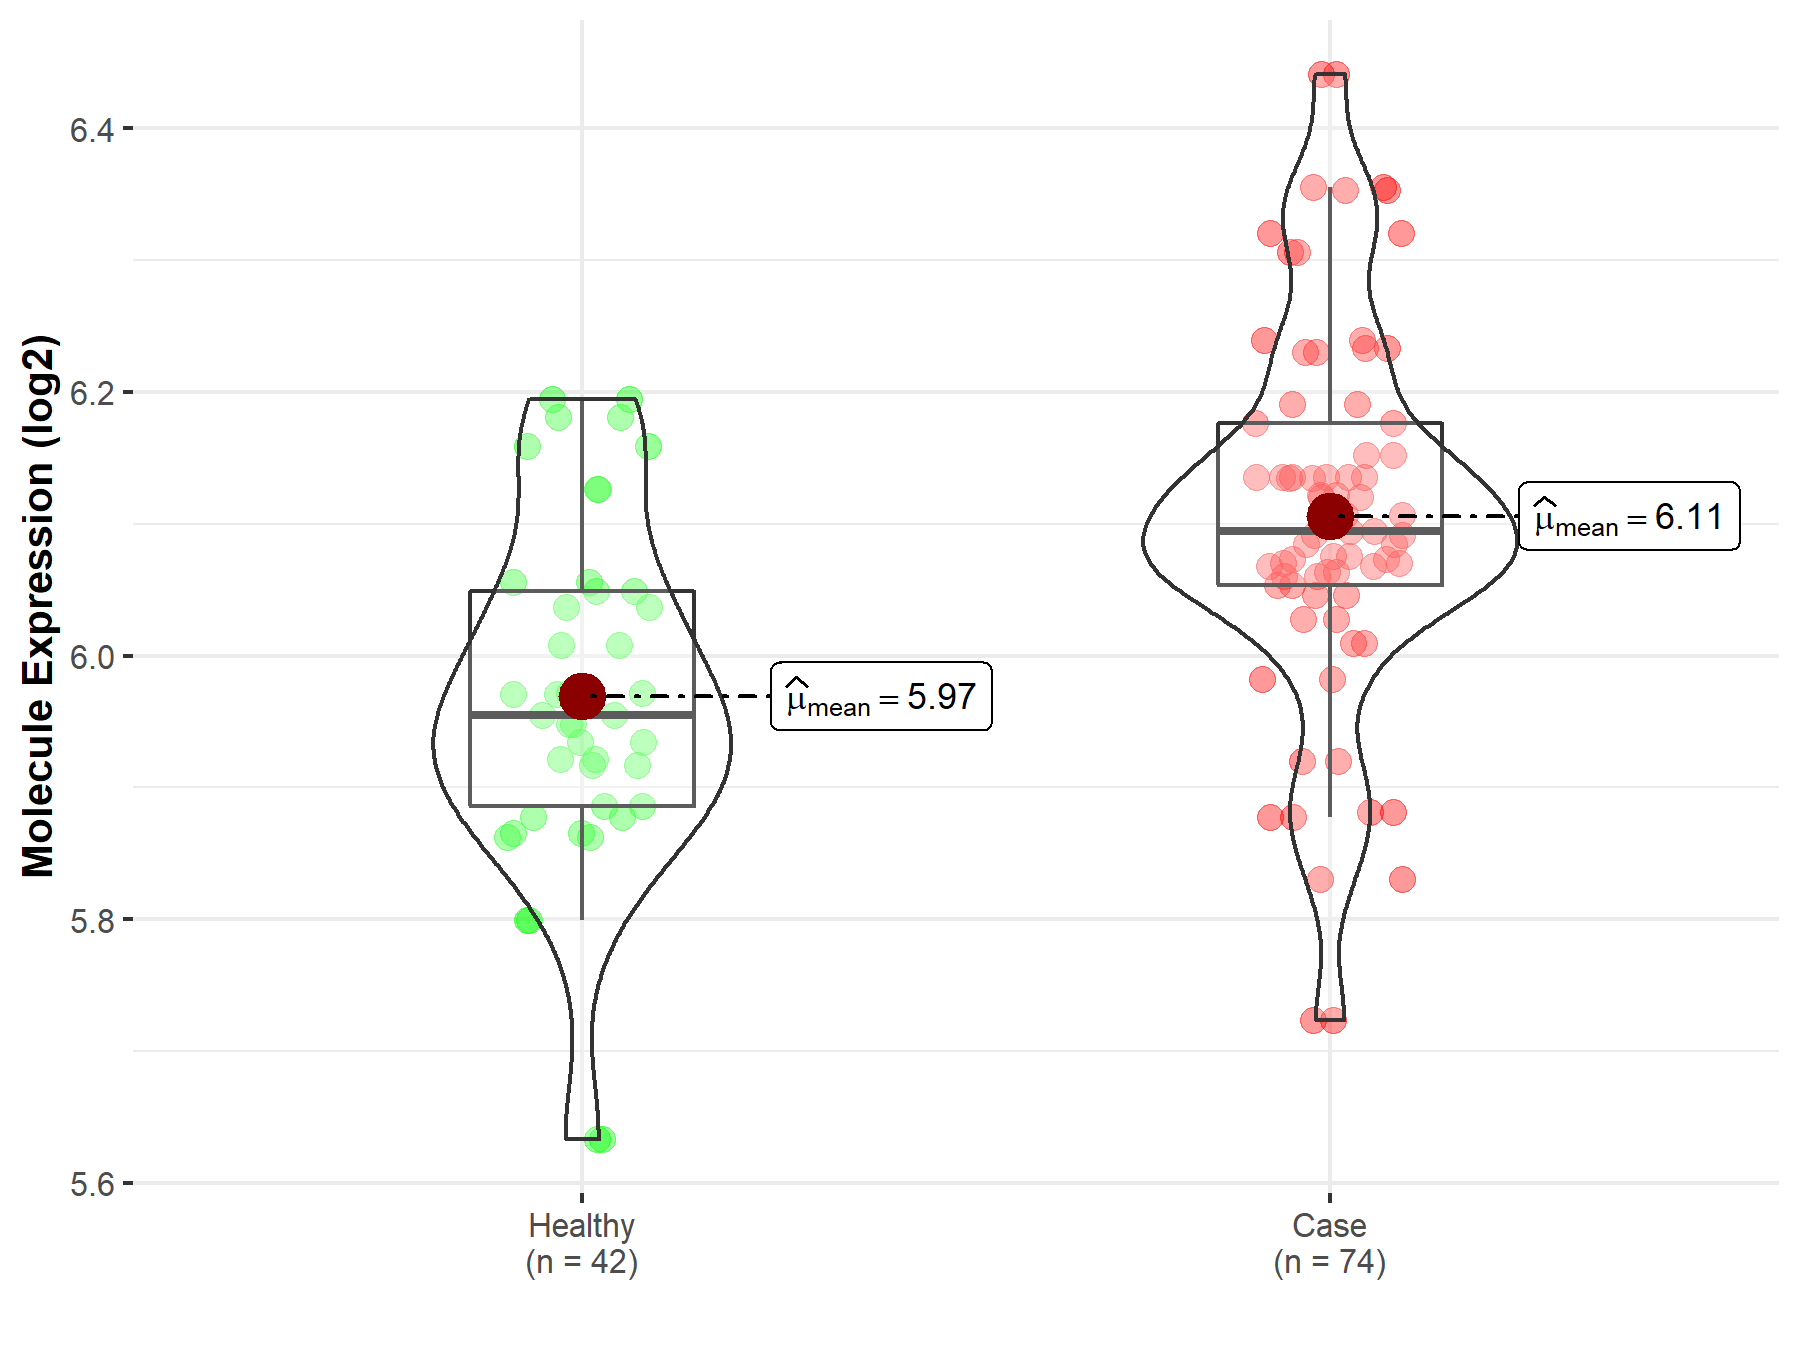
| Differential expression of molecule in resistant diseases | ||
| The Studied Tissue | Bone marrow | |
| The Specified Disease | Acute myeloid leukemia | |
| The Expression Level of Disease Section Compare with the Healthy Individual Tissue | p-value: 1.29E-13; Fold-change: 2.34E-01; Z-score: 7.37E-01 | |
|
Molecule expression in the diseased tissue of patients
Molecule expression in the normal tissue of healthy individuals
|
||
| Disease-specific Molecule Abundances |

|
Click to View the Clearer Original Diagram |
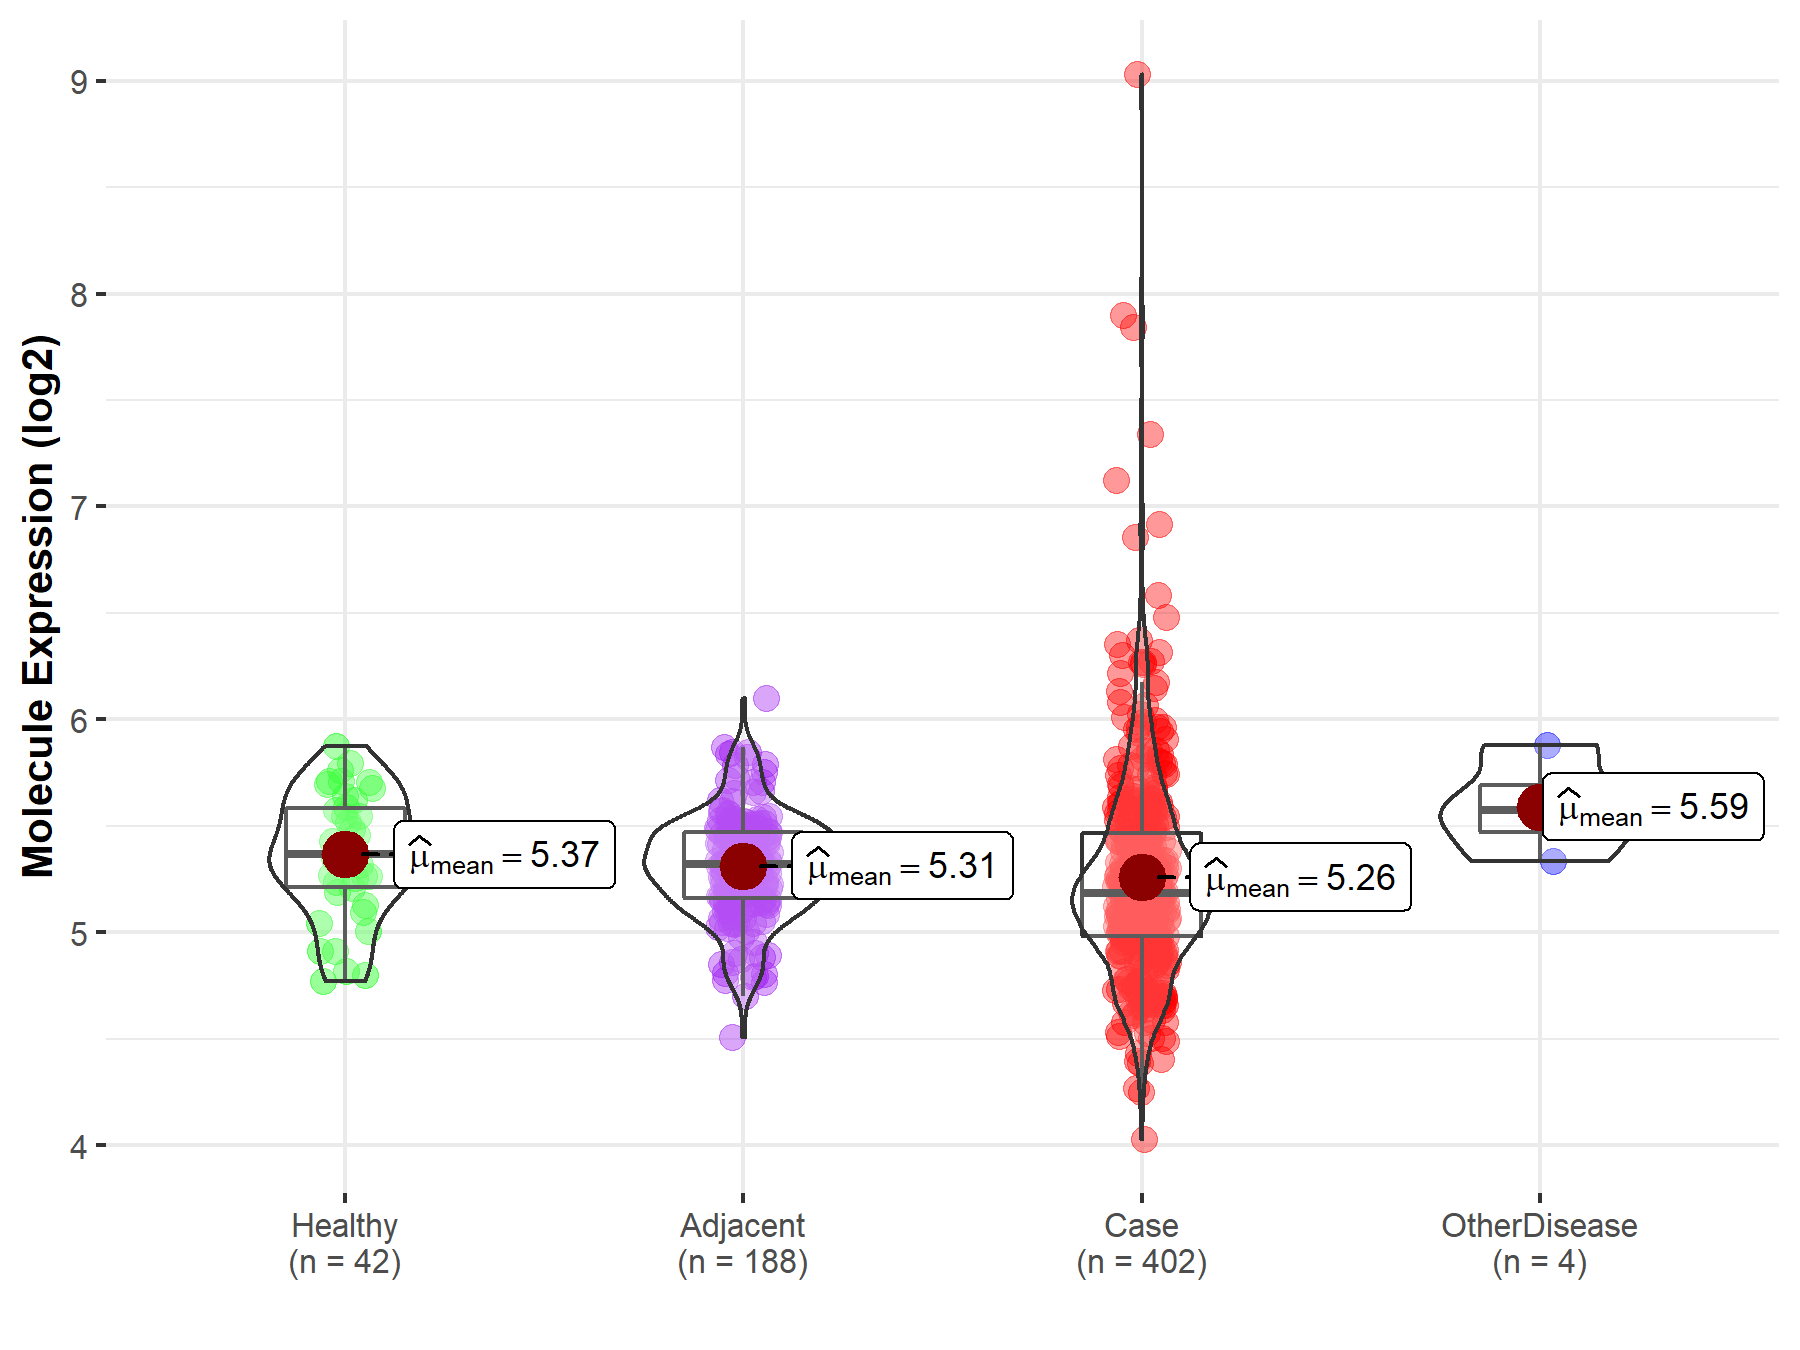
| Differential expression of molecule in resistant diseases | ||
| The Studied Tissue | Liver | |
| The Specified Disease | Liver cancer | |
| The Expression Level of Disease Section Compare with the Healthy Individual Tissue | p-value: 4.45E-02; Fold-change: -1.82E-01; Z-score: -6.34E-01 | |
| The Expression Level of Disease Section Compare with the Adjacent Tissue | p-value: 9.80E-02; Fold-change: -1.33E-01; Z-score: -5.37E-01 | |
| The Expression Level of Disease Section Compare with the Other Disease Section | p-value: 5.99E-02; Fold-change: -3.87E-01; Z-score: -1.69E+00 | |
|
Molecule expression in the normal tissue adjacent to the diseased tissue of patients
Molecule expression in the diseased tissue of patients
Molecule expression in the normal tissue of healthy individuals
Molecule expression in tissue other than the diseased tissue of patients
|
||
| Disease-specific Molecule Abundances |

|
Click to View the Clearer Original Diagram |
| Differential expression of molecule in resistant diseases | ||
| The Studied Tissue | Breast tissue | |
| The Specified Disease | Breast cancer | |
| The Expression Level of Disease Section Compare with the Healthy Individual Tissue | p-value: 1.45E-24; Fold-change: -2.85E-01; Z-score: -6.18E-01 | |
| The Expression Level of Disease Section Compare with the Adjacent Tissue | p-value: 6.90E-03; Fold-change: -1.52E-01; Z-score: -1.70E-01 | |
|
Molecule expression in the normal tissue adjacent to the diseased tissue of patients
Molecule expression in the diseased tissue of patients
Molecule expression in the normal tissue of healthy individuals
|
||
| Disease-specific Molecule Abundances |

|
Click to View the Clearer Original Diagram |
Tissue-specific Molecule Abundances in Healthy Individuals


|
||
References
If you find any error in data or bug in web service, please kindly report it to Dr. Sun and Dr. Yu.
