Molecule Information
General Information of the Molecule (ID: Mol00406)
| Name |
Histone deacetylase 4 (HDAC4)
,Homo sapiens
|
||||
|---|---|---|---|---|---|
| Synonyms |
HD4; KIAA0288
Click to Show/Hide
|
||||
| Molecule Type |
Protein
|
||||
| Gene Name |
HDAC4
|
||||
| Gene ID | |||||
| Location |
chr2:239048168-239401654[-]
|
||||
| Sequence |
MSSQSHPDGLSGRDQPVELLNPARVNHMPSTVDVATALPLQVAPSAVPMDLRLDHQFSLP
VAEPALREQQLQQELLALKQKQQIQRQILIAEFQRQHEQLSRQHEAQLHEHIKQQQEMLA MKHQQELLEHQRKLERHRQEQELEKQHREQKLQQLKNKEKGKESAVASTEVKMKLQEFVL NKKKALAHRNLNHCISSDPRYWYGKTQHSSLDQSSPPQSGVSTSYNHPVLGMYDAKDDFP LRKTASEPNLKLRSRLKQKVAERRSSPLLRRKDGPVVTALKKRPLDVTDSACSSAPGSGP SSPNNSSGSVSAENGIAPAVPSIPAETSLAHRLVAREGSAAPLPLYTSPSLPNITLGLPA TGPSAGTAGQQDAERLTLPALQQRLSLFPGTHLTPYLSTSPLERDGGAAHSPLLQHMVLL EQPPAQAPLVTGLGALPLHAQSLVGADRVSPSIHKLRQHRPLGRTQSAPLPQNAQALQHL VIQQQHQQFLEKHKQQFQQQQLQMNKIIPKPSEPARQPESHPEETEEELREHQALLDEPY LDRLPGQKEAHAQAGVQVKQEPIESDEEEAEPPREVEPGQRQPSEQELLFRQQALLLEQQ RIHQLRNYQASMEAAGIPVSFGGHRPLSRAQSSPASATFPVSVQEPPTKPRFTTGLVYDT LMLKHQCTCGSSSSHPEHAGRIQSIWSRLQETGLRGKCECIRGRKATLEELQTVHSEAHT LLYGTNPLNRQKLDSKKLLGSLASVFVRLPCGGVGVDSDTIWNEVHSAGAARLAVGCVVE LVFKVATGELKNGFAVVRPPGHHAEESTPMGFCYFNSVAVAAKLLQQRLSVSKILIVDWD VHHGNGTQQAFYSDPSVLYMSLHRYDDGNFFPGSGAPDEVGTGPGVGFNVNMAFTGGLDP PMGDAEYLAAFRTVVMPIASEFAPDVVLVSSGFDAVEGHPTPLGGYNLSARCFGYLTKQL MGLAGGRIVLALEGGHDLTAICDASEACVSALLGNELDPLPEKVLQQRPNANAVRSMEKV MEIHSKYWRCLQRTTSTAGRSLIEAQTCENEEAETVTAMASLSVGVKPAEKRPDEEPMEE EPPL Click to Show/Hide
|
||||
| 3D-structure |
|
||||
| Function |
Responsible for the deacetylation of lysine residues on the N-terminal part of the core histones (H2A, H2B, H3 and H4). Histone deacetylation gives a tag for epigenetic repression and plays an important role in transcriptional regulation, cell cycle progression and developmental events. Histone deacetylases act via the formation of large multiprotein complexes. Involved in muscle maturation via its interaction with the myocyte enhancer factors such as MEF2A, MEF2C and MEF2D. Involved in the MTA1-mediated epigenetic regulation of ESR1 expression in breast cancer. Deacetylates HSPA1A and HSPA1B at 'Lys-77' leading to their preferential binding to co-chaperone STUB1.
Click to Show/Hide
|
||||
| Uniprot ID | |||||
| Ensembl ID | |||||
| HGNC ID | |||||
| Click to Show/Hide the Complete Species Lineage | |||||
Type(s) of Resistant Mechanism of This Molecule
Drug Resistance Data Categorized by Drug
Approved Drug(s)
3 drug(s) in total
| Drug Sensitivity Data Categorized by Their Corresponding Mechanisms | ||||
|
|
||||
| Disease Class: Colon cancer [ICD-11: 2B90.1] | [1] | |||
| Sensitive Disease | Colon cancer [ICD-11: 2B90.1] | |||
| Sensitive Drug | Fluorouracil | |||
| Molecule Alteration | Expression | Down-regulation |
||
| Differential expression of the molecule in resistant disease | ||||
| Classification of Disease | Colon cancer [ICD-11: 2B90] | |||
| The Specified Disease | Colon cancer | |||
| The Studied Tissue | Colon tissue | |||
| The Expression Level of Disease Section Compare with the Healthy Individual Tissue | p-value: 9.80E-14 Fold-change: -3.79E-01 Z-score: -8.17E+00 |
|||
| Experimental Note | Revealed Based on the Cell Line Data | |||
| Cell Pathway Regulation | Cell proliferation | Inhibition | hsa05200 | |
| In Vitro Model | HCT116 cells | Colon | Homo sapiens (Human) | CVCL_0291 |
| Experiment for Molecule Alteration |
Western blot analysis; Immunofluorescence analysis | |||
| Experiment for Drug Resistance |
WST-1 assay | |||
| Mechanism Description | miR-140 is involved in the chemoresistance by reduced cell proliferation via G1 and G2 phase arrest mediated in part. | |||
| Disease Class: Osteosarcoma [ICD-11: 2B51.0] | [1] | |||
| Sensitive Disease | Osteosarcoma [ICD-11: 2B51.0] | |||
| Sensitive Drug | Fluorouracil | |||
| Molecule Alteration | Expression | Down-regulation |
||
| Experimental Note | Revealed Based on the Cell Line Data | |||
| Cell Pathway Regulation | Cell proliferation | Inhibition | hsa05200 | |
| In Vitro Model | MG63 cells | Bone marrow | Homo sapiens (Human) | CVCL_0426 |
| U2OS cells | Bone | Homo sapiens (Human) | CVCL_0042 | |
| Experiment for Molecule Alteration |
Western blot analysis; Immunofluorescence analysis | |||
| Experiment for Drug Resistance |
WST-1 assay | |||
| Mechanism Description | miR-140 is involved in the chemoresistance by reduced cell proliferation via G1 and G2 phase arrest mediated in part. | |||
| Drug Sensitivity Data Categorized by Their Corresponding Mechanisms | ||||
|
|
||||
| Disease Class: Colon cancer [ICD-11: 2B90.1] | [1] | |||
| Sensitive Disease | Colon cancer [ICD-11: 2B90.1] | |||
| Sensitive Drug | Methotrexate | |||
| Molecule Alteration | Expression | Down-regulation |
||
| Differential expression of the molecule in resistant disease | ||||
| Classification of Disease | Colon cancer [ICD-11: 2B90] | |||
| The Specified Disease | Colon cancer | |||
| The Studied Tissue | Colon tissue | |||
| The Expression Level of Disease Section Compare with the Healthy Individual Tissue | p-value: 9.80E-14 Fold-change: -3.79E-01 Z-score: -8.17E+00 |
|||
| Experimental Note | Revealed Based on the Cell Line Data | |||
| Cell Pathway Regulation | Cell proliferation | Inhibition | hsa05200 | |
| In Vitro Model | HCT116 cells | Colon | Homo sapiens (Human) | CVCL_0291 |
| Experiment for Molecule Alteration |
Western blot analysis; Immunofluorescence analysis | |||
| Experiment for Drug Resistance |
WST-1 assay | |||
| Mechanism Description | miR-140 is involved in the chemoresistance by reduced cell proliferation via G1 and G2 phase arrest mediated in part. | |||
| Disease Class: Osteosarcoma [ICD-11: 2B51.0] | [1] | |||
| Sensitive Disease | Osteosarcoma [ICD-11: 2B51.0] | |||
| Sensitive Drug | Methotrexate | |||
| Molecule Alteration | Expression | Down-regulation |
||
| Experimental Note | Revealed Based on the Cell Line Data | |||
| Cell Pathway Regulation | Cell proliferation | Inhibition | hsa05200 | |
| In Vitro Model | MG63 cells | Bone marrow | Homo sapiens (Human) | CVCL_0426 |
| U2OS cells | Bone | Homo sapiens (Human) | CVCL_0042 | |
| Experiment for Molecule Alteration |
Western blot analysis; Immunofluorescence analysis | |||
| Experiment for Drug Resistance |
WST-1 assay | |||
| Mechanism Description | miR-140 is involved in the chemoresistance by reduced cell proliferation via G1 and G2 phase arrest mediated in part. | |||
| Drug Resistance Data Categorized by Their Corresponding Mechanisms | ||||
|
|
||||
| Disease Class: Breast cancer [ICD-11: 2C60.3] | [2] | |||
| Resistant Disease | Breast cancer [ICD-11: 2C60.3] | |||
| Resistant Drug | Tamoxifen | |||
| Molecule Alteration | Expression | Down-regulation |
||
| Differential expression of the molecule in resistant disease | ||||
| Classification of Disease | Breast cancer [ICD-11: 2C60] | |||
| The Specified Disease | Breast cancer | |||
| The Studied Tissue | Breast tissue | |||
| The Expression Level of Disease Section Compare with the Healthy Individual Tissue | p-value: 1.48E-37 Fold-change: -1.85E-01 Z-score: -1.45E+01 |
|||
| Experimental Note | Revealed Based on the Cell Line Data | |||
| Cell Pathway Regulation | Cell invasion | Activation | hsa05200 | |
| Cell migration | Activation | hsa04670 | ||
| In Vitro Model | MCF-7 cells | Breast | Homo sapiens (Human) | CVCL_0031 |
| T47D cells | Breast | Homo sapiens (Human) | CVCL_0553 | |
| Experiment for Molecule Alteration |
Western blot analysis | |||
| Experiment for Drug Resistance |
MTT assay; Transwell assay | |||
| Mechanism Description | Over-expression of miR-10b in ER-positive MCF-7 and T47D cells led to increased resistance to tamoxifen and an attenuation of tamoxifen-mediated inhibition of migration, whereas down-regulation of miR-10b in MCF7TR cells resulted in increased sensitivity to tamoxifen. Luciferase assays identified HDAC4 as a direct target of miR-10b. In MCF7TR cells, we observed down-regulation of HDAC4 by miR-10b. HDAC4-specific siRNA-mediated inactivation of HDAC4 in MCF-7 cells led to acquisition of tamoxifen resistance, and, moreover, reduction of HDAC4 in MCF7TR cells by HDAC4-specific siRNA transfection resulted in further enhancement of tamoxifen-resistance. | |||
Disease- and Tissue-specific Abundances of This Molecule
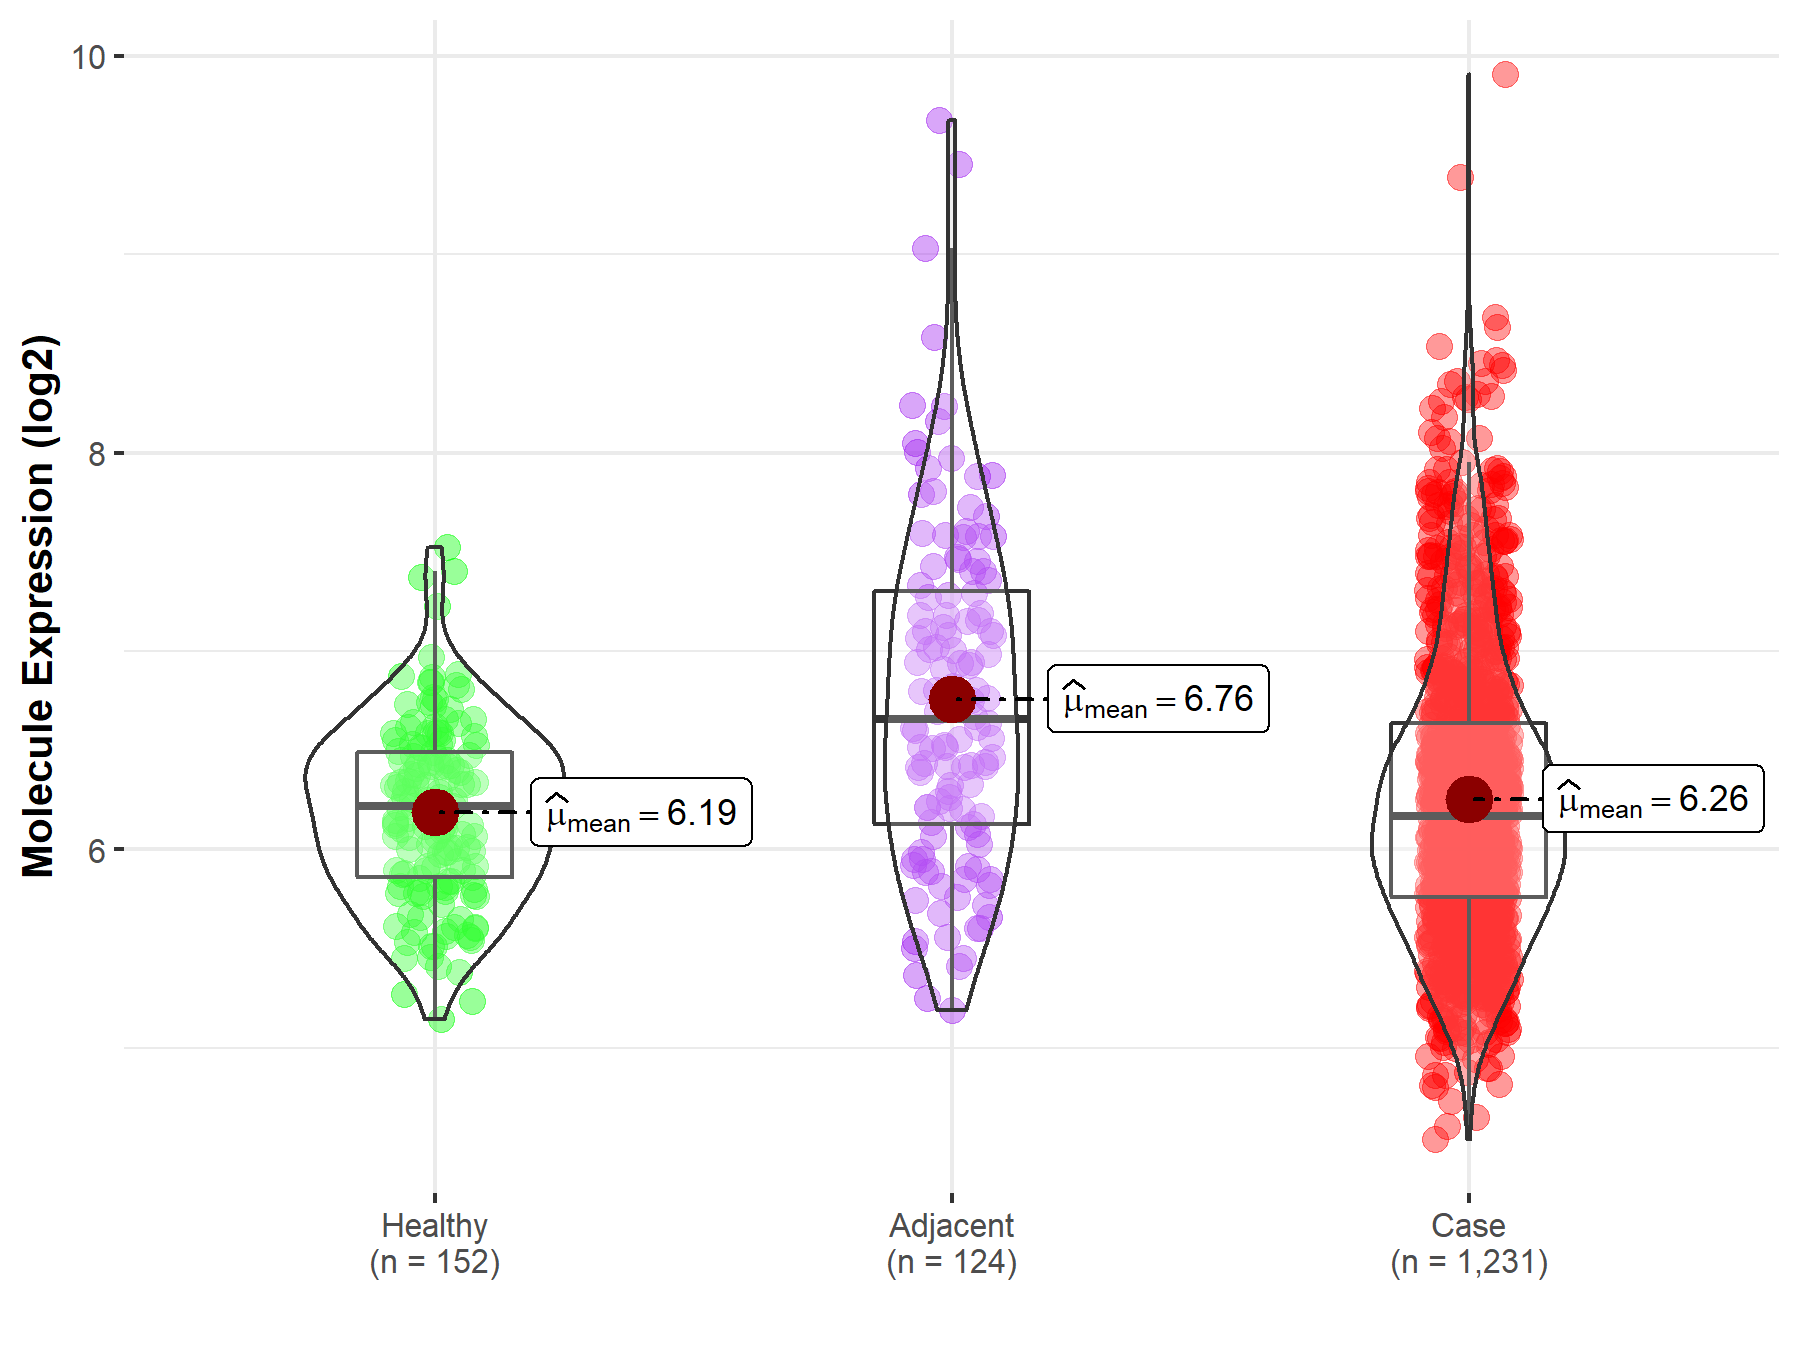
ICD Disease Classification 02

| Differential expression of molecule in resistant diseases | ||
| The Studied Tissue | Colon | |
| The Specified Disease | Colon cancer | |
| The Expression Level of Disease Section Compare with the Healthy Individual Tissue | p-value: 1.05E-01; Fold-change: -4.70E-02; Z-score: -1.05E-01 | |
| The Expression Level of Disease Section Compare with the Adjacent Tissue | p-value: 4.15E-09; Fold-change: -4.85E-01; Z-score: -5.61E-01 | |
|
Molecule expression in the normal tissue adjacent to the diseased tissue of patients
Molecule expression in the diseased tissue of patients
Molecule expression in the normal tissue of healthy individuals
|
||
| Disease-specific Molecule Abundances |

|
Click to View the Clearer Original Diagram |
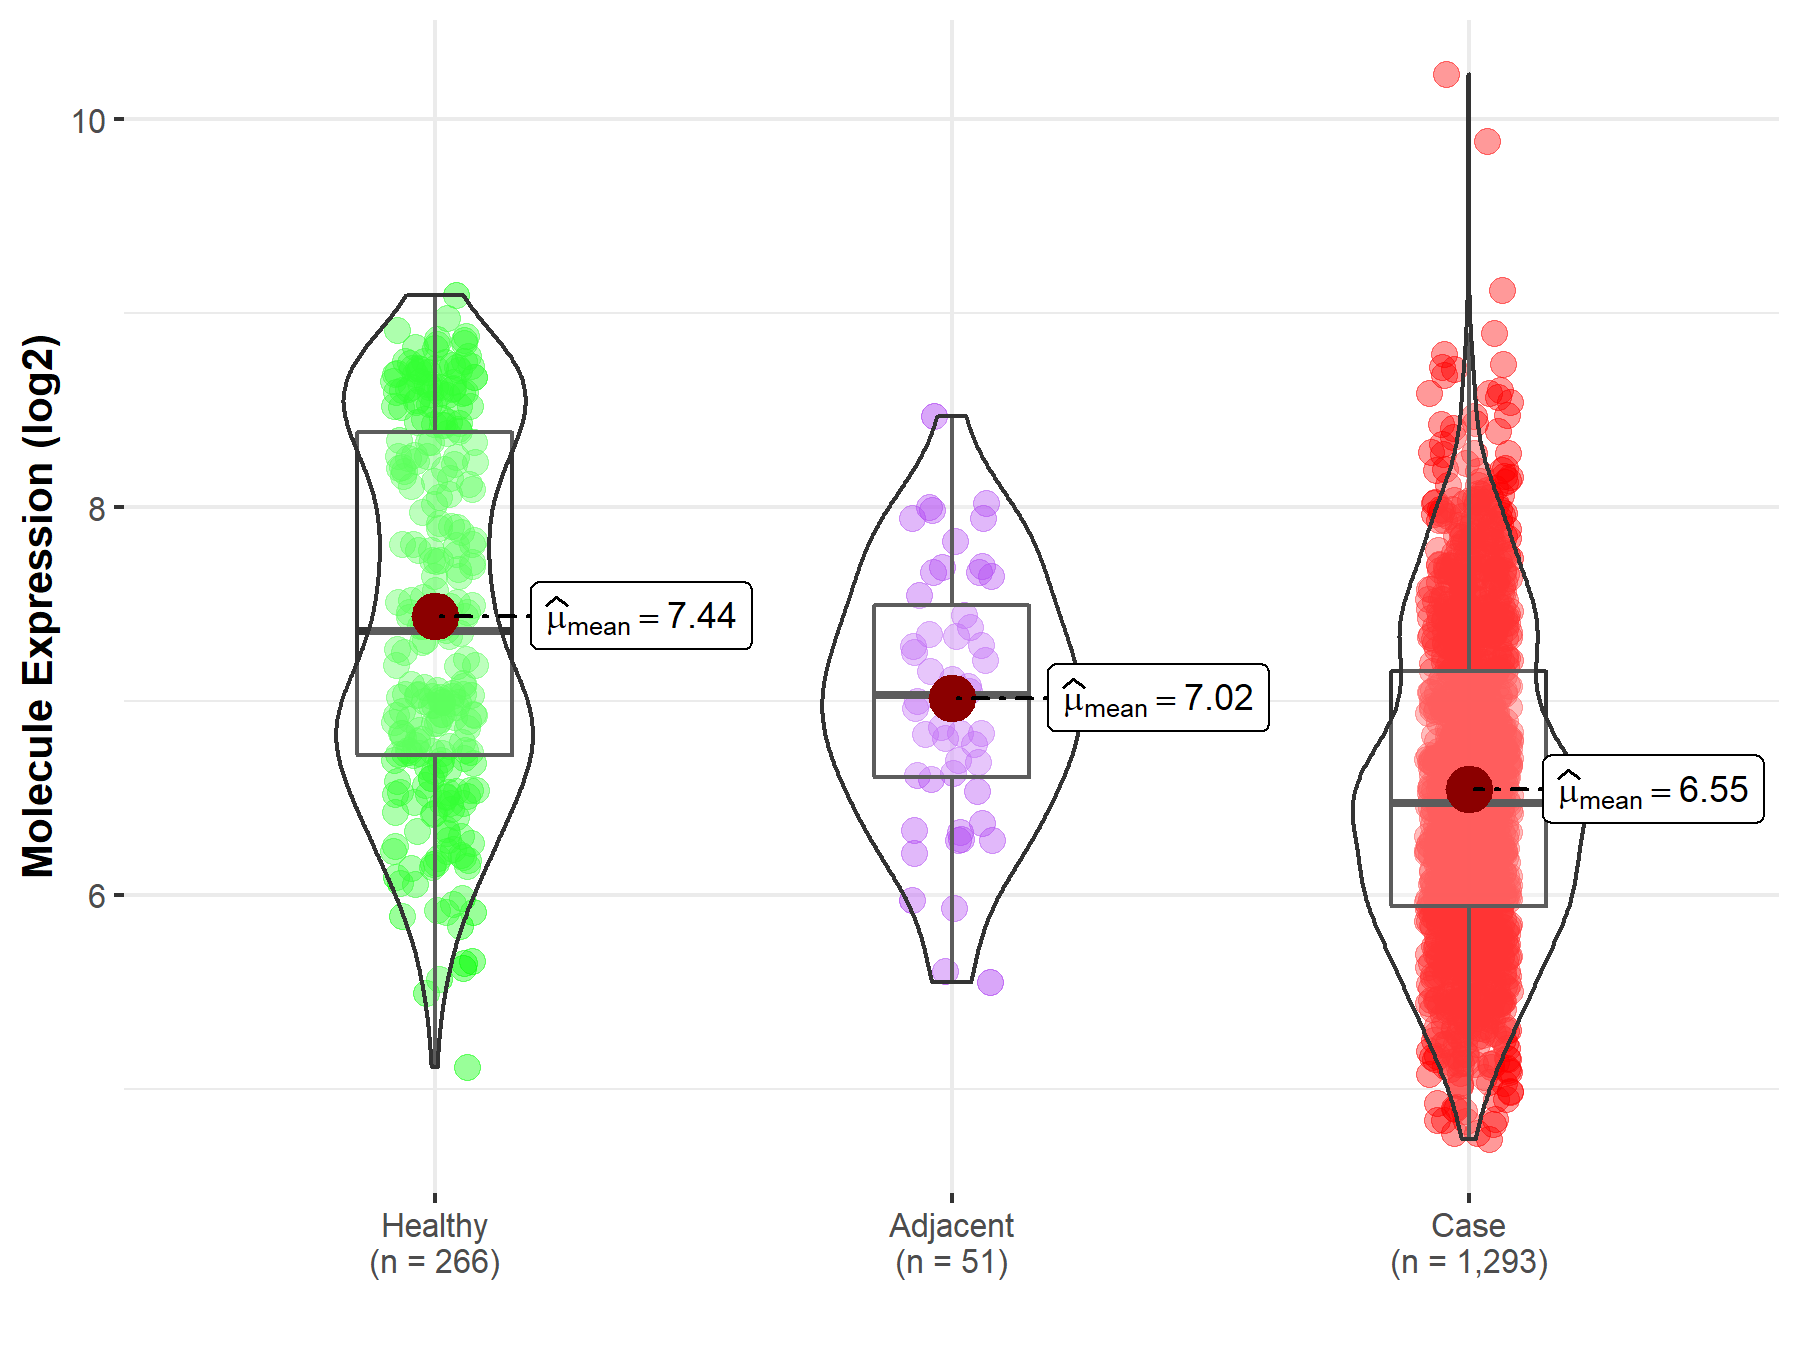
| Differential expression of molecule in resistant diseases | ||
| The Studied Tissue | Breast tissue | |
| The Specified Disease | Breast cancer | |
| The Expression Level of Disease Section Compare with the Healthy Individual Tissue | p-value: 1.48E-37; Fold-change: -8.84E-01; Z-score: -9.44E-01 | |
| The Expression Level of Disease Section Compare with the Adjacent Tissue | p-value: 7.19E-06; Fold-change: -5.54E-01; Z-score: -8.40E-01 | |
|
Molecule expression in the normal tissue adjacent to the diseased tissue of patients
Molecule expression in the diseased tissue of patients
Molecule expression in the normal tissue of healthy individuals
|
||
| Disease-specific Molecule Abundances |

|
Click to View the Clearer Original Diagram |
Tissue-specific Molecule Abundances in Healthy Individuals


|
||
References
If you find any error in data or bug in web service, please kindly report it to Dr. Sun and Dr. Yu.
