Molecule Information
General Information of the Molecule (ID: Mol00393)
| Name |
Golgi phosphoprotein 3 (GOLPH3)
,Homo sapiens
|
||||
|---|---|---|---|---|---|
| Synonyms |
Coat protein GPP34; Mitochondrial DNA absence factor; MIDAS; GPP34
Click to Show/Hide
|
||||
| Molecule Type |
Protein
|
||||
| Gene Name |
GOLPH3
|
||||
| Gene ID | |||||
| Location |
chr5:32124716-32174319[-]
|
||||
| Sequence |
MTSLTQRSSGLVQRRTEASRNAADKERAAGGGAGSSEDDAQSRRDEQDDDDKGDSKETRL
TLMEEVLLLGLKDREGYTSFWNDCISSGLRGCMLIELALRGRLQLEACGMRRKSLLTRKV ICKSDAPTGDVLLDEALKHVKETQPPETVQNWIELLSGETWNPLKLHYQLRNVRERLAKN LVEKGVLTTEKQNFLLFDMTTHPLTNNNIKQRLIKKVQEAVLDKWVNDPHRMDRRLLALI YLAHASDVLENAFAPLLDEQYDLATKRVRQLLDLDPEVECLKANTNEVLWAVVAAFTK Click to Show/Hide
|
||||
| 3D-structure |
|
||||
| Function |
Phosphatidylinositol-4-phosphate-binding protein that links Golgi membranes to the cytoskeleton and may participate in the tensile force required for vesicle budding from the Golgi. Thereby, may play a role in Golgi membrane trafficking and could indirectly give its flattened shape to the Golgi apparatus. May also bind to the coatomer to regulate Golgi membrane trafficking. May play a role in anterograde transport from the Golgi to the plasma membrane and regulate secretion. Has also been involved in the control of the localization of Golgi enzymes through interaction with their cytoplasmic part. May play an indirect role in cell migration. Has also been involved in the modulation of mTOR signaling. May also be involved in the regulation of mitochondrial lipids biosynthesis.
Click to Show/Hide
|
||||
| Uniprot ID | |||||
| Ensembl ID | |||||
| HGNC ID | |||||
| Click to Show/Hide the Complete Species Lineage | |||||
Type(s) of Resistant Mechanism of This Molecule
 EADR: Epigenetic Alteration of DNA, RNA or Protein
 UAPP: Unusual Activation of Pro-survival Pathway
Drug Resistance Data Categorized by Drug
Approved Drug(s)
3 drug(s) in total
| Drug Sensitivity Data Categorized by Their Corresponding Mechanisms | ||||
|
Unusual Activation of Pro-survival Pathway (UAPP)
|
||||
| Disease Class: Glioblastoma [ICD-11: 2A00.02] | [1] | |||
| Sensitive Disease | Glioblastoma [ICD-11: 2A00.02] | |||
| Sensitive Drug | Temozolomide | |||
| Molecule Alteration | Expression | Up-regulation |
||
| Differential expression of the molecule in resistant disease | ||||
| Classification of Disease | Brain cancer [ICD-11: 2A00] | |||
| The Specified Disease | Brain cancer | |||
| The Studied Tissue | Nervous tissue | |||
| The Expression Level of Disease Section Compare with the Healthy Individual Tissue | p-value: 2.21E-136 Fold-change: 9.39E-02 Z-score: 3.00E+01 |
|||
| Experimental Note | Revealed Based on the Cell Line Data | |||
| Cell Pathway Regulation | Cell apoptosis | Activation | hsa04210 | |
| Cell formation | Inhibition | hsa05200 | ||
| Cell invasion | Inhibition | hsa05200 | ||
| MAPK/ERK signaling pathway | Inhibition | hsa04010 | ||
| In Vitro Model | U251 cells | Brain | Homo sapiens (Human) | CVCL_0021 |
| A172 cells | Brain | Homo sapiens (Human) | CVCL_0131 | |
| SNB19 cells | Brain | Homo sapiens (Human) | CVCL_0535 | |
| T98G cells | Brain | Homo sapiens (Human) | CVCL_0556 | |
| LN308 cells | Brain | Homo sapiens (Human) | CVCL_0394 | |
| In Vivo Model | Nude mouse xenograft model | Mus musculus | ||
| Experiment for Molecule Alteration |
Western blot analysis | |||
| Experiment for Drug Resistance |
Flow cytometry assay | |||
| Mechanism Description | Inhibition of microRNA-299-5p sensitizes glioblastoma cells to temozolomide via upregulating GOLPH3 and inactivating the MAPk/ERk signaling pathway. | |||
| Drug Resistance Data Categorized by Their Corresponding Mechanisms | ||||
|
Unusual Activation of Pro-survival Pathway (UAPP)
|
||||
| Disease Class: Ovarian cancer [ICD-11: 2C73.0] | [2] | |||
| Resistant Disease | Ovarian cancer [ICD-11: 2C73.0] | |||
| Resistant Drug | Cisplatin | |||
| Molecule Alteration | Expression | Up-regulation |
||
| Differential expression of the molecule in resistant disease | ||||
| Classification of Disease | Ovarian cancer [ICD-11: 2C73] | |||
| The Specified Disease | Ovarian cancer | |||
| The Studied Tissue | Ovarian tissue | |||
| The Expression Level of Disease Section Compare with the Healthy Individual Tissue | p-value: 3.48E-03 Fold-change: 8.57E-02 Z-score: 4.05E+00 |
|||
| Experimental Note | Identified from the Human Clinical Data | |||
| Cell Pathway Regulation | Cell viability | Regulation | N.A. | |
| In Vitro Model | SkOV3 cells | Ovary | Homo sapiens (Human) | CVCL_0532 |
| HEK293A cells | Kideny | Homo sapiens (Human) | CVCL_6910 | |
| Experiment for Molecule Alteration |
Western blot analysis | |||
| Experiment for Drug Resistance |
CCK8 assay | |||
| Mechanism Description | miR-509-3p expression significantly decreased in patients with platinum-resistance and up-regulation of GOLPH3 and WLS gene expression was observer when cells were transfected with miR-509-3p inhibitor. | |||
|
Epigenetic Alteration of DNA, RNA or Protein (EADR)
|
||||
| Disease Class: Bladder urothelial carcinoma [ICD-11: 2C94.2] | [3] | |||
| Resistant Disease | Bladder urothelial carcinoma [ICD-11: 2C94.2] | |||
| Resistant Drug | Cisplatin | |||
| Molecule Alteration | Expression | Up-regulation |
||
| Experimental Note | Identified from the Human Clinical Data | |||
| In Vitro Model | 5637 cells | Bladder | Homo sapiens (Human) | CVCL_0126 |
| T24 cells | Bladder | Homo sapiens (Human) | CVCL_0554 | |
| In Vivo Model | BALB/c nude mouse xenograft model | Mus musculus | ||
| Experiment for Molecule Alteration |
qRT-PCR; Western blotting assay | |||
| Experiment for Drug Resistance |
CCK8 assay | |||
| Mechanism Description | The expression levels of miR34a were decreased and GOLPH3 were increased in GC chemoresistant UBC cell lines. Down-regulation of miR34a resulted in the overexpression of GOLPH3.The ectopic expression of miR34a decreased the stem cell properties of chemoresistant UBC cells and re-sensitized these cells to GC treatment in vitro and in vivo. | |||
| Drug Resistance Data Categorized by Their Corresponding Mechanisms | ||||
|
Epigenetic Alteration of DNA, RNA or Protein (EADR)
|
||||
| Disease Class: Bladder urothelial carcinoma [ICD-11: 2C94.2] | [3] | |||
| Resistant Disease | Bladder urothelial carcinoma [ICD-11: 2C94.2] | |||
| Resistant Drug | Gemcitabine | |||
| Molecule Alteration | Expression | Up-regulation |
||
| Differential expression of the molecule in resistant disease | ||||
| Classification of Disease | Bladder cancer [ICD-11: 2C94] | |||
| The Specified Disease | Bladder cancer | |||
| The Studied Tissue | Bladder tissue | |||
| The Expression Level of Disease Section Compare with the Healthy Individual Tissue | p-value: 6.26E-02 Fold-change: 2.58E-02 Z-score: 2.04E+00 |
|||
| Experimental Note | Identified from the Human Clinical Data | |||
| In Vitro Model | 5637 cells | Bladder | Homo sapiens (Human) | CVCL_0126 |
| T24 cells | Bladder | Homo sapiens (Human) | CVCL_0554 | |
| In Vivo Model | BALB/c nude mouse xenograft model | Mus musculus | ||
| Experiment for Molecule Alteration |
qRT-PCR; Western blotting assay | |||
| Experiment for Drug Resistance |
CCK8 assay | |||
| Mechanism Description | The expression levels of miR34a were decreased and GOLPH3 were increased in GC chemoresistant UBC cell lines. Down-regulation of miR34a resulted in the overexpression of GOLPH3.The ectopic expression of miR34a decreased the stem cell properties of chemoresistant UBC cells and re-sensitized these cells to GC treatment in vitro and in vivo. | |||
Disease- and Tissue-specific Abundances of This Molecule
ICD Disease Classification 02

| Differential expression of molecule in resistant diseases | ||
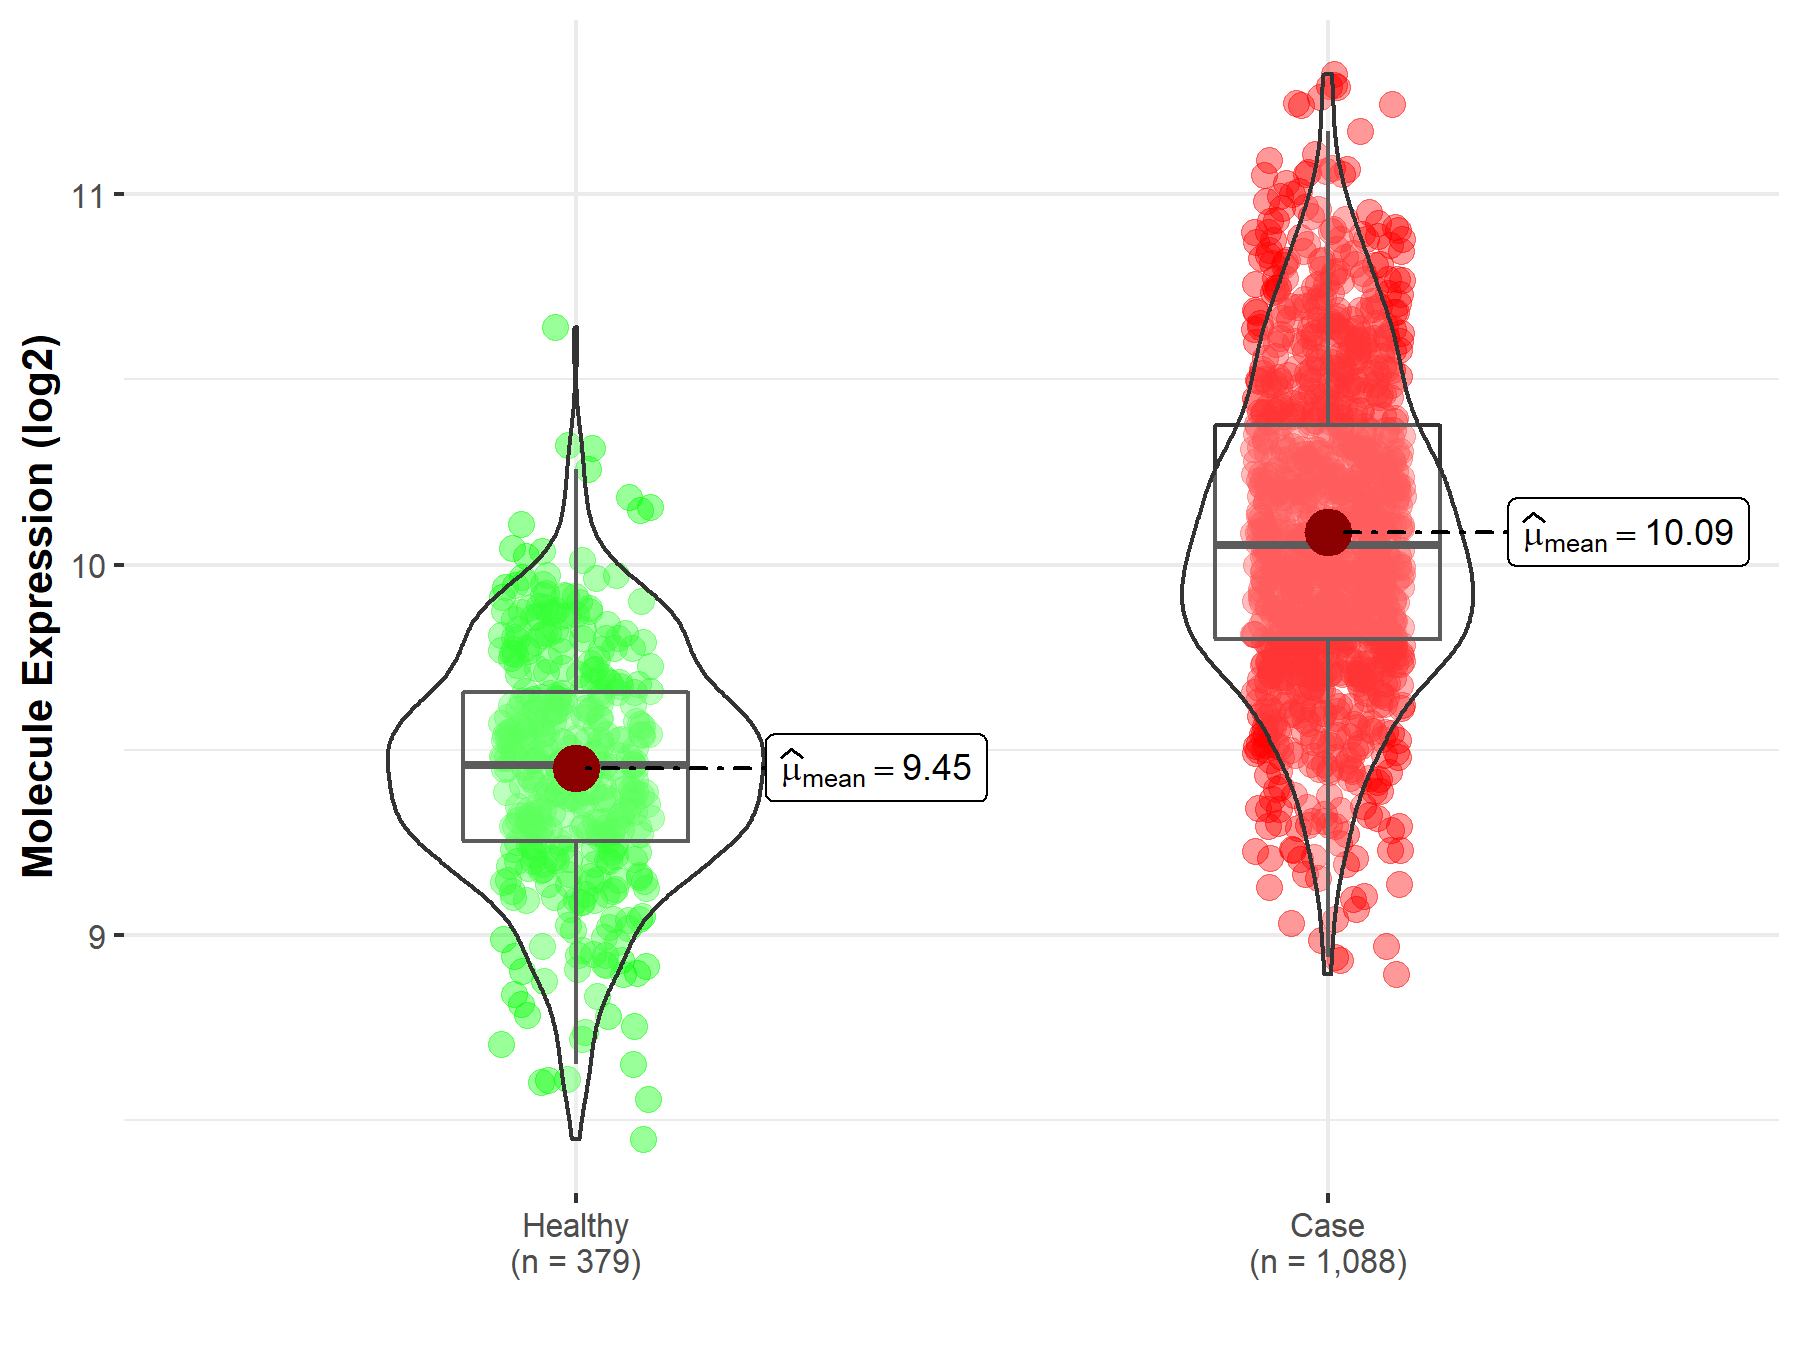
| The Studied Tissue | Nervous tissue | |
| The Specified Disease | Brain cancer | |
| The Expression Level of Disease Section Compare with the Healthy Individual Tissue | p-value: 2.21E-136; Fold-change: 5.94E-01; Z-score: 1.83E+00 | |
|
Molecule expression in the diseased tissue of patients
Molecule expression in the normal tissue of healthy individuals
|
||
| Disease-specific Molecule Abundances |
|
Click to View the Clearer Original Diagram |
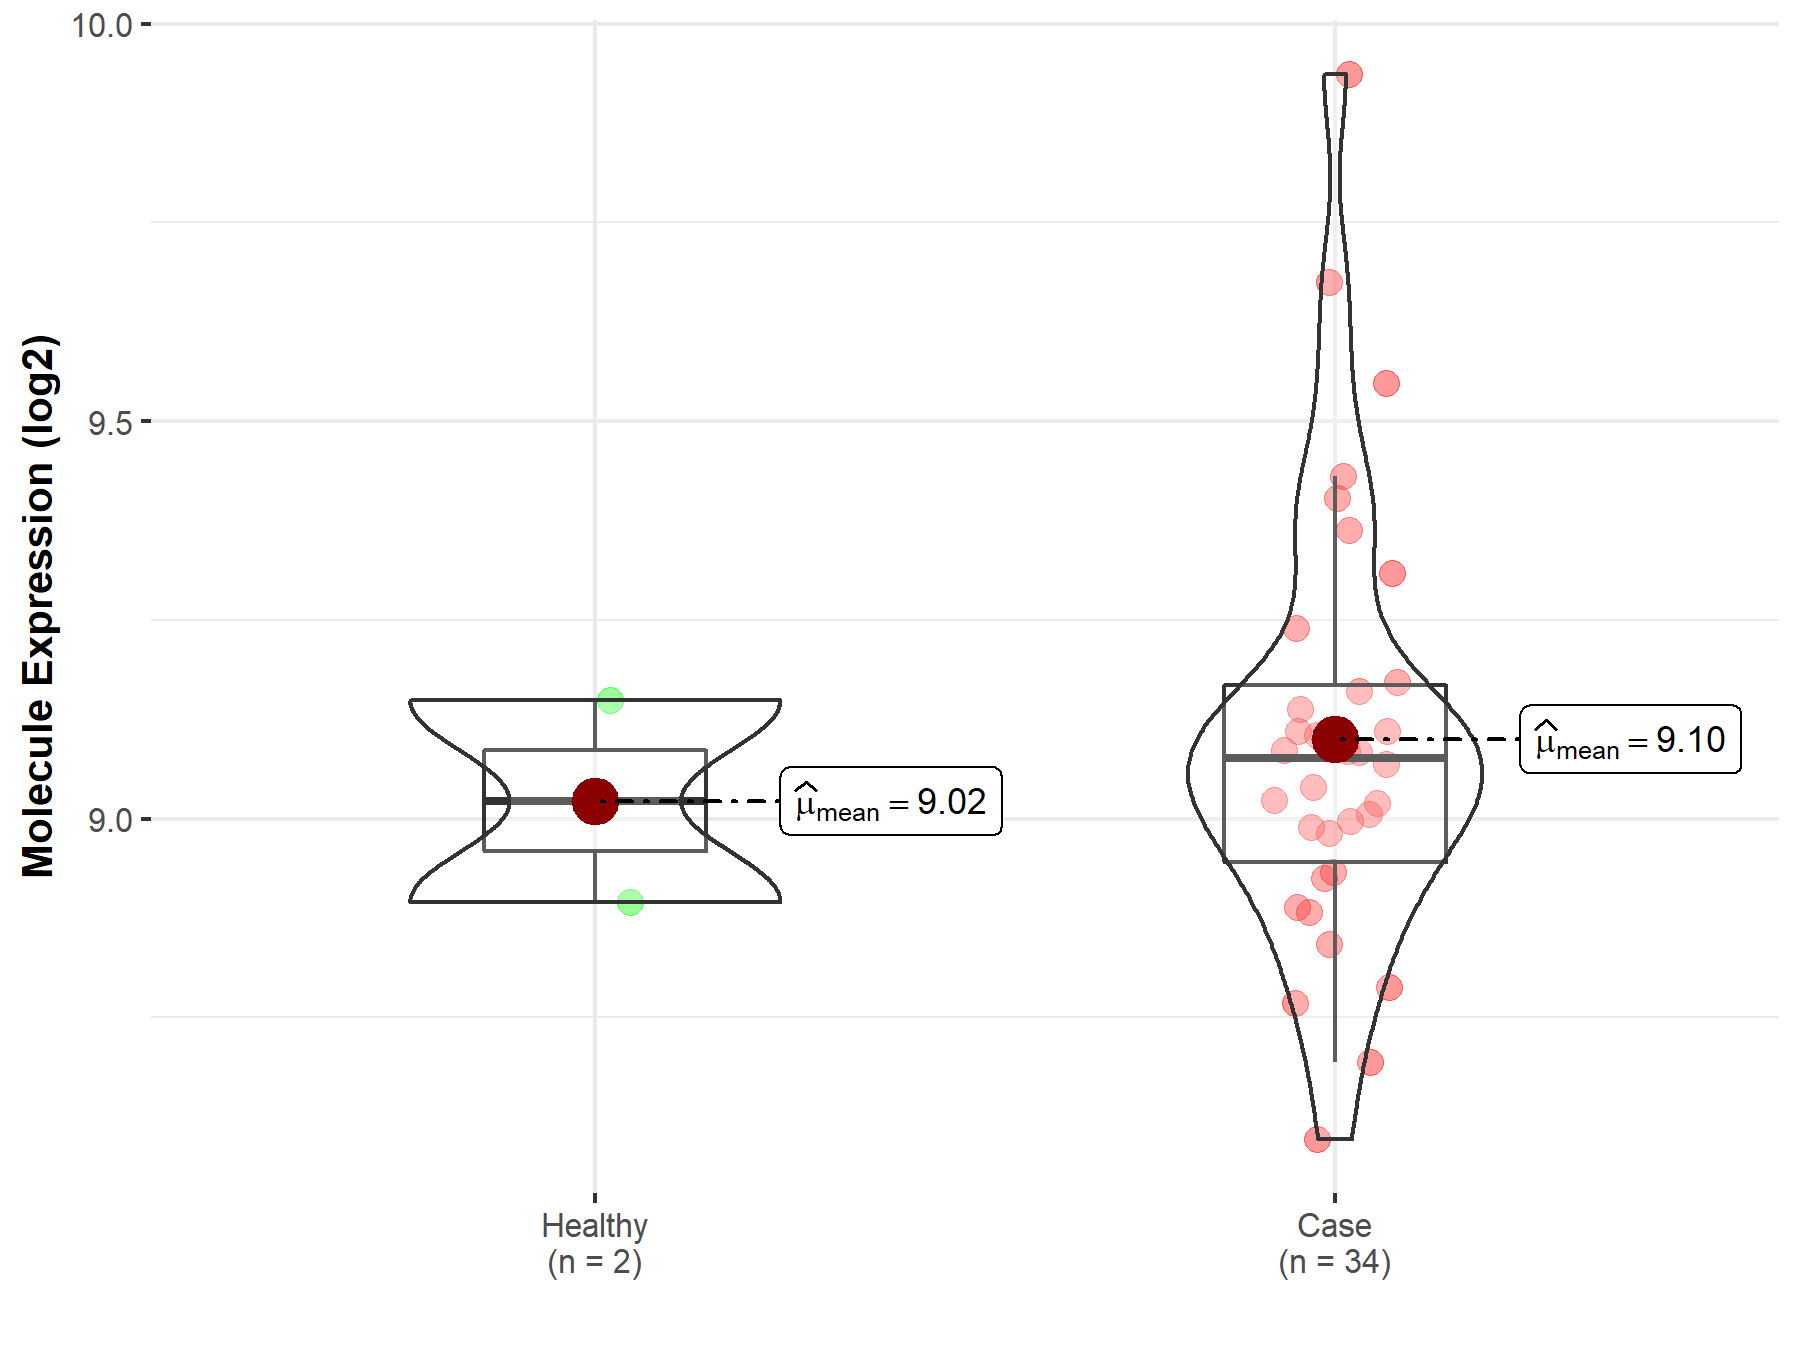
| The Studied Tissue | Brainstem tissue | |
| The Specified Disease | Glioma | |
| The Expression Level of Disease Section Compare with the Healthy Individual Tissue | p-value: 6.50E-01; Fold-change: 5.38E-02; Z-score: 2.99E-01 | |
|
Molecule expression in the diseased tissue of patients
Molecule expression in the normal tissue of healthy individuals
|
||
| Disease-specific Molecule Abundances |
|
Click to View the Clearer Original Diagram |
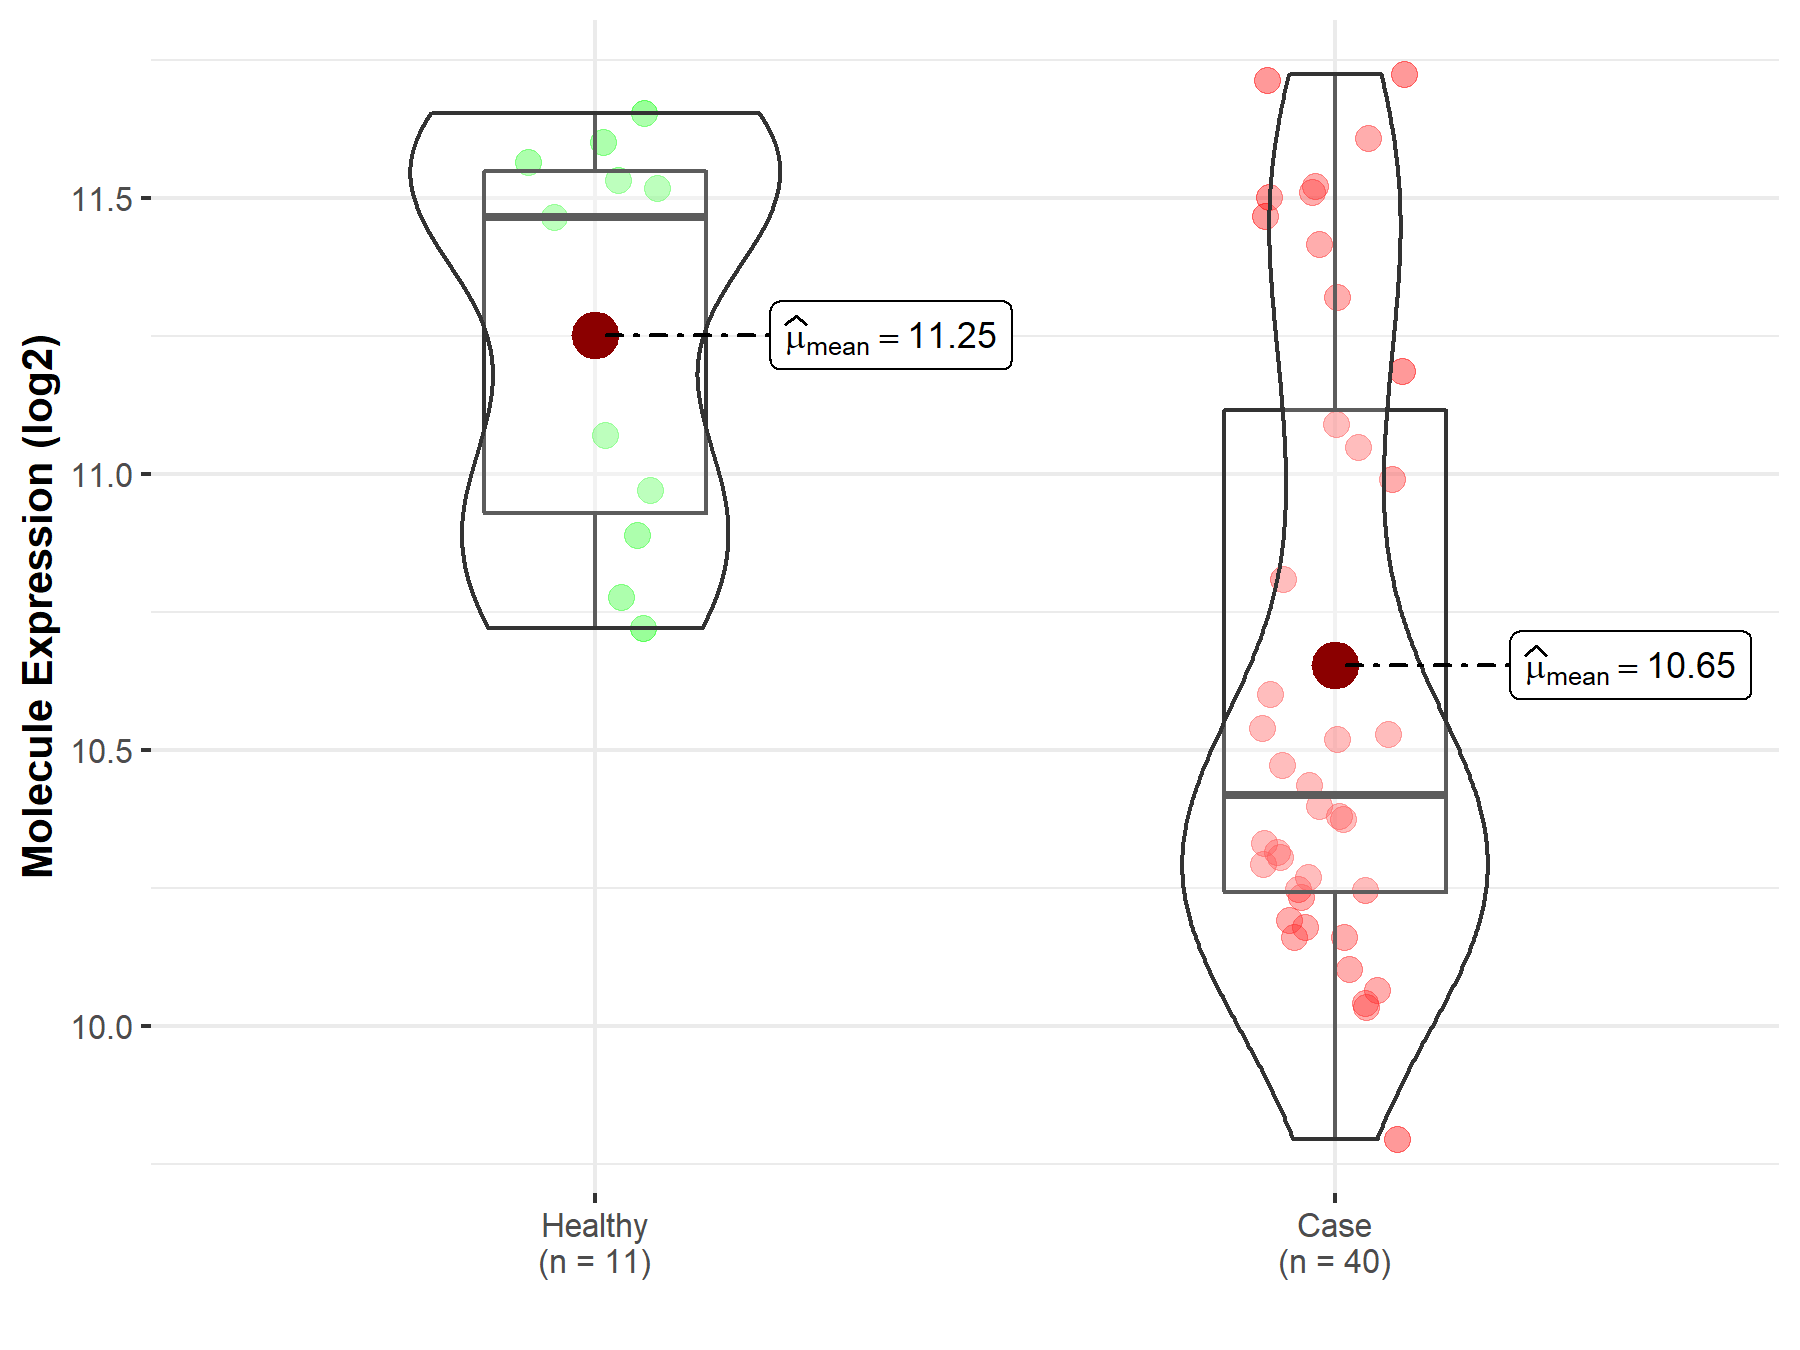
| The Studied Tissue | White matter | |
| The Specified Disease | Glioma | |
| The Expression Level of Disease Section Compare with the Healthy Individual Tissue | p-value: 2.81E-04; Fold-change: -1.05E+00; Z-score: -2.88E+00 | |
|
Molecule expression in the diseased tissue of patients
Molecule expression in the normal tissue of healthy individuals
|
||
| Disease-specific Molecule Abundances |
|
Click to View the Clearer Original Diagram |
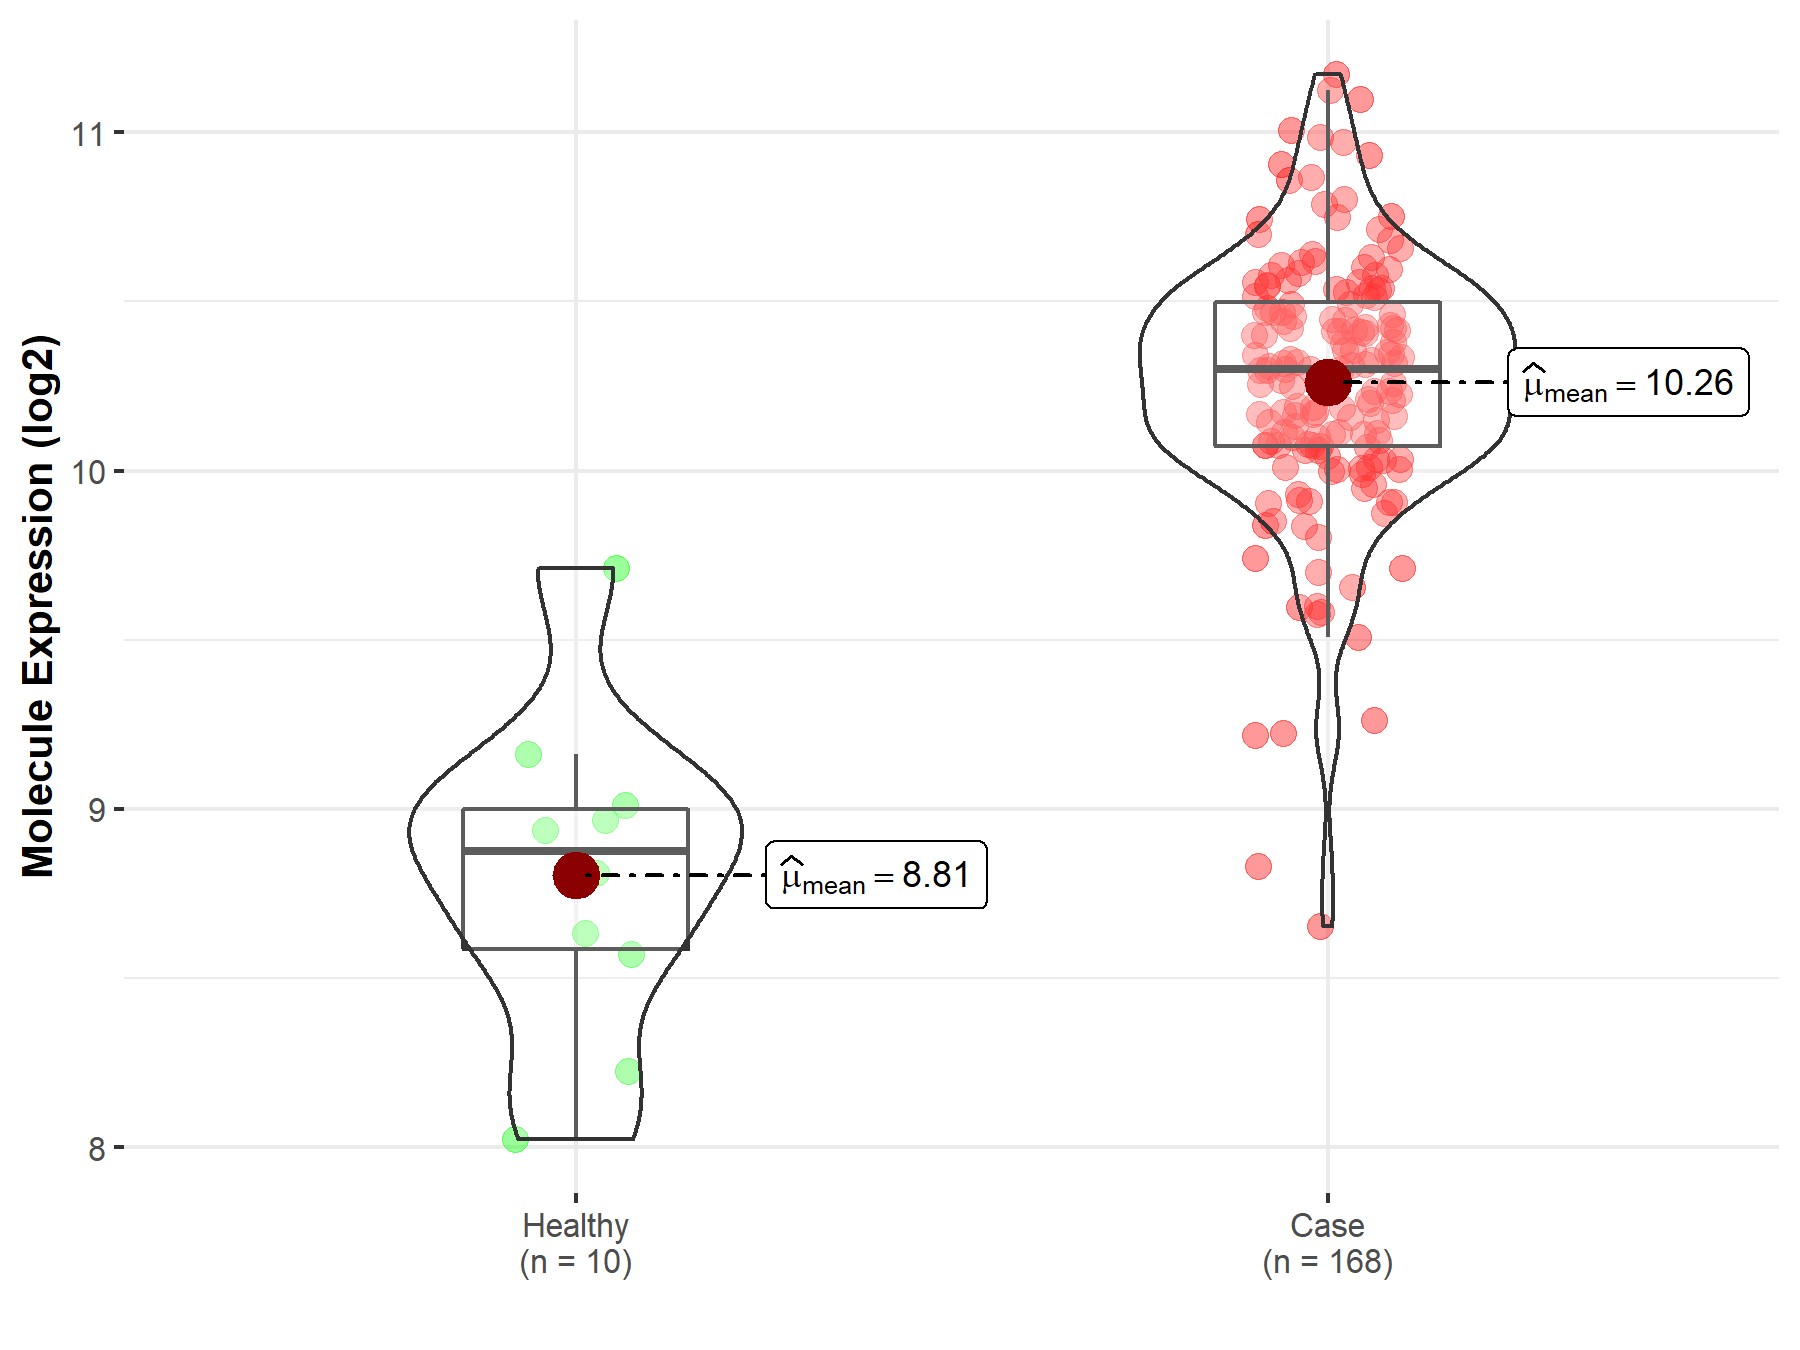
| The Studied Tissue | Brainstem tissue | |
| The Specified Disease | Neuroectodermal tumor | |
| The Expression Level of Disease Section Compare with the Healthy Individual Tissue | p-value: 3.40E-06; Fold-change: 1.42E+00; Z-score: 2.97E+00 | |
|
Molecule expression in the diseased tissue of patients
Molecule expression in the normal tissue of healthy individuals
|
||
| Disease-specific Molecule Abundances |
|
Click to View the Clearer Original Diagram |
| Differential expression of molecule in resistant diseases | ||
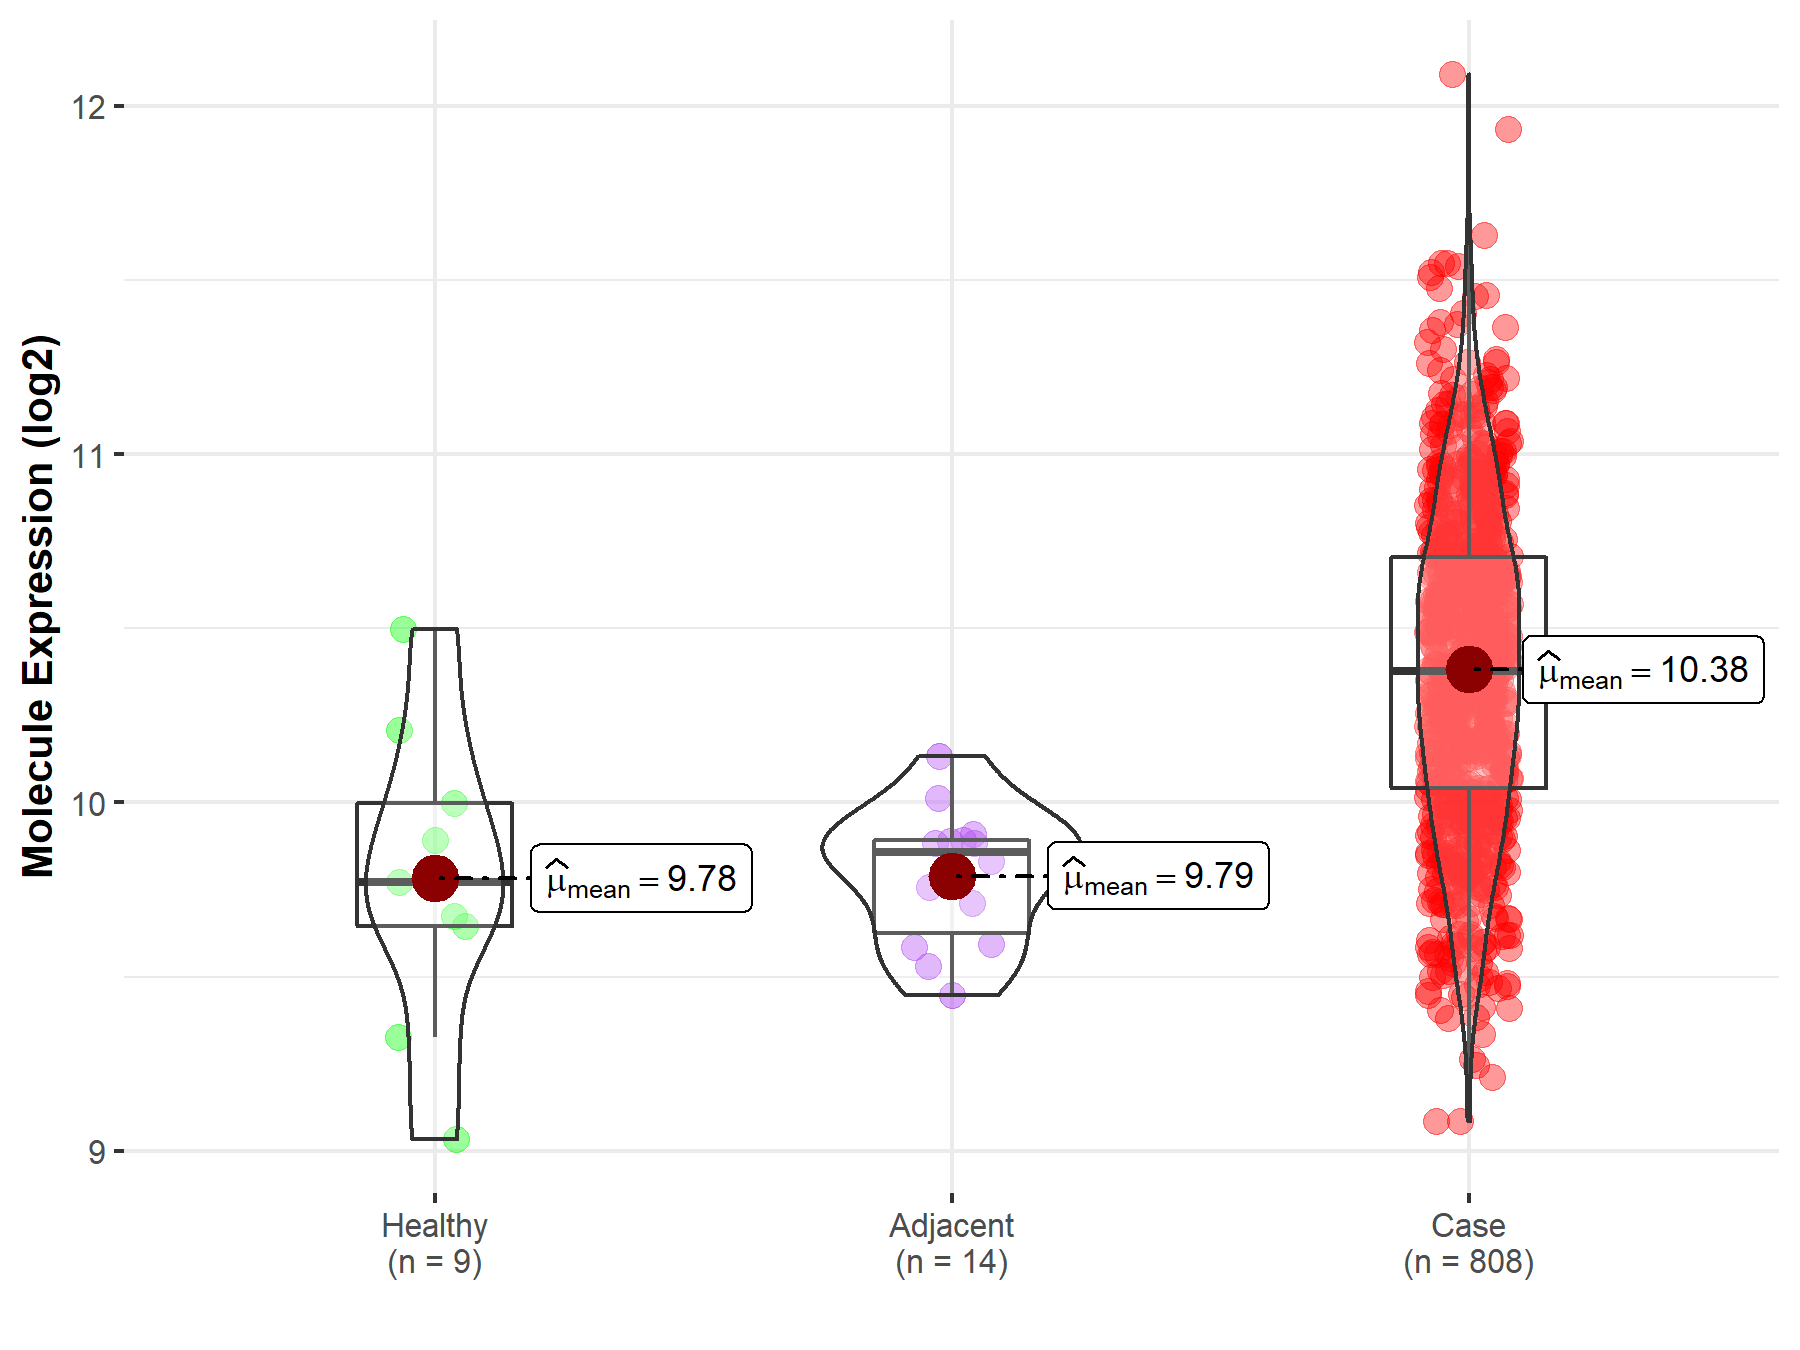
| The Studied Tissue | Ovary | |
| The Specified Disease | Ovarian cancer | |
| The Expression Level of Disease Section Compare with the Healthy Individual Tissue | p-value: 3.48E-03; Fold-change: 6.06E-01; Z-score: 1.38E+00 | |
| The Expression Level of Disease Section Compare with the Adjacent Tissue | p-value: 1.06E-08; Fold-change: 5.19E-01; Z-score: 2.66E+00 | |
|
Molecule expression in the normal tissue adjacent to the diseased tissue of patients
Molecule expression in the diseased tissue of patients
Molecule expression in the normal tissue of healthy individuals
|
||
| Disease-specific Molecule Abundances |
|
Click to View the Clearer Original Diagram |
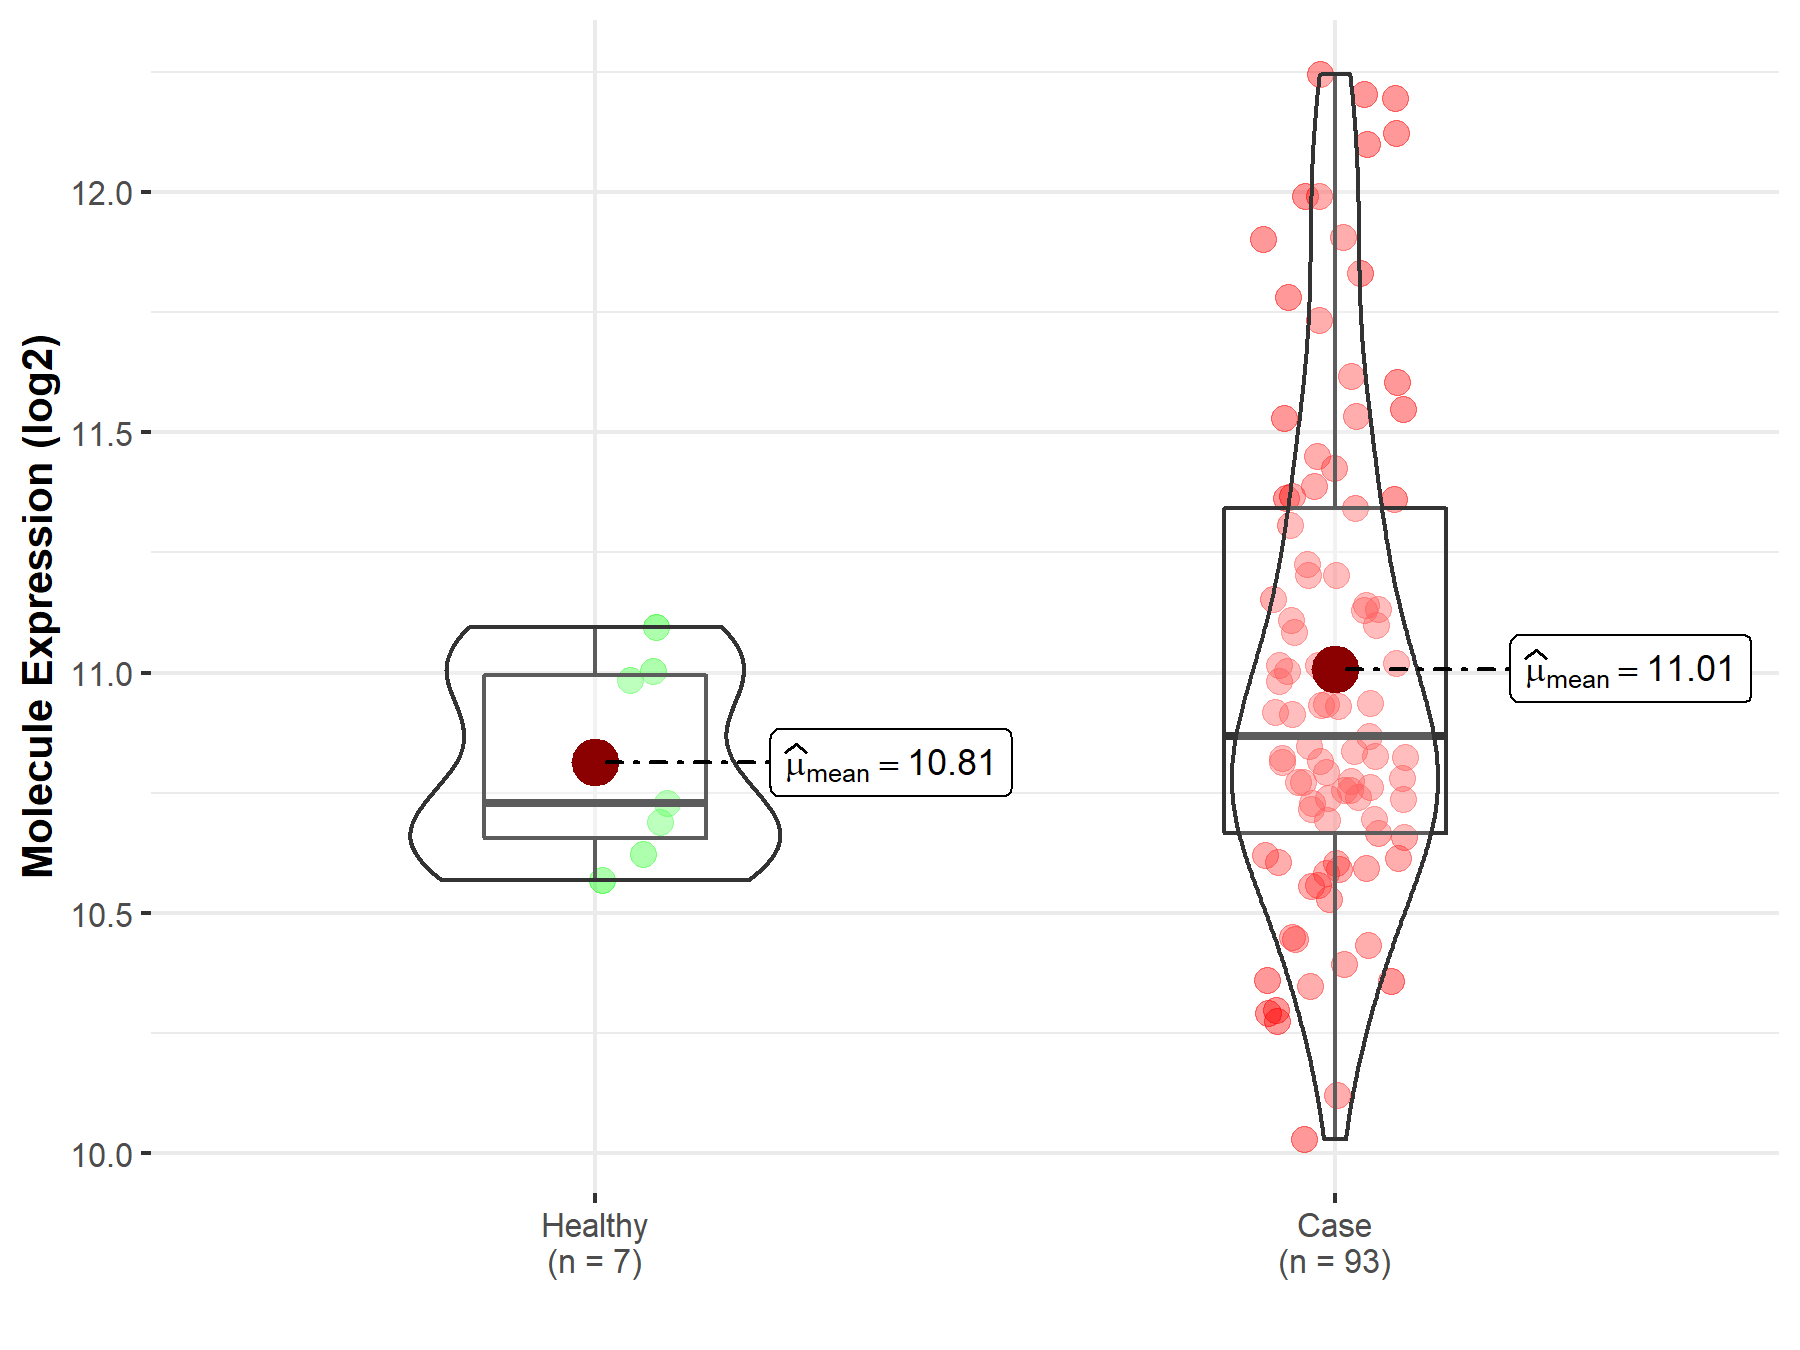
| Differential expression of molecule in resistant diseases | ||
| The Studied Tissue | Bladder tissue | |
| The Specified Disease | Bladder cancer | |
| The Expression Level of Disease Section Compare with the Healthy Individual Tissue | p-value: 6.26E-02; Fold-change: 1.41E-01; Z-score: 6.72E-01 | |
|
Molecule expression in the diseased tissue of patients
Molecule expression in the normal tissue of healthy individuals
|
||
| Disease-specific Molecule Abundances |
|
Click to View the Clearer Original Diagram |
Tissue-specific Molecule Abundances in Healthy Individuals

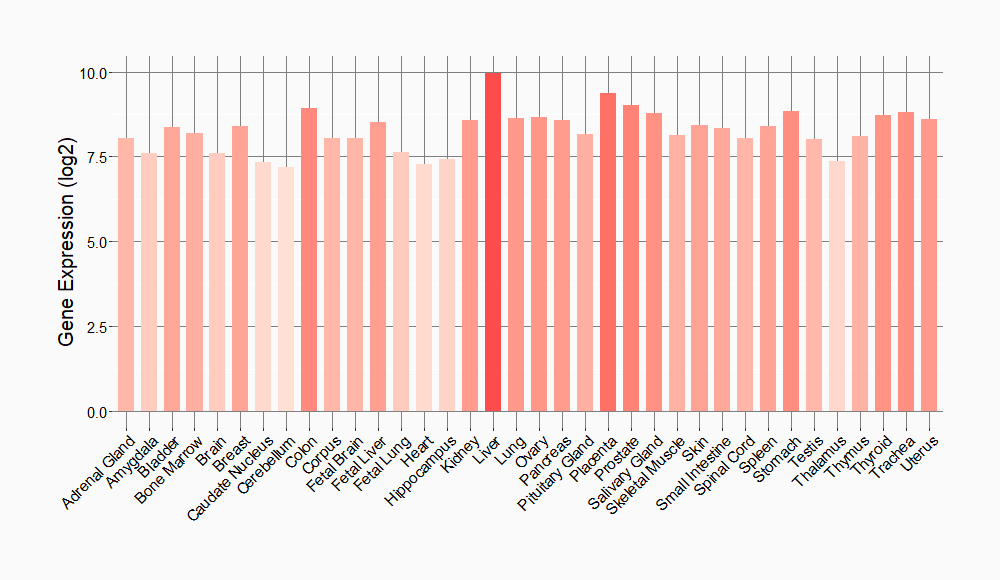
|
||
References
If you find any error in data or bug in web service, please kindly report it to Dr. Sun and Dr. Yu.