Molecule Information
General Information of the Molecule (ID: Mol00389)
| Name |
Transcription factor GATA6 (GATA6)
,Homo sapiens
|
||||
|---|---|---|---|---|---|
| Synonyms |
GATA-binding factor 6
Click to Show/Hide
|
||||
| Molecule Type |
Protein
|
||||
| Gene Name |
GATA6
|
||||
| Gene ID | |||||
| Location |
chr18:22169589-22202528[+]
|
||||
| Sequence |
MALTDGGWCLPKRFGAAGADASDSRAFPAREPSTPPSPISSSSSSCSRGGERGPGGASNC
GTPQLDTEAAAGPPARSLLLSSYASHPFGAPHGPSAPGVAGPGGNLSSWEDLLLFTDLDQ AATASKLLWSSRGAKLSPFAPEQPEEMYQTLAALSSQGPAAYDGAPGGFVHSAAAAAAAA AAASSPVYVPTTRVGSMLPGLPYHLQGSGSGPANHAGGAGAHPGWPQASADSPPYGSGGG AAGGGAAGPGGAGSAAAHVSARFPYSPSPPMANGAAREPGGYAAAGSGGAGGVSGGGSSL AAMGGREPQYSSLSAARPLNGTYHHHHHHHHHHPSPYSPYVGAPLTPAWPAGPFETPVLH SLQSRAGAPLPVPRGPSADLLEDLSESRECVNCGSIQTPLWRRDGTGHYLCNACGLYSKM NGLSRPLIKPQKRVPSSRRLGLSCANCHTTTTTLWRRNAEGEPVCNACGLYMKLHGVPRP LAMKKEGIQTRKRKPKNINKSKTCSGNSNNSIPMTPTSTSSNSDDCSKNTSPTTQPTASG AGAPVMTGAGESTNPENSELKYSGQDGLYIGVSLASPAEVTSSVRPDSWCALALA Click to Show/Hide
|
||||
| Function |
Transcriptional activator. Regulates SEMA3C and PLXNA2. Involved in gene regulation specifically in the gastric epithelium. May regulate genes that protect epithelial cells from bacterial infection. Involved in bone morphogenetic protein (BMP)-mediated cardiac-specific gene expression. Binds to BMP response element (BMPRE) DNA sequences within cardiac activating regions. In human skin, controls several physiological processes contributing to homeostasis of the upper pilosebaceous unit. Triggers ductal and sebaceous differentiation as well as limits cell proliferation and lipid production to prevent hyperseborrhoea. Mediates the effects of retinoic acid on sebocyte proliferation, differentiation and lipid production. Also contributes to immune regulation of sebocytes and antimicrobial responses by modulating the expression of anti-inflammatory genes such as IL10 and pro-inflammatory genes such as IL6, TLR2, TLR4, and IFNG. Activates TGFB1 signaling which controls the interfollicular epidermis fate.
Click to Show/Hide
|
||||
| Uniprot ID | |||||
| Ensembl ID | |||||
| HGNC ID | |||||
| Click to Show/Hide the Complete Species Lineage | |||||
Type(s) of Resistant Mechanism of This Molecule
Drug Resistance Data Categorized by Drug
Approved Drug(s)
2 drug(s) in total
| Drug Resistance Data Categorized by Their Corresponding Mechanisms | ||||
|
|
||||
| Disease Class: Prostate cancer [ICD-11: 2C82.0] | [1] | |||
| Resistant Disease | Prostate cancer [ICD-11: 2C82.0] | |||
| Resistant Drug | Paclitaxel | |||
| Molecule Alteration | Expression | Up-regulation |
||
| Differential expression of the molecule in resistant disease | ||||
| Classification of Disease | Prostate cancer [ICD-11: 2C82] | |||
| The Specified Disease | Prostate cancer | |||
| The Studied Tissue | Prostate | |||
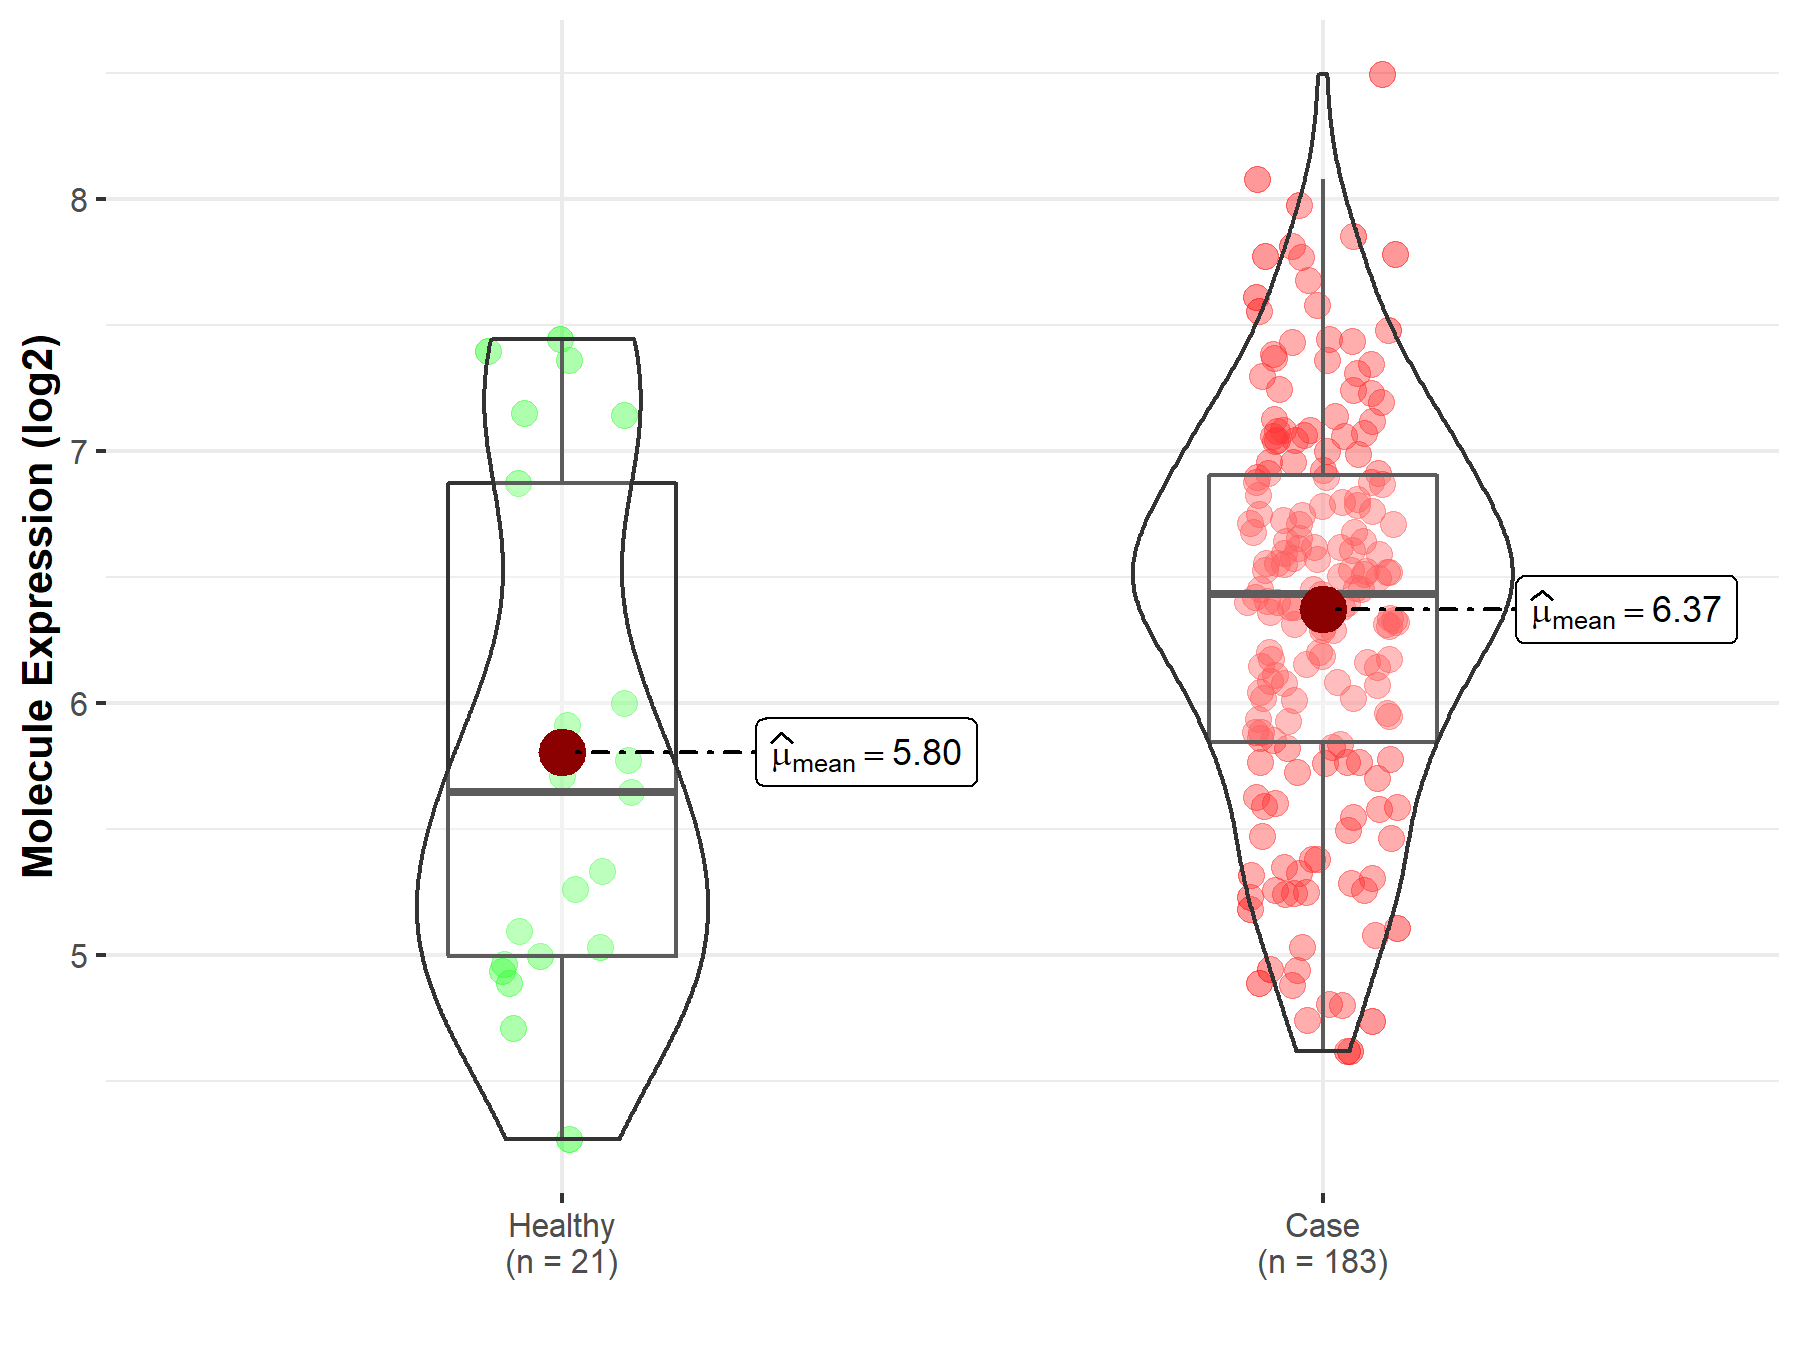
| The Expression Level of Disease Section Compare with the Healthy Individual Tissue | p-value: 2.12E-02 Fold-change: 1.34E-01 Z-score: 2.48E+00 |
|||
| Experimental Note | Revealed Based on the Cell Line Data | |||
| In Vitro Model | DU-145 cells | Prostate | Homo sapiens (Human) | CVCL_0105 |
| LNCaP cells | Prostate | Homo sapiens (Human) | CVCL_0395 | |
| PC3 cells | Prostate | Homo sapiens (Human) | CVCL_0035 | |
| RWPE-1 cells | Prostate | Homo sapiens (Human) | CVCL_3791 | |
| Experiment for Molecule Alteration |
Western blot analysis; RT-qPCR | |||
| Experiment for Drug Resistance |
MTT assay | |||
| Mechanism Description | Long non-coding RNA Linc00518 Can enhance GATA6 expression by suppressing miR-216b-5p expression to promotes paclitaxel resistance in the human prostate cancer. | |||
| Drug Resistance Data Categorized by Their Corresponding Mechanisms | ||||
|
|
||||
| Disease Class: Colorectal cancer [ICD-11: 2B91.1] | [2] | |||
| Resistant Disease | Colorectal cancer [ICD-11: 2B91.1] | |||
| Resistant Drug | Cetuximab | |||
| Molecule Alteration | Expression | Up-regulation |
||
| Experimental Note | Revealed Based on the Cell Line Data | |||
| Cell Pathway Regulation | Chemoresistance | Activation | hsa05207 | |
| Wnt/Beta-catenin signaling pathway | Inhibition | hsa04310 | ||
| In Vitro Model | HT29 Cells | Colon | Homo sapiens (Human) | CVCL_A8EZ |
| SW480 cells | Colon | Homo sapiens (Human) | CVCL_0546 | |
| DLD1 cells | Colon | Homo sapiens (Human) | CVCL_0248 | |
| SW620 cells | Colon | Homo sapiens (Human) | CVCL_0547 | |
| CaCo2 cells | Colon | Homo sapiens (Human) | CVCL_0025 | |
| HCT116 cells | Colon | Homo sapiens (Human) | CVCL_0291 | |
| LOVO cells | Colon | Homo sapiens (Human) | CVCL_0399 | |
| RkO cells | Colon | Homo sapiens (Human) | CVCL_0504 | |
| HCT8 cells | Colon | Homo sapiens (Human) | CVCL_2478 | |
| NCI-H508 cells | Colon | Homo sapiens (Human) | CVCL_1564 | |
| SW1116 cells | Colon | Homo sapiens (Human) | CVCL_0544 | |
| COLO 320DM cells | Colon | Homo sapiens (Human) | CVCL_0219 | |
| HCT15 cells | Colon | Homo sapiens (Human) | CVCL_0292 | |
| LS174T cells | Colon | Homo sapiens (Human) | CVCL_1384 | |
| NCI-H716 cells | Colon | Homo sapiens (Human) | CVCL_1581 | |
| SW948 cells | Colon | Homo sapiens (Human) | CVCL_0632 | |
| SW403 cells | Colon | Homo sapiens (Human) | CVCL_0545 | |
| SW48 cells | Colon | Homo sapiens (Human) | CVCL_1724 | |
| COLO205 cells | Colon | Homo sapiens (Human) | CVCL_F402 | |
| HuTu80 cells | Small intestine | Homo sapiens (Human) | CVCL_1301 | |
| LS123 cells | Colon | Homo sapiens (Human) | CVCL_1383 | |
| SK-CO-1 cells | Colon | Homo sapiens (Human) | CVCL_0626 | |
| SW837 cells | Colon | Homo sapiens (Human) | CVCL_1729 | |
| T84 cells | Colon | Homo sapiens (Human) | CVCL_0555 | |
| In Vivo Model | Nude mouse xenograft model | Mus musculus | ||
| Experiment for Molecule Alteration |
qPCR; Sequencing assay; Western blot analysis; Immunofluorescent staining assay | |||
| Experiment for Drug Resistance |
CCK8 assay | |||
| Mechanism Description | There is a double-negative feedback loop between MIR100HG and the transcription factor GATA6, whereby GATA6 represses MIR100HG, but this repression is relieved by miR125b targeting of GATA6. | |||
Disease- and Tissue-specific Abundances of This Molecule
ICD Disease Classification 02

| Differential expression of molecule in resistant diseases | ||
| The Studied Tissue | Prostate | |
| The Specified Disease | Prostate cancer | |
| The Expression Level of Disease Section Compare with the Healthy Individual Tissue | p-value: 2.12E-02; Fold-change: 7.87E-01; Z-score: 7.75E-01 | |
|
Molecule expression in the diseased tissue of patients
Molecule expression in the normal tissue of healthy individuals
|
||
| Disease-specific Molecule Abundances |

|
Click to View the Clearer Original Diagram |
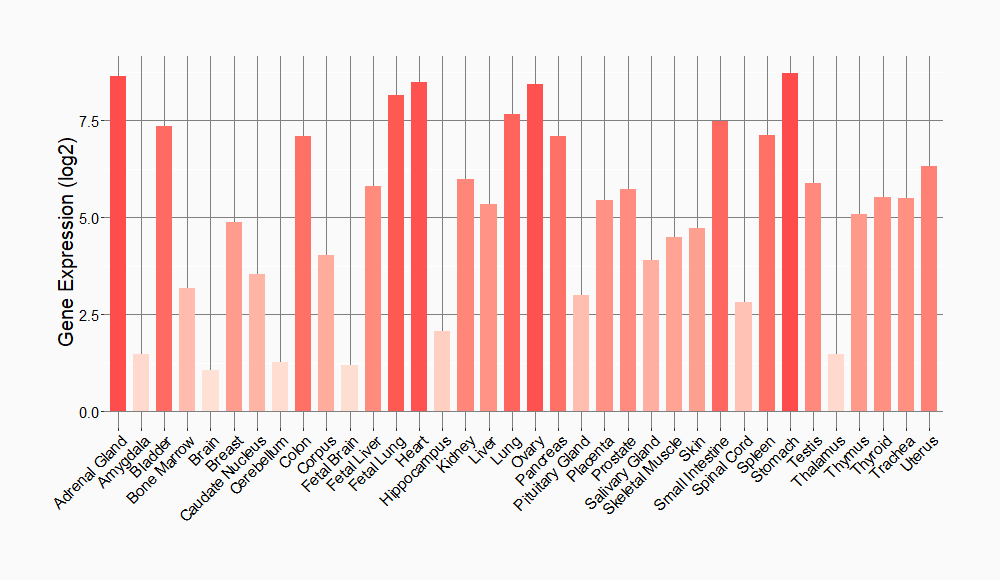
Tissue-specific Molecule Abundances in Healthy Individuals


|
||
References
If you find any error in data or bug in web service, please kindly report it to Dr. Sun and Dr. Yu.
